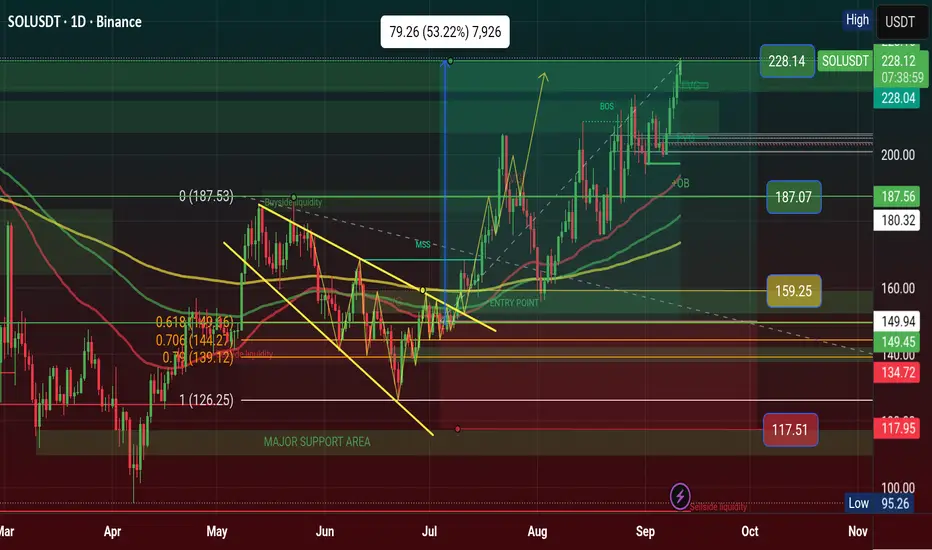
SOLUSDT NEW TIMES COMING? Thank you for reading this update.
Solona looks to have a new incoming volume
Will this bring this volume Solana to $100 with time?
This volume depends on day trade and has no guarantees for the long term.
Solusdt

$SOL Finally hit $228 and My Prediction is Done CRYPTOCAP:SOL Finally hit $228 and My Prediction is Done, Next week if Retest and Breakout it will be $333 price in 2026 of Q1, Solana will Archived the price when we are HOLD.
From News, Solana Climbs to $225 as Analysts Predict Strong Year-End 2025 - 2026 Prediction price will hit $333 1st Quarter.
Solana surged to a seven-month high this week, touching nearly $225 as demand from institutions and speculation around ETFS lifted momentum. The token is up 25% in the past month, marking the best performance among the top 10 crypto assets.
Digital asset treasuries have been steadily accumulating Solana throughout 2025. Firms such as Upexi and DeFi Development Corp. each disclosed holdings of over $400 million in the token since January. Forward Industries added fuel to the trend earlier this week, announcing a $1.65 billion private investment in public equity to establish a Solana treasury. The plan, spearheaded by Multicoin Capital's Kyle Samani, could create the largest publicly traded SOL treasury if executed.
ETF applications tied to Solana are also awaiting SEC decisions. Issuers including Bitwise, Canary Funds, and 21Shares have filed proposals, while analysts expect approvals on CRYPTOCAP:SOL , CRYPTOCAP:XRP , and Dogecoin ETFS
sometime in 2025. Market research platforms have taken note of the shifting sentiment. Prediction markets on Myriad now give Solana a 57% chance of reaching a new all-time high this year, up from 23% just weeks ago.
Despite trading about 24% below its January peak of $293.31, Solana's rally has made it one of the strongest performers among major assets. Hougan emphasized that the relative size of Solana compared to Bitcoin and Ethereum means even modest ETF inflows could have an outsized effect on price.
He estimated that Forward's planned treasury allocation, if fully executed, would be equivalent to a $33 billion purchase in Bitcoin terms. With Solana at $221 at press time, investors are closely monitoring whether ETF approvals and treasury expansion will drive the next leg upward.
#Write2Earn #BinanceSquareFamily #Binance #SOL #SUBROOFFICIAL
Disclaimer: This article is for informational purposes only and does not constitute financial advice. Always conduct your own research before making any investment decisions. Digital asset prices are subject to high market risk and price volatility. The value of your investment may go down or up, and you may not get back the amount invested. You are solely responsible for your investment decisions and Binance is not available for any losses you may incur. Past performance is not a reliable predictor of future performance. You should only invest in products you are familiar with and where you understand the risks. You should carefully consider your investment experience, financial situation, investment objectives and risk tolerance and consult an independent financial adviser prior to making any investment.
#SOL/USDT → Stronger than the market. Correction before growth#SOL
The price is moving within a descending channel on the 1-hour frame and is expected to break and continue upward.
We have a trend to stabilize above the 100 moving average again.
We have a downtrend on the RSI indicator that supports the upward move with a breakout.
We have a support area at the lower boundary of the channel at 207, acting as strong support from which the price can rebound.
We have a major support area in green that pushed the price upward at 205.
Entry price: 210.
First target: 214.
Second target: 219.
Third target: 225.
To manage risk, don't forget stop loss and capital management.
When you reach the first target, save some profits and then change the stop order to an entry order.
For inquiries, please comment.
Thank you.

SOL/USDT –> Double Bottom Breakout with Bullish DivergenceHello guys!
Solana has completed a double bottom pattern and broken above the neckline, signaling bullish momentum. Here’s the breakdown:
1-Pattern Formation
A clear double bottom has formed around the $200 zone.
The neckline breakout happened at ~$213–214, confirming the reversal.
2- Momentum Confirmation
Bullish divergence on RSI supported the double bottom.
While price made equal lows, RSI showed higher lows → early sign of trend reversal.
3-Entry Options
Market entry
Pullback entry: Around the $210 area, in case of a retest of the neckline zone.
5- Target
The projected move from the pattern points to $222.
This also aligns with the next resistance area.
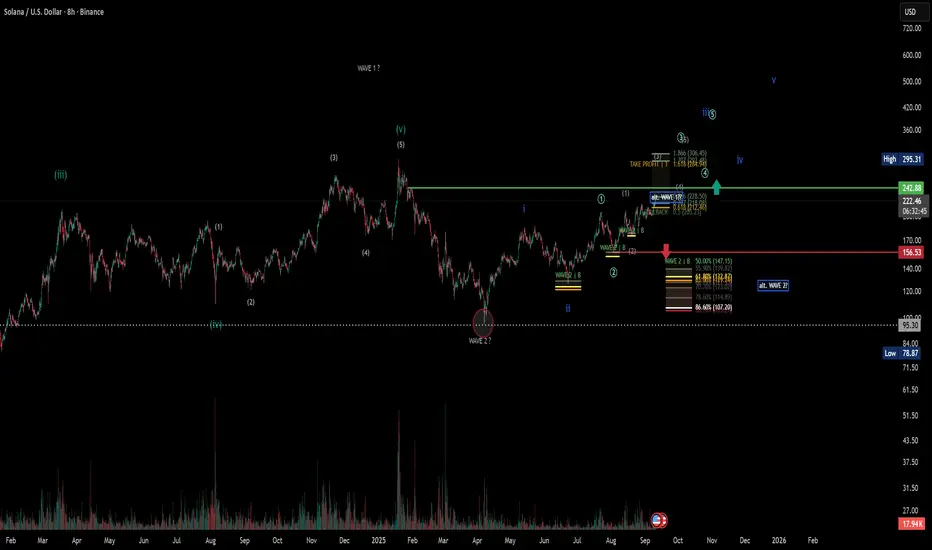
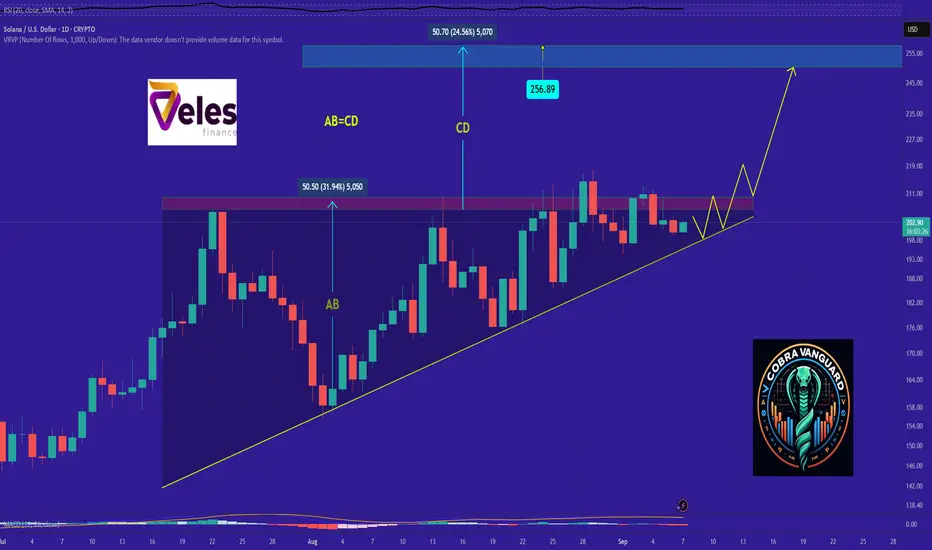
Solana (SOL) – Chart AnalysisToday, I would like to share my current view of the Solana chart with you. I am currently tracking three possible scenarios:
Scenario 1 – Preferred: ABC correction to wave 2
In this scenario, I assume that Solana has not yet found its final bottom at around $95 on April 7, 2025.
In my opinion, wave A was only completed at that point.
We are currently moving correctively in wave B before a larger sell-off begins in wave 2.
For wave B, I expect targets in the range of $276–300.
If this range is clearly exceeded, a wave B extension to around $419 is also possible (regular chart).
Variant 2 – Long wave 4 (less preferred)
In this case, wave 4 would be completed on April 7, 2025, after an extended correction (ABC with overshooting wave B).
We would now already be in the final wave 5.
This would have potential up to the 0.618 level at around USD 516 or higher.
Important: I am looking at this variant in the logarithmic chart, as otherwise the levels do not fit neatly.
Nevertheless, this scenario is not my preferred assumption at present.
Variant 3 – very bullish scenario
Another possibility would be that wave 2 was already completed on April 7, 2025.
In this case, we would already be in a new uptrend with several 1/2 structures, which would make the chart look very bullish.
Confirmation would come if the $300 mark were to be sustainably exceeded – then this scenario could quickly become the primary one.
However, as the structure is not yet convincing, I remain cautious and continue to favor the ABC correction (scenario 1).
📌 Summary
My main scenario remains an ABC correction to wave 2 with a possible bottom between $50 and $30 (this is also where my long-term risk management lies).
Nevertheless, the various variants present exciting opportunities for traders, both in the short and medium term.
Solana therefore remains a coin that I continue to monitor very closely – especially in conjunction with the Bitcoin chart. This could also still be in a wave 4 correction before the final upward move takes place.
$SOL - ASCENDING ACCUMULATIONCRYPTOCAP:SOL - Ascending accumulation!
Strong uptrend daily; Bullish breakout awaited! 📈
Upper key resistance: 266 - 270$
Solana’s Treasury Boom: Institutional Surge and Nasdaq MilestoneInstitution adoption and viewing of SOL as a major treasury asset have caused Solana's treasury economy to boom in September 2025, as shown by SOL Strategies' historic On September 9, Nasdaq debuted under the ticker STKE, becoming the first Solana-focused company to list there while still trading on the Canadian Securities Exchange under HODL; Ranking third among institutional holders, the corporation possesses 435,064 SOL worth nearly $94 million; validator activities delegated 3.62 million SOL throughout 8,812 wallets. backed also by Cathie Wood's ARK Invest, which moved 3.6 million SOL (roughly C$888 million) in July. Led by Upexi, corporate assets have exploded such that 13 public businesses currently handle almost $1.8 billion in Solana treasuries, or 8.90 million SOL or 1.55% of the circulating supply. With 2,000,518 SOL valued at around $444 million, Inc. and 1,988,170 SOL DeFi Development Corp. Forward Industries revealed a $1.65 billion private placement on September 8, led by Galaxy Digital, Jump Crypto, and Multicoin Capital to help develop a Solana-centric treasury for digital assets. With Multicoin's Kyle Samani slated to become Chairman once completed, the Solana-centric treasury for digital assets.
Market Movements: Navigating the Price Trends of SOL
The SOL/USD surged more than 10% in the past two days. Near-term support is identified at $200, with a drop below this level potentially leading to targets of $180/$140/$123/$117/$100. Immediate resistance is noted at around $250, where a breach could push prices up to $265, or even $300.
It is good to buy on dips around $180, with a stop-loss set at $140 and a target price of $300.

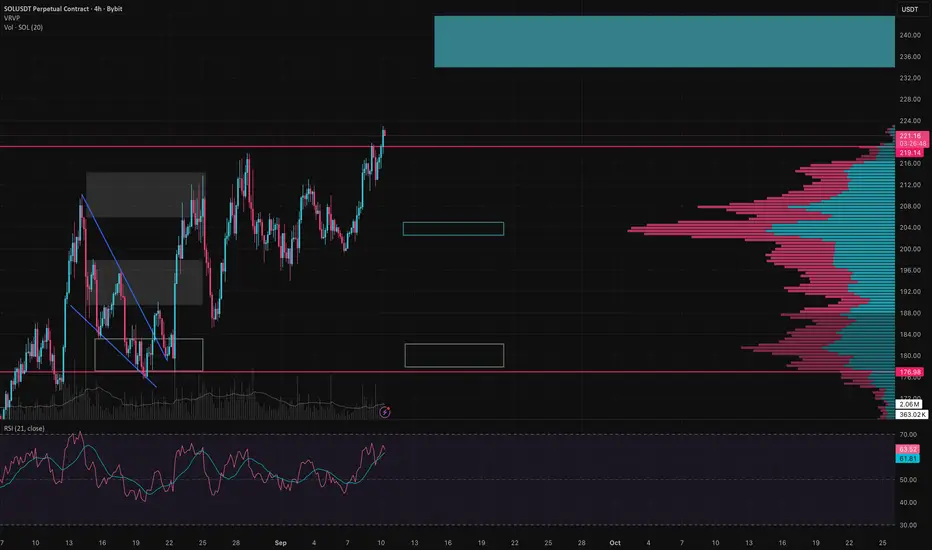
SOL Weekly Update – Bulls Losing Steam?SOL is testing a strong resistance zone right now. The problem I see is that RSI is already running hot and the volume keeps dropping. Price is pushing up, but buyers aren’t showing real conviction. That’s why I’m leaning toward a correction into the 202–204 range. This level looks like a good spot to start looking for long entries if the reaction is strong enough.
🔹 Bullish scenario: if we get a confirmed daily close above 222 with higher volume, the next target zone sits at 234–242. From there, bulls will need to prove they still have momentum, otherwise we could see another local correction.
🔹 Bearish scenario: a break and close below 201 opens the way for a move into 178–182, which is the POC zone with the heaviest traded volume. That level should act as major support if the correction deepens.
RSI is showing that the market is overheated, but it doesn’t mean the rally is over. If buyers suddenly show strength and step in with volume, we could still get another impulsive leg higher before any pullback.
My view: while price is grinding higher on weak volume, the risk of a drawdown into 202–204 is much higher than a clean breakout. That’s the zone I’ll be watching closely for long setups.
Disclaimer: The author’s opinion may not align with yours
Solana Price Hits 7-Month High But Caution Awaits SOL HoldersAt the time of writing, Solana trades at $219, holding firm above its $214 support floor. This represents a seven-month high, with the token facing resistance at $221. Sustaining this level will be crucial in shaping short-term direction.
Should momentum fade, Solana’s price could retrace to $206 or even lower, testing $195 as support. Such a correction would align with the RSI and address data signals pointing to short-term cooling.
Conversely, if existing SOL holders increase demand, the altcoin could defy bearish signals. A breakout above $221 would strengthen the bullish case, potentially driving Solana toward $232 and invalidating expectations of an imminent decline.

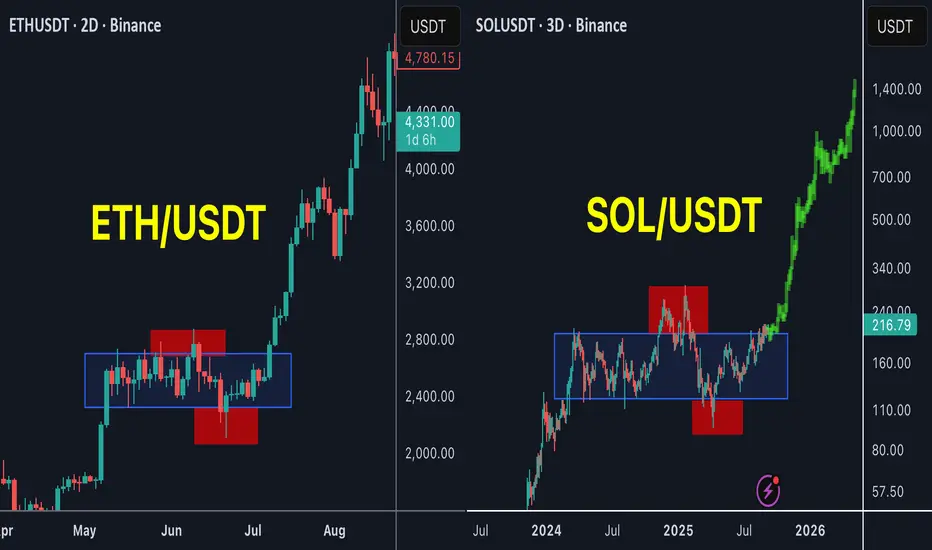
SOL is the next ETH !SOL / USDT
SOL is forming the same pattern as ETH before the huge breakout in past few weeks
Accumulation with 2 major stoploss hunt for bulls and bears and now is trying to breakout the accumulation zone
History show high success rate of this pattern
Will SOL be the next ETH ?
Best of wishes
Record Breaking Solana Highs & The Rise of Dark DexsDark DEXs routed through aggregators are eating Solana spot flow- leaving BINANCE:SOLUSDT & BINANCE:JUPUSDT as the cleanest upside while order-book DEXs fight for share.
TVL on Solana just hit all-time highs, with the biggest lift coming via Jupiter (JUP) routing.
Over the last 30 days, the largest spot volume was on a private “dark DEX” (Humidifi) - not Meteora, BINANCE:RAYUSDT , or BYBIT:PUMPUSDT .
These private venues plug into Jupiter’s aggregator, filling at better prices; efficiency accrues to the dark DEXs + the aggregator + the chain.
Net result: Raydium/Orca can rise with the tide short-term, but market share pressure is real if dark routing keeps compounding.
Trade view: The most direct upside is SOL + JUP. SOL’s pivotal level ≈ $175 - sustained breakout targets $250, then thin resistance up to ~$300.
Watching JUP share of routed volume, SOL TVL/fees, and spot depth for confirmation.
Not financial advice. Do your own research.

SOL - Solana +50% INCREASE Possible??SOL could be setting up for a big increase.
It's interesting to see how the price previously reacted around this resistance zone.
1️⃣ After a 100% increase, the price traded just around this zone for about 4 weeks when it dropped under, only to take another go at the zone 3 months later and get rejected again
2️⃣ second time increases by 63% in 3 weeks and the price shoots right through, after making a new high the chart went into a mini bearish cycle for a few weeks up until where we are now.
3️⃣ Price closes ABOVE key resistance zone, another high on the way in the next few weeks?
Capturing this zone is definitely bullish for Solana - now to see how far we can go but judging by previous increases, we could easily see a +50 if ETH increases as well.

Solana's Price Coils in Rare Bullish FormationSolana's Price Coils in Rare Bullish Formation, Hinting at a Potential Rally to $230
Solana (SOL) has captured the attention of the cryptocurrency market, with its price charting a course that suggests a significant upward movement may be on the horizon. After a robust gain over the past month and a powerful rebound from its recent lows, the high-performance blockchain's native token is trading within a classic technical pattern known as a symmetrical triangle. A decisive breakout from this formation could propel SOL towards a price target of $230 in the coming days, a move supported by strengthening on-chain metrics, resurgent NFT market activity, and bullish sentiment in the derivatives market.
The digital asset has shown considerable strength, rallying to intraday highs well above the $200 mark before stabilizing. This price point not only marks a significant recovery but also positions SOL tantalizingly close to the upper boundary of its consolidation pattern. This technical setup, combined with strong fundamental tailwinds, is creating a compelling narrative for a potential bullish continuation.
The Anatomy of a Bullish Setup: The Symmetrical Triangle
At the heart of the current bullish thesis for Solana is the formation of a symmetrical triangle on its price chart, a pattern that has been developing over recent weeks. In technical analysis, a symmetrical triangle is characterized by two converging trendlines—one descending line connecting a series of lower highs and one ascending line connecting a series of higher lows. This pattern visually represents a period of consolidation and indecision in the market, where the trading range tightens and volatility contracts. It signifies a temporary equilibrium between buyers and sellers, often preceding a significant price move or "breakout."
While a symmetrical triangle is technically a continuation pattern—suggesting the price will likely resume the trend it was in prior to the triangle's formation—it can break in either direction. However, for Solana, which has been in a broader uptrend, a breakout to the upside is the more anticipated outcome. Analysts are closely watching for a decisive close above the triangle's upper trendline, ideally accompanied by a spike in trading volume, which would serve as confirmation of the breakout.
Multiple analyses converge on a significant price target should this breakout occur. The height of the triangle at its widest point, projected upward from the breakout point, suggests a potential rally that could take SOL to the $230 mark. Other technical strategists have identified targets in a similar range, with some pointing to the $230-$235 area and others looking at a near-term pivot range that could open the path toward higher targets.
Strengthening this possibility are key momentum indicators. The Moving Average Convergence Divergence (MACD), a popular trend-following indicator, has shown its primary line crossing above its signal line, a classic sign of a strengthening uptrend and building bullish momentum.
The Road to Recovery: A Powerful Rebound Ignites Momentum
Solana's current consolidation does not exist in a vacuum. It follows a period of impressive recovery that has renewed investor confidence. After dipping to a notable low in the preceding month, SOL has mounted a formidable comeback of over 30%. This rebound demonstrates strong buying pressure at lower price levels and has established a solid foundation for the current market structure.
Over the past month alone, SOL has registered a double-digit percentage increase in value, a period during which the symmetrical triangle began to take shape. This price action suggests that the recent consolidation is a healthy pause, allowing the market to digest recent gains before a potential next leg up. The series of higher lows established since late August is particularly constructive, indicating that buyers remain active and are stepping in to defend key support levels.
The cryptocurrency is currently consolidating above a critical support level in the high $190s. This price zone is considered highly significant by on-chain analysts, as a massive volume of tokens has historically been traded at this level, creating a strong foundation of support that bulls are actively defending.
Beyond the Charts: Fundamental Tailwinds Gathering Strength
While the technical picture is compelling, a confluence of fundamental factors is adding significant weight to the bullish case for Solana.
The NFT Ecosystem Reawakens
A notable catalyst has been a sharp resurgence in activity within Solana's non-fungible token (NFT) ecosystem. In a recent notable 24-hour window, sales volume for Solana-based NFTs experienced a dramatic spike, more than doubling from the previous day's figures and reaching well into the millions of dollars. This surge propelled Solana to become the second-largest NFT market globally by daily sales volume, trailing only Ethereum.
This spike was largely driven by the explosive popularity of certain new collections, which saw their daily sales volumes skyrocket by orders of magnitude. Other collections also posted significant gains. While the broader NFT market has seen fluctuations, Solana's performance showcases a notable relative strength and a growing appeal for its high-speed, low-cost architecture among NFT creators and collectors. This renewed retail and speculative interest in Solana's NFT scene could be a powerful driver of market momentum.
Bullish Bets in the Derivatives Market
Sentiment among professional traders, especially in the derivatives market, has shifted decisively toward a bullish outlook. Open interest in SOL futures, which represents the total value of all outstanding futures contracts, has seen a substantial increase over the past month, climbing by several billion dollars. This indicates a high degree of speculative interest and suggests a growing number of traders are positioning for a future price increase.
Furthermore, SOL's weighted funding rate has remained consistently positive for an extended period. The funding rate is a mechanism used by perpetual futures exchanges to keep the contract price in line with the spot price. A positive funding rate indicates that traders holding long positions are paying a premium to those holding short positions, a clear sign that the prevailing sentiment is bullish and traders expect the price to continue rising.
The Institutional Stamp of Approval
A steady drumbeat of institutional adoption continues to provide a strong fundamental floor for Solana's valuation. The launch and subsequent inflows into Solana-focused Exchange-Traded Funds (ETFs) in North America have signaled growing confidence from traditional finance. These products have seen millions of dollars in inflows on strong trading days.
This trend extends to corporate treasuries. The listing of Solana-focused companies on major stock exchanges, holding significant amounts of SOL tokens, brings considerable Wall Street exposure to the asset. This institutional demand, coupled with whale accumulation, where large holders have been observed adding to their positions, provides a powerful source of buying pressure.
The Alpenglow Upgrade
Adding to the long-term bullish case is the anticipated Alpenglow network upgrade. Approved by an overwhelming majority of validators, this upgrade is set to slash transaction finality times significantly, bringing them down to a fraction of a second. This enhancement would provide Solana with Web2-level settlement speeds, dramatically increasing its competitiveness in high-frequency applications like decentralized finance (DeFi) and gaming, and potentially driving a new wave of developer and user adoption.
Navigating the Hurdles: Resistance and Risks on the Horizon
Despite the overwhelmingly bullish confluence of factors, investors should remain aware of the potential risks and key resistance levels that lie ahead. The symmetrical triangle, until a breakout is confirmed, remains a pattern of indecision. A break below the lower support trendline could invalidate the bullish thesis and trigger a move to the downside, with potential targets at lower support levels.
Even with an upward breakout, the path to $230 is not without obstacles. Solana faces immediate resistance in the zone just above its current trading range, an area that has been tested multiple times. A more significant band of resistance is anticipated in the range between $210 and $250, where sellers may look to take profits.
Furthermore, some on-chain metrics suggest that while momentum is building, some long-term holders may be taking the opportunity to distribute their holdings, which could create selling pressure. The broader cryptocurrency market remains subject to volatility, and a downturn in major assets like Bitcoin or Ethereum could negatively impact altcoins like Solana, regardless of their individual technical and fundamental strength.
Conclusion
Solana currently presents one of the most compelling risk-reward setups in the cryptocurrency market. The formation of a rare symmetrical triangle on its price chart, following a powerful rebound, has laid the technical groundwork for a potential rally toward $230. This bullish structure is not merely a product of chart patterns; it is underpinned by a potent combination of fundamental drivers. A re-energized NFT ecosystem, overwhelmingly positive sentiment in the derivatives market, growing institutional adoption, and a landmark network upgrade on the horizon all contribute to a powerful narrative of growth and expansion.
While traders and investors must remain vigilant of key resistance levels and the inherent risks of the crypto market, the evidence suggests that Solana is coiling for a potentially explosive move. A confirmed breakout in the coming days could validate the bullish setup and send SOL on the next major leg of its upward journey, solidifying its position as a leading blockchain platform for the future of decentralized applications.

SOL / USDT : Trading near trendline resistance with potentialSOL/USDT (2H timeframe) is trading near trendline resistance with strong potential.
If price breaks above this resistance, we could see a rally toward $220.
If it fails to break, this setup will be invalid.
Keep it on your radar and always wait for confirmation before entering.

SOL analysis.Give me some energy !!!The price on the daily timeframe is within an ascending triangle, which can be promising. If the price breaks this pattern with bullish candles, it could easily rise by the distance of AB=CD .
Best regards CobraVanguard.💚
SOL/USDT 4h chart 1. Trend:
• The price was bounced off from the yellow growth line, but it just pierced it down. This is the first signal of buyers' weakness.
2. Support (red lines):
• $ 200 - psychological level, just tested.
• 193.6 $ - stronger support if the current one cannot withstand.
• 187.4 $ - even lower, bull defense limit.
3. Resistance (green lines):
• $ 206.9 - the first greater resistance to come back up.
• 214.7 $ - stronger, where there were reflections before.
• $ 220.5 - main resistance, heavy to punctures.
4. Stoch RSI (downstairs):
• It is low → the market looks sold out, which means that there may be a chance to reflect, but there is no reversal signal yet.
⸻
👉:
Sol has lost his growth line and is now fighting to stay $ 200. If it falls lower, subsequent stops are $ 193 and $ 187. Only breaking over $ 207–214 will show the strength of buyers.

From $207 to $218: Solana Bullish Setup AheadOn the 1H chart of SOLUSD, the broader price structure is showing strength, favoring your bullish bias. Solana has been making higher swing lows, which is a strong sign of accumulation and sustained buying pressure. Each dip into support zones has been met with aggressive rebounds, suggesting buyers are still in control.
Currently, SOL is trading around $207–$208, after bouncing from the $202 area. This bounce was significant because it shows how well the $202 level is being defended. The price is now pushing toward the $213–$218 resistance band, which has acted as a supply zone multiple times before. A successful break above this band would likely confirm a continuation of the bullish momentum, potentially opening up higher targets in the coming sessions.
The immediate supports are clear. The most important one is $202.84, and below that, $195.91 and $190.14 form the next layers of demand. As long as SOLUSD holds above $202, the bullish structure remains intact. On the upside, the key resistance levels are $213.47 and $218.01. These areas are crucial profit-taking zones, and $218 is the major level to watch, as it has capped multiple rallies before.
🟢 Bullish Trade Setup (SOLUSD 1H)
• Entry Zone: $207–$208 (current trading area)
• Stop Loss: Below $202.84
• Target 1: $213.47
• Target 2: $218.01
For managing the trade, the best approach is partial profit booking. Closing around 30–40% of the position at $213.47 locks in early gains and reduces exposure. Once that level is reached, the stop-loss can be adjusted to breakeven at $207, removing risk from the trade. If the move continues toward $218, a trailing stop strategy should be applied, placing stops just below the most recent higher low on the 1H chart. If a breakout occurs above $218, the path toward $225 and beyond could open up, but for now, $218 remains the major bullish target.
In summary, SOLUSD is trading in a bullish structure with strong support at $202 and profit targets at $213 and $218. The setup provides a favorable risk-to-reward scenario, with partial profit booking and trailing stops ensuring profits are protected while leaving room for upside continuation.

SOLUSDT | 1 DAY | SWING TRADING Hey friends!
I’ve put together a detailed analysis on Solana just for you. The harmonic pattern has completed, and we’ve already seen some strong buying from that exact zone. 📈
Now, I’ve got two targets for you:
🎯 Target 1: 170.00
🎯 Target 2: 219.00
🔴 STOP: 75,81
"Just a heads-up — since this is a swing trade, the target might take some time to hit. Good to keep that in mind."
Remember, the more love and likes I get from you, the more motivated I am to keep sharing these analyses. All I ask is for a simple like to show your support. 💙
Huge thanks to everyone supporting with their likes — I truly appreciate it!

"SOL: Drop from $201 ""
On August 30, Solana turned downward on the 4-hour chart around the $201 area. The move was precise and steady: price reached $197, giving a potential difference of about $5 per coin. The trade was closed according to plan, and the result was secured.
The real value here isn’t just in the profit, but in the process. The algorithm guided the trade step by step: marking profit-taking zones, helping to manage risk, and maintaining discipline. This removes chaotic decisions and turns trading into a structured process.
For experienced traders, such a tool works as an accelerator: it reduces routine analysis, speeds up decision-making, and eliminates emotional mistakes. Instead of constant doubts about where to take profit or whether to keep holding, the focus shifts to following rules and working within a clear system.
The market will always move unpredictably. But when there’s an algorithm highlighting structure and managing trades in stages, trading stops being chaos and becomes disciplined work."

SOL Reclaims $207 – Can Bulls Push Through $212 Toward $224?Solana (SOL) is trading around $207 on the 4-hour chart, just under the key $212 pivot zone. In this video, we focus on today’s Solana/USDT analysis and walk through the levels that matter most: $207 and $212 as the pivots, $222–$224 as the next resistance, and $234 as the higher target if bulls stay in control. On the downside, support sits at $205, $201, $195, and the deeper defense at $178.
With Bitcoin showing bullishness and the U.S. Non-Farm Payrolls report released today, volatility is high across markets. In this Solana update, I explain how NFP, Bitcoin’s strength, and these intraday levels fit together to shape the next moves.

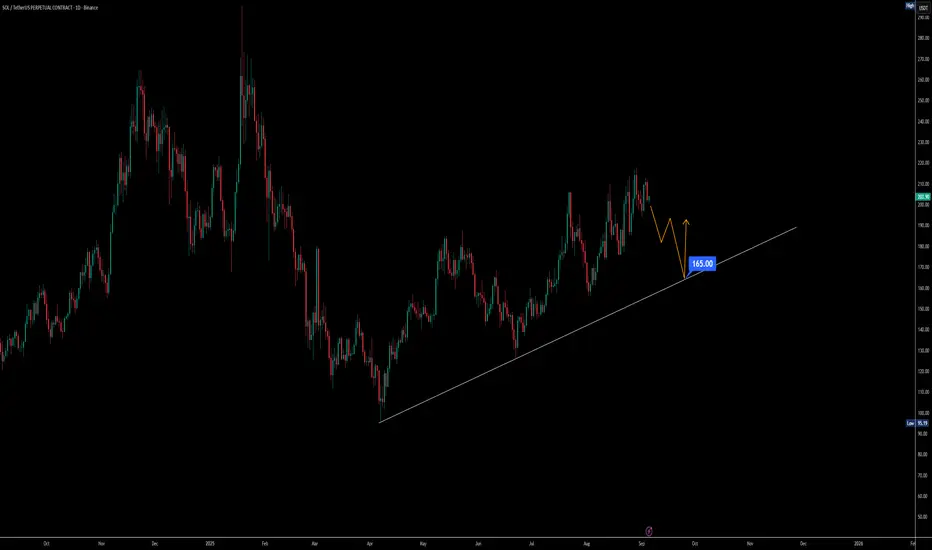
Solana momentum slowing correction to 165 or 100 possibleIf we look at Solana on the daily timeframe, the structure has been holding higher lows consistently, which shows strength. But the reality is that liquidity from the retail side is drying up while Bitcoin dominance keeps climbing. On top of that, today’s U.S. unemployment data will be a key driver. A stronger report could put pressure on the market and trigger a correction, while weaker numbers may shift sentiment but won’t erase the need for a healthy pullback.
Right now, both MACD and RSI, along with Stochastic RSI, are hinting at momentum exhaustion. Volume is steadily declining, which usually signals an upcoming correction phase. The critical zone to watch is around $165. If Solana holds this trendline support, the structure remains intact. But if this level breaks, the move could accelerate toward the $100 region — a deeper, more volatile correction.
Overall, I’m expecting September to deliver that correction. It’s not a bearish outlook but rather a needed reset. Without such a shakeout, the market won’t have the fuel to retest previous all-time highs or push into new ones. A correction here is not weakness — it’s preparation for the next strong rally.
SOLUSDT- 250905 - LONG - Binance - Algo Target - 1WSOLUSDT- 250905 - LONG - Binance - Algo Target - 1W

SOL (Solana) Price Trend Projections
🔹 1-Day Projection
Analysis:
Positive MACD, RSI near overbought but in a neutral range.
Price near Bollinger middle band, potential for upward movement toward the upper band (227.9).
Low volume, limiting volatility.
Fibonacci Resistance: 214.4, Support: 189.5.
Price Range: $200 – $214
Sentiment: Slightly Bullish
---
🔹 1-Week Projection
Analysis:
MACD turning positive.
RSI ranging from 47 to 61, neutral to bullish bias.
Potential breakout if price approaches upper Bollinger band (227.9).
Economic data (e.g., NFP, CPI) could drive risk appetite.
Price Range: $210 – $225
Sentiment: Bullish
---
🔹 1-Month Projection
Analysis:
SMA(200) at $157.3, confirming strong long-term support.
RSI and MACD suggest continued bullish momentum, but overbought conditions could emerge.
Fibonacci Resistance at 234.6.
Price Range: $215 – $235
Sentiment: Bullish
---
📝 Summary
1-Day: $200 – $214
1-Week: $210 – $225
1-Month: $215 – $235
#solusdt
#solana
