Pre-elections trading. ExplainedSP500 broke to the new highs. Volume is still very low and the Advance Decline Line doesn’t support this rise too. It is bearish. However, there is still a lot of momentum in this market. Likely we will see choppy trading with upside bias till the middle of September followed by a decline till the end of the month. Pay attention we are getting close to elections. With that in mind, I believe that pullback (if any) will be bought very fast. Besides, the Fed Funds forecast signals a rally coming at the end of September. The best thing we can do now is intraday trading. There is a chance for a swing trade, but only in a month from now.
Sp500future

/ES Elliott Wave CountsTwo potential Elliot Wave counts for the short and mid term. One count in blue, one in red.
SPX put in a weekly gap around 3272 and 3285, which could act as support for a wave B in the immediate wave 2 pullback. Mid-long term is bullish.

SP500 (Y20.P3.E2).Still bullish but a correction soonHi All,
Looking at the chart from a channel perspective, one can see that the price action is over extended with a daily and what looks like the weekly, both with bearish divergences.
One will then expect sooner or later for it to return to the average, in this case, towards the mean of the channel.
I believe a double top is taking place and if we see the indicators cross over, then that is the signal for a down ward correction.
Just like Gold or BTC , I don't see a big correction. I believe we will still have upward pressure based on the indicators.
OBSERVATION:
=================================================
> The price is completing a double top with a bearish divergence on the daily
> The price is over extended to the 3rd deviation of the channel
> Looking at the weekly indicators, we can see the orange energy below 60%, showing downward pressure is close near by
> We have the green rsi almost touching the red, another downward pressure indicator near in the making
> Since both RSI's are above 50 or 60%, we know at this time, that the pullback will not so deep, at this point
> The Stoch . is close to crossing over, the signals for a downward motion.
THOUGHTS:
=================================================
> Price will likely move towards the 21, 34, (black ribbon) or the 50 EMA , which are all within the channel, 1st deviation.
> Along with the fib. retracement, its my opinion we will make a small dip below the support line touching one of the moving averages.
Please give me a like or tick for this post.
Regards,
S.Sari
8 HRLY chart
Close up view on the weekly


Sell-off before new wave up?Some time ago we discussed a possible retest of 3400 in SP500. That is exactly what is happening right now. 3400 is the magnet now. The Advance Decline Line is weak. So, likely we will see a profit booking near the double top. Besides, we see signs of distribution in volumes. Big players are getting out of the market slowly during the last few weeks. I am looking to take short signals in this market. Based on the Fed Funds Forecast I expect this sell-off will give a great buying opportunity. However, let’s take it step by step.

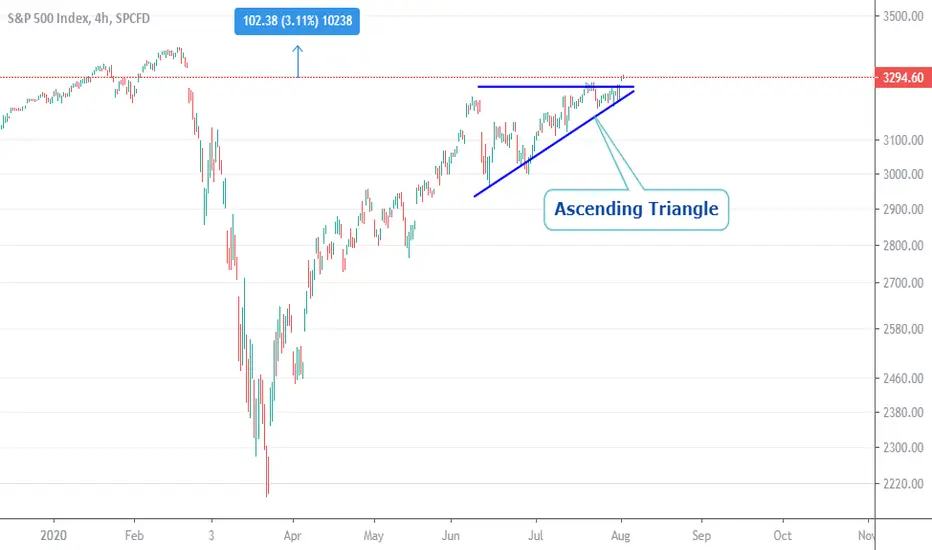
Ascending Triangle on SP500?Hello, Traders!
SP500 is breaking out of a bullish accumulation pattern called the ascending triangle. It is important to wait for the price to make a pullback on this triangle.
But be careful, the market is very susceptible to bad news related to the virus, and the scenario can change at any moment.
It is worth noting that we are only 3.5% of ATH
Best regards.
FED Funds indicate big move is coming this autumnChoppy trading in SP500 continues. All declines were bought back quickly last week. It seems to be positive. However… Advance Decline Line doesn’t support this. It is negative in a short-term perspective. Based on cycle studies we can expect to get buy signal around 10 – 15 August. Till that time we will likely see more choppiness with a bias to the downside. I don’t think we are entering another wave of huge sell-off. We had a nice rally in this market and decline is just a normal pullback. GDP showed a big decline last week, but it turned to be positive for stocks as Powell said FED will do all to support the market. We have an interesting forecast based on FED Funds – a huge rally is coming at the end of September. Recent 2 years FED Funds has been one of the best indicators for swing traders. Let us see how it turns this time. For now, I keep focusing on very short-term trades.

ES in Another Bear Flag 7/28/2020ES at the 4 hour.
The ES is still in a giant bear flag pattern since July 23rd. With the Fed press conference tomorrow, I wouldn't be surprised if this gets pumped up for that press conference then starts dumping on Thursday.
The VIX right now is projected to break its wedge between 7/30 to 8/5. Obviously, I cannot get an exact date, but it's in that date range. The pullback last week was not enough to attract more buyers. The VIX is warning that a pullback is pretty soon. If this pulls it down to 3100s, then that should attract enough buyers to get a decent bounce from.
The ES is stuck right now because tech shares are being sold. However, non-tech sectors are finally getting bought.

Coming week can bring turbulence. ExplainedComing week can bring turbulence to markets. Special attention has to be paid to the SP500. The technical analysis is still neutral. We got rejection last week, but it happened with a low volume. It can’t be considered a valid swing failure. If 3170 – 3140 holds, we can see a retest of 3400 and possible double top formation. However, fewer stocks support this rally. We have seen the same scenario before each sharp decline. So, keep that in mind if you long the stock market.
The Federal Reserve meeting is scheduled for the coming week. But likely we will not hear something new. Implementing negative rates looks doubtful. So, the dovish tone is all I expect from the Fed.
Extra jobless benefits disappear at the end of the month. Currently, 20 million Americans get an extra $600 a week. If there will be no fast extension of this payment, the income of the average unemployed person can fall to $200 a week. That will make people spend less. Less spending means less income for the retail business. Some of them will have to close. We have already discussed a big number of bankruptcies and their impact on the economy and the stock market. The situation looks dramatic.
The second-quarter U.S. GDP is another important data all traders are waiting for. Atlanta Fed forecasts almost 53% decline. Those numbers can shock the market and cause high volatility. Such expectation is a result of rapid COVID spread in the USA. The situation in the EU is more positive with a 12% GDP decline expected.

ES Historical Resistance Won the Battle 7/23/2020ES at the 4 hour view.
The red line is the historical resistance. It stopped the ES back on June 05-09. It stopped the ES again this week. Had it not held, the next resistance would've been 3330 which was the February gap.
I was getting a little worried there since the resistance was starting to breakdown. However, it held in the end. I am not confident that this resistance will hold for a third time.
VIX and VVIX was giving a warning for the past few days about a pullback. Well, the pullback came.
Keep in mind. With high liquidity levels, supports below may be stronger than traders think. I am not expecting another March 2020 crash at all. Market internals are stronger now than in late February.
Besides, here is a critical thinking question. How many shorts/bears do you think are trapped below? How many of them are waiting to get out of their underwater shorts? That's why I think there may be a bounce from below.

ES Historical Resistance Breaking Down 7/22/2020This is the ES at the 4 hour view. The historical resistance is starting to break down. I'm not too surprised actually.
There is a gap above at around 3330 from February that is calling to be filled. Furthermore, liquidity data suggests that liquidity is pretty strong now. So strong that it's drowning volatility runs as well as permabears' pride/egos.
This is why I keep hammering this point. Don't short a bubble. You will be wrong way more times than being right. It's simple mathematics. How many times were you wrong about calling a top? How many times were you right about calling a top?
This is why I wait for the price to come to me. I wait for the price to reach supports and ride my longs from the bounce. This is especially true when liquidity is high and the VIX is struggling to get above all of its daily moving averages.
What's more important? Being "right" months later or profit during those months? It's a question of ego vs being pragmatic.

ES Stopped by Historical Resistance 7/21/2020ES at the 4 hour. The ES was stopped by the historical resistance (red line) for a second time. The first time was in early June.
The VIX and VVIX were giving a warning for 2 days that some sort of pullback was coming. It's why I didn't go long here. I'd rather wait for the VIX to clear up and present me better long opportunities.
That said, liquidity is rising dramatically. That's apparent by now with the dollar weakening. I am not expecting very big pullbacks to be honest. That will upset a lot of bears, but that's how the market is right now.
Triple tops are actually pretty rare. Market likes to break supports or resistances by the third time. If we get a pullback and the market internals are still bullish, I don't think this resistance will hold a third time. After this resistance, the gap above from February (3330) will be calling.

ES Testing a Historical Resistance 7/20/2020I mentioned yesterday that the ES was hammering to the upside to escape its wedge.
It happened.
The next resistance would be that red line above at 3260. It was support back in 2017 and it acted as a resistance zone back in early June.
If this resistance doesn't stop momentum, then the next resistance would be 3330 which was the original bear market gap from February.
I don't think it will fill that gap there in this run... maybe the next run. VIX, VVIX, and P/C Ratio are starting to set up like early June.
I'm only missing two more warnings for a pullback: bonds rallying and FOREX traders selling off.

ES Hammering to the Upside 7/18/2020This is the ES at the 4 hour view.
Judging by the price action, the ES seems to be hammering that resistance away (red dashed line). The VIX is breaking minor supports below. However, the VVIX is implying higher volatility.
This is usually a set for a pop higher then a pullback.
There is a gap between 3250-3327 which has not been filled from February. I think that's the ES' destination this whole time.
What will it do when it fills that gap? That's the big question there.

Is the relationship between the yield curve and SP500 dead?Looking at the TVC:US10Y - TVC:US03MY and the AMEX:SPY it seems that during a recession like this TVC:US10Y - TVC:US03MY should rise and AMEX:SPY should fall.
Will it be the case this time as well or is this time different?
Maybe the FED cannot allow TVC:US10Y to rise this time due to the amount of debt and will instead impose yield curve control like in Japan by printing money to buy TVC:US10 ?

ES Consolidating 7/15/2020ES at the 4 hour view. Resistance above held for now. ES is stuck since tech is bleeding, but financials and transportation sectors are rallying. That's actually a bullish move.
ES may pullback since P/C Ratio is at below 0.65. VIX is also about to reach a support zone soon as well.
That said, with liquidity rising and key sectors rising, ES may be setting up for another bullish run after a pullback. It may break resistance.
Permabears may be crying, but they seriously need to look at the current data. It's not exactly bearish. Most likely, we may have a pullback. Bears will get FOMO and short. Bears will then fuel the next bull run by covering their shorts.

ES Stuck in a Box 7/14/2020This is the ES at the 4 hour view. Banks earnings were today - especially JP Morgan and Wells Fargo.
Why did the ES rally? FOMO bears.
Everyone was expecting bank earnings to be bad. So, if everyone is already bearish , they already have short positions in anticipation of bank earnings .
ES' projected supports were near the VPOC around 3115 or the flag support around 3045. It turns out to be the VPOC support. Bears who FOMOed got their shorts eaten from that bounce.
Shorts were covering like crazy in both financials and tech. Eager bears are constantly hoping for the big tech crash and shorted either too early or too late. They got punished for being too greedy.
ES is stuck in a trading range. Why? The ES will not fall until the NQ or FATMANG ( Facebook , Amazon, Tesla , Microsoft , Apple , Netflix , Google ) stocks fall too. Currently, Tesla , Amazon, and Netflix love their short coverings. At the same time ES would not sustain a rally unless the financial and transportation sectors rally too.
In every economy, businesses need bank accounts and ways to ship/receive products. That's why those two sectors are so important.
The ES and RTY's fates rely heavily on the XLF /FAS and XTN / IYT doing well. Currently, people view big tech as their "safe haven."

SP500 still has room to the upside before declineNot much has changed in the stock market. We are still in the same range. Based on the rejection we got last week, we can expect SP500 to test 32xx range (possibly even higher to form a double top near 3400). Advanced Decline Line broke higher than it was at the beginning of this year. That is bullish for the short-term. Based on cycles, we can expect trend reversal to the downside after July 20. Intraday trading is still the best idea for SP500 traders.

Good start in SP500, but still there is no signal - here is whyWe got a nice rejection near the first level of resistance (I mentioned it in previous SP500 analysis). Sellers entered with good volume, but the trendline is still holding!! Likely there will be attempt to break it. There is a possibility to retest 2 important zones before this attempt - previous swing failure and yesterday's top (to form double top). Don't hurry with shorts, let this market do its thing, and form strong signal. One day with sell-off is not enough

ES in a Bear FlagES pulled back today. Why? RSI was overbought at the 4 hour view. Put/Call Ratio was at 0.67 before the pullback. Below 0.75 is considered overbought or a bit extreme.
You know what's the crazier part? TVIX was delisted on July 12th. I guess Credit Suisse knew...
ES is in a bear flag right now. ES and RTY's fate rests in the XLF and XTN/IYT. If financials and transportation do not rally, then there will be no bull market.
Banks earnings are tomorrow. The ES is in a bear flag at the hourly now. That pink line is a historical resistance. My guess is that the ES will find support at 3115 (near VPOC) and then around 3040 at flag support. They'll probably blame bank earnings for the second leg down.
One of my mentors once said this. News breaks into the market cycle and not the other way around. Most news stories are just the cover ups or excuses by lazy, economically illiterate journalists. If you read the market cycles and the price action, then you can read the markets. Most news stories are just a costly distractions and a waste of precious time.

The range for potential distributionAs we expected SP500 rallied before July 4th. We still don’t have any swing signals. Based on cycles and seasonal indicators we can see a choppy trading coming week or two and formation of distribution with possible upthrust near 3200. If that happens, we can expect selloff. Price action confirmation and divergence with the advanced decline line needed. For now, that is general outlook based on cycles and seasonals

sell at 10854 and tp under 10000sell at 10854 and tp under 10000
do with 2 lot
first lot cut in half of target like 10480
lot 2 made a stop loss at 10600 as exemple when he reach less than 10500
if you see the volatily very high coupled with a bed news.u can go down than 9950..just do a traling stop manulally

S&P500 daily- Consolidating into a Symmetrical Triangle.S&P500 daily- Consolidating into a Symmetrical Triangle, after breaking down from Uptrend.
Interesting, AUD/USD daily chart looking like a carbon copy too.
