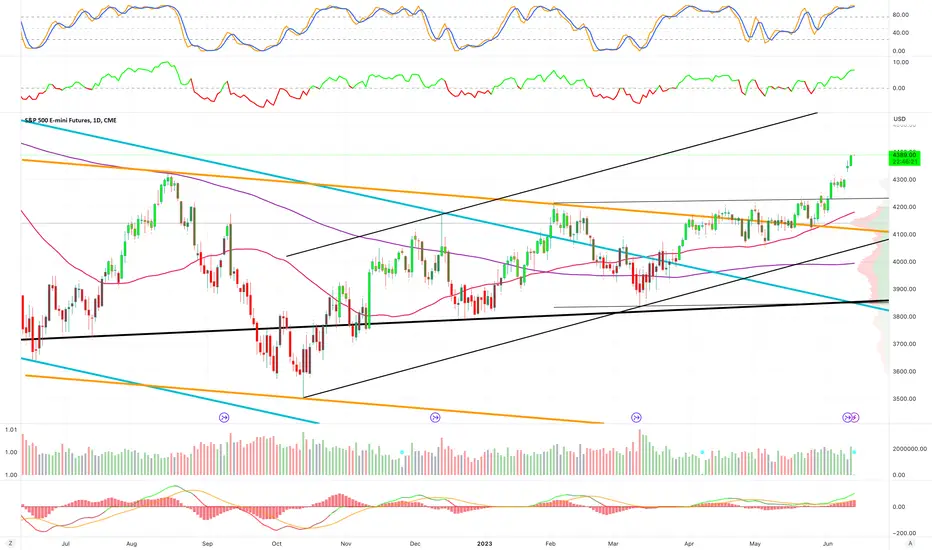
S&P 500, 6/15/23For Thursday, 4399.00 can contain intraday weakness, the targeted 4441.25 - 4446.50 area in reach and able to contain buying through the balance of June.
Holding below 4441.25 allows 4203.75 long-term support by the end of July or sooner, while closing today above 4446.50 signals our 4600.00 longer-term objective over the next 2 - 3 weeks.
Downside Thursday, 4367.50 can contain session weakness, while closing below 4367.50 indicates a good weekly high, 4263.75 then expected within several days, also able to contain session weakness and the point to settle below for indicating 4186.75 - 4203.75 long-term support within several more days.
Sp500future

S&P 500, 6/14/23For Wednesday, 4402.50 can contain intraday weakness, the targeted 4436.00 - 4446.50 area in reach and able to contain buying through the balance of June, once tested the market susceptible to falling back to 4203.75 within 3 - 5 weeks.
On the other hand, closing today above 4446.50 signals the 4596.50 longer-term objective over the next 2 - 3 weeks.
Downside Wednesday, 4353.00 can contain session weakness, indicates a good weekly high, 4263.75 then expected within several days, also able to contain session weakness and the point to settle below for indicating 4188.50 - 4203.75 long-term support within several more days.

SP500 Next Price Target So ClearRange is very clean.
It is very clear where the price will go.
I hope you can see this.
All ranges of this range worked sharply.
While individual investors buy the break out, you can sell it.
Have a nice one and good trading!

S&P 500, 6/13/23For Tuesday, 4348.75 can contain intraday weakness, 4385.00 in reach and able to contain intraday strength.
Pushing/opening above 4385.00 allows 4409.00 intraday, able to contain session strength and the level to settle above for yielding the targeted 4430.50 formation tomorrow, where the market can top out into July activity.
Downside Tuesday, breaking/opening below 4348.75 signals 4328.75, able to contain session weakness.
Closing today below 4328.75 indicates 4263.75 within several days, also able to contain session weakness and the point to settle below for indicating 4190.25 - 4203.75 long-term support within several more days.
S&P Futures: Mind the "Bull Market" GapIs this the proper way to start a new bull market? Asking for a friend...
-Home prices relative to income are higher than during the peak of the 2008 financial crisis.
twitter.com
-62% of new homebuyers are having trouble paying their mortgages.
listwithclever.com
-Some cities already seeing a rollover in housing prices with a rise in inventory.
twitter.com
twitter.com
-Investors are leaving the housing market.
twitter.com
-Commercial real estate is busting.
twitter.com
-Hotel developers are broke.
www.reuters.com
-Total credit card debt has crossed $1 trillion for the first time ever.
twitter.com
-Credit card delinquency rates are rising.
twitter.com
-7 stocks are responsible for all of the gains in the SP500 this year.
twitter.com
- Student debt payments are about to resume putting more pressure on cash-strapped consumers.
twitter.com
Good luck out there in this new "bull market". I suspect that the gap will be filled sooner rather than later, especially with that lower TDI indicator showing the RSI above its upper Bollinger Band.

Will the S&P 500 tank (or will bears be forced to capitulate?)Whilst this year's 'rally' on the S&P 500 has been mediocre at best, the increase in net-short exposure to S&P futures has been impressive. As of last Tuesday, large speculators pushed their net-short exposure to the futures contract to their most bearish level since late 2007.
Yet with prices rising whilst speculators increase bearish exposure, there is a clear mismatch between the two data sets. And one that will need correcting, one way or another.
Prices will either need to roll over to justify the short-exposure of large speculators, or bears will have to capitulate which could also trigger a short-covering rally to send prices higher.
A potential catalyst could be if (or when) the US increase their debt ceiling, with reports suggesting we are on the cusp of a 2-year raise - and that could support risk assets such as the S&P 500. But if the talks break down, the deadline is missed and the US government defaults (which would also see the US lose their 'AAA' rating), it could be a case of 'watch out below' as the market slumps to justify the aggressive positions of bears.
Either way, this is one to watch as the week's progress.

Big Short On SPX500 According to the US30 analysis, the price of spx500 can also have a down trend in the long term

SP500 - SHORT SETUPOn daily timeframe, we have a last pump wich show us the level of distribution area, nothing bullish undeer 4200.
If the daily candle will close under 4.160, i will enter short

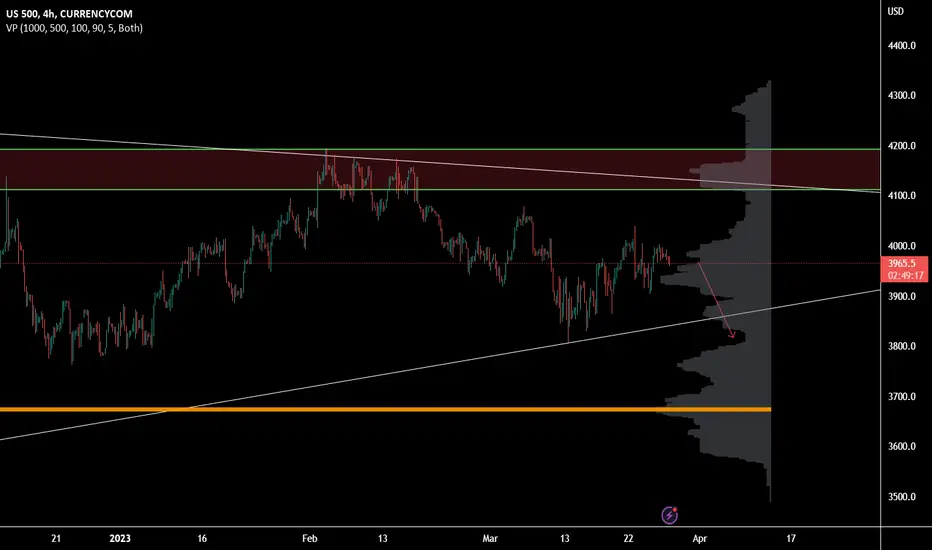
ES Overnight Breakdown Continuation?Will ES continue to break down the main channel support? If we do not hold 4150, I believe we will see a much needed cool off and a main channel retest around ~4120.
I played a short overnight for 20 points for a measured move of yesterdays leg. I believe we will see a small bounce to retest the uptrend, then see continuation down to the main channel as we have lost a bit of steam.

S&P 500 Futures Set-UpPut Option' Premiums are cheap compared to the chance of having a pullback.
RSI in overbought ranges.
Volume has been decreasing for the last weeks.
Entry Level: 4130
Stop Loss set at 4220 .
First Take Profit at 4050 . Second Take Profit at 3980 .
*Important to pay attention to the price action at the level of 4050. If it is recovered quickly, it will be bullish.
Consider moving the stop loss closer to the breakeven point if that happens.
Priority Number One: Survive in the market.

S&P 500 Index Analyze !!!S&P 500 has been moving on Ascending Channel for about 12 years😱. S&P 500 had an Impulse wave with an Extended 3rd Wave . When wave 3 is extended , we can use from Elliott Wave Fibonacci Retracement and Extension Guidelines of extended waves :
🔅 If wave 3 is extended , waves 1 and 5 are often nearly equal in magnitude and duration.= This guideline is running correctly on my chart✅ = The end of the main wave 5 (Zone): 4505 until 4182
🔅If wave 3 is extended , then wave 4 often ends at the level of sub-wave 4 of 3 and is quite shallow (retraces 23.6% – 38.2% of wave 3). This guideline is running correctly on my chart✅
🔴 Heavy Resistance Zone : 5817 until 5348 .
S&P 500 Index Analyze Timeframe 2 Weeks ( Log Scale )
❗️ Note ❗️: I expect that S&P 500 would go down at least until the middle line of ascending Channel .
Do not forget to put Stop loss for your positions (For every position you want to open).
Please follow your strategy , this is just my idea, and I will be glad to see your ideas in this post.
Please do not forget the ✅' like '✅ button 🙏😊 & Share it with your friends; thanks, and Trade safe.

My today's view on SP500 - FutureHi Traders,
This is my view for today on ES
Micro and Macro structure are both aligned. There’re few zone I’ll wait for the price to test:
- 4025 for a short
- 4080/90 for a short, as well
- 3960 for a long (but I need a strong confirmation)
Pit, Trading Kitchen
DISCLAIMER:
Trading activity is very dangerous. All the contents, suggestions, strategies, videos, images, trade setups and forecast, everything you see on this website and are the result of my personal evaluations and was created for educational purposes only and not as an incentive to invest. Do not consider them as financial advice.


US500 Trading in a triangleHello Traders,
on higher timeframes CURRENCYCOM:US500 is trading on a triangle. For the moment we don't know where will be a breakout so we're trading inside of it.
Next target probably the 3850 level.
BOOK of SAMUEL: DAVID V GOLIATHWow! This is a first for me, in such a large timeframe. Looking at both patterns forming. The larger head & shoulders pattern may take precedence, as it is generally considered to be a more significant pattern. If the H&S pattern is confirmed, it would suggest that the uptrend is ending and that a downtrend may be beginning. However, if the Inverted H&S pattern is also confirmed, it could indicate that the trend is changing and that an uptrend is beginning.

My today's view on SPX500 FutureHi Traders,
This is my view for today on ES
Ok, the micro-structure. Is aligned to the macro one from are 4050. There is one more GAP to fill around 4080 area.
Today’s target is 4090 and could be reached directly during London Session or (better to me) by a liquidity grab from 4057 or Asian Session High Level.
Pit, Trading Kitchen
DISCLAIMER:
Trading activity is very dangerous. All the contents, suggestions, strategies, videos, images, trade setups and forecast, everything you see on this website and are the result of my personal evaluations and was created for educational purposes only and not as an incentive to invest. Do not consider them as financial advice.
———————————

TRADE UPDATE: TARGET REACHED - SP500Our short term trade paid off nicely even though it took 5 days.
The price headed to our target price of 4,008.
We now need to bank our profits and move on to the next trade.
Now we have a gap that is still to fill and we have orders to still fill on the daily (Fair Value Gap).
But I'll let you know!

My today's view on SP500 FutureHi Traders,
This is my view for today on ES
In terms of Structures and Technical Analysis, everything is BEARISH, next target is 3838, honestly I don’t think will be touched directly during today’s session. A possible manipulation around 4000 level key zone during US opening could bring market to the target.
Pit, Trading Kitchen
DISCLAIMER:
Trading activity is very dangerous. All the contents, suggestions, strategies, videos, images, trade setups and forecast, everything you see on this website and are the result of my personal evaluations and was created for educational purposes only and not as an incentive to invest. Do not consider them as financial advice.
———————————

SMC SPX500 Price might go up but I'm looking for shorts onlyWe are looking at the SP500 on 15 minute time frame.
we see two Dotted lines -
Green - Daily High of the previous day
Red - Daily LOW of the previous day
The daily trend is DOWN - so Daily Bias is look for shorts.
The first hour, the market came down and formed a new low before we had a break of structure to the upside. This forms what's known as Sell Side LIquidity - Order Block.
WHy? Because Smart Money goes down and sweeps liquidity where they buy into the market for the day.
Next we can expect the prices to move up then retrace BACK into the LIquidity zone. Once this happens EITHER the market will move up for the rest of the day where intraday traders will go long.
Or it will break below and form lower lows forming Buy side Liquidity (stopping buyers out).
We ONLY will short the market because Daily Bias is bearish... So even if the market goes up, there will be no trade.
If Buy Side Liquidity Order Block Forms we will have a trade to go short.
I'll be waiting - what are your thoughts?

My Today's view on SPX500 FutureHi Traders,
This is my view for today on ES
Macro and Micro strutture are both BEARISH and aligned. 3902 recent structure has been broken, which is why we must continue to believe that the recent low at 3880 is the next target.
There is too much liquidity above Friday's high, which I think can be touched before we go towards target.
Personally the most likely scenario is a manipulation at 4020.
Pit, Trading Kitchen
DISCLAIMER:
Trading activity is very dangerous. All the contents, suggestions, strategies, videos, images, trade setups and forecast, everything you see on this website and are the result of my personal evaluations and was created for educational purposes only and not as an incentive to invest. Do not consider them as financial advice.
———————————

SP500 BREAKDOWN ANALYSISdear traders
sp500 in this case trying to correct the big move i see if he break above 3877.9 you should take a long trade target will be at 40.11.00
trade safe

My todays' view on SPX500 futureHi Traders,
This is my view for today on ES
Micro and macro structure are aligned. Next target will be 3900 and can be reached immediately after a manipulation around Asian Session High or with a retest on 4000 level on a strong SUPPLY zone. (I’ll personally wait for this retest to go short).
Pit, Trading Kitchen
DISCLAIMER:
Trading activity is very dangerous. All the contents, suggestions, strategies, videos, images, trade setups and forecast, everything you see on this website and are the result of my personal evaluations and was created for educational purposes only and not as an incentive to invest. Do not consider them as financial advice.
———————————

My today's view on SP500 futureHi Traders,
This is my view for today on ES
Strong bearish impulse started from 4080 level let me think price will retest 4060 level which is 75%… This is the micro structure.
The higher one’s had been broken at 4026. Fair Value Gap ate 3955 which is today’s target. We’re ranging, No short below 3920, no longs above 4100.
Pit, Trading Kitchen
DISCLAIMER:
Trading activity is very dangerous. All the contents, suggestions, strategies, videos, images, trade setups and forecast, everything you see on this website and are the result of my personal evaluations and was created for educational purposes only and not as an incentive to invest. Do not consider them as financial advice.
———————————
