A Leading Indicator for US EconomyCME: E-Mini S&P Retail Select Industry Futures ( CME:SXR1! )
Last Friday, the U.S. Bureau of Economic Analysis (BEA) released the latest Personal Income and Outlays Report. Personal income gained $131.1 billion (0.6%). Disposable personal income (DPI) added $387.4 billion (2.0%) and personal consumption expenditures (PCE) grew $312.5 billion (1.8%) for the month of January.
Data shows that U.S consumer is resilient. Wage gains and inflation pushed spending growth to a two-year high. In the past decade, PCE gained 60% to $18 trillion. More recently, it surged 50% in the three years since the start of the COVID pandemic.
The hotter-than-expected data indicated that US economy was nowhere near a recession. Additional data from the Bureau of Labor Statistics showed robust job growth in January and the lowest unemployment rate in half a century.
Wary of bigger and longer-lasting Fed rate hikes on the way, all major US stock indexes turned negative in the month of February. As of last Friday, Dow Jones Industrial Average was down 3.8% month-to-date, while S&P 500, Nasdaq 100 and Russell 2000 recorded -2.6%, -0.8%, and -2.4%, respectively.
Consumer Spending Outlook
Consumer spending accounts for over two-thirds of U.S. economic activity. While PCE shot up more than expected last month, it is a lagging indicator and only confirms what happened in the past. Could U.S. consumers spend out of the peril of a recession?
Retailer stock prices are forward-looking and reflect collective market consensus of how much free cash flow the retailers could earn, discounted by their cost of capital. There are indications that the shopping spree may be ending soon.
Last week, Walmart said its U.S. consumer spending started the year strong, but that it expects households to back off through the year, producing weak fiscal-year U.S. sales growth of 2% to 2.5%. Home Depot said consumer spending is holding up, but that it expects a flat sales-growth year overall, with declining profits.
This is a troubling signal. Retailers are supposed to benefit the most from growing consumer spending, but their stock prices have been losing steam in February. As of Friday, Home Depot ( NYSE:HD ) has a year-to-date return of -6.1%, while Walmart ( NYSE:WMT ) is mostly flat (-0.8%). Other retailers with declining stock prices include Dollar General ( NYSE:DG ), -13.2%; Walgreens Boots Alliance ( NASDAQ:WBA ), -3.7%, and Casey’s General Stores ( NASDAQ:CASY ), -3.8%.
Walmart reported Q4 and FY2023 (ending January) revenue growth of 7.3% and 6.7%, respectively. Its operating income fell 5.5% and 21.9%, for the same periods. Digging deeper into Walmart’s earnings release, I find that it keeps sales growing by expanding its grocery business, but those sales are less profitable than general merchandise categories, where consumer spending is leveling off or shrinking.
In theory, the growth of the biggest US retailer could be attributed to one of the following:
• General growth of consumer spending (economic expansion);
• Good business strategy and market share growth (economic trend unknown);
• Consumer downgrades spending from department stores (economic downturn);
• Price increases (inflation).
My interpretation:
1. Consumers tend to keep up with the same living standards. When inflation hits, they maintain the same purchasing habit. Higher price drives spending growth.
2. As inflation deepens, consumers get fewer merchandises with the same budget.
3. Consumers downgrade purchases from department stores to discount stores, and switch to generic products from brand-named products.
4. In a downturn, higher-ended stores get hit first, and discount stores get hit last.
While Walmart manages to grow revenue by doubling down on grocery and online businesses, the weakness in general merchandizes uncovers the real trend of consumer spending leveling off. We may disagree on whether a recession will be coming, however, data from Walmart and Home Depot indicates that the U.S. retail sector is in trouble.
S&P Retail Select Industry Index
S&P Retail Select Industry Index may be a better benchmark for the U.S. retail sector, comparing to the lagging government data and company specified performance metrics.
The index comprises of stocks in the S&P Total Market Index that are classified in the GICS retail sub-industry. Total-10 constituents by index weight are:
• Carvana (CVNA)
• Wayfair (W)
• Sally Beauty (SBH)
• Stitch Fix (SFIX)
• Boot Barn (BARN)
• Children’s Place (PLCE)
• Qurate Retail (QRTEA)
• Leslie (LESL)
• EVgo (EV)
• Abercrombie & Fitch (ANF)
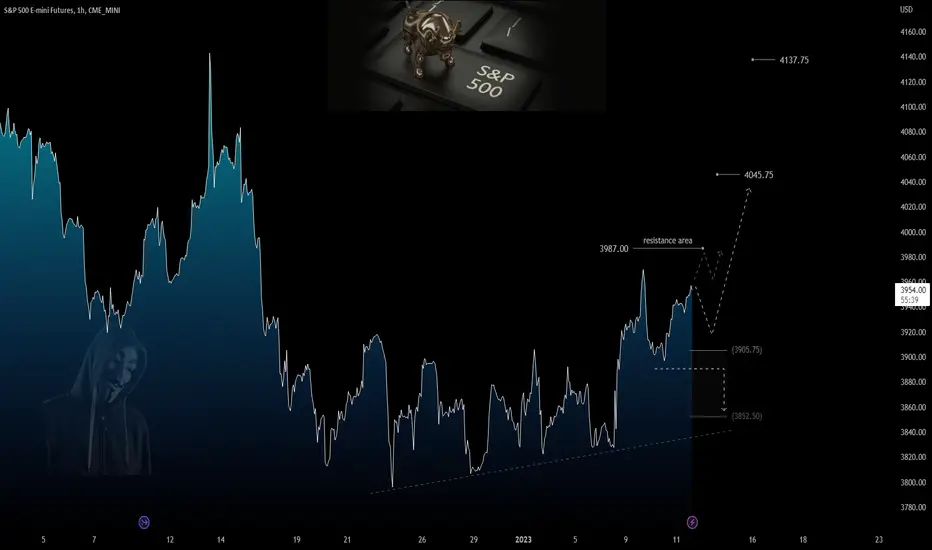
One-year chart above shows that CME E-Mini S&P Retail Select Industry (SXR) Futures tracks the trend of S&P 500 but illustrates higher volatility in the first two months of 2023.
Each SXR contract is notional at $10 times the index. At Friday settlement price of 7004, one March contract (SXRH3) is valued at $70,040. Each futures contract (long and short) requires an initial margin of $5,700. When the underlying index moves 1 point, trader’s futures account would gain or lose $10.
At present, I do not foresee a decisive trend of the S&P 500. It could trend up, go down or move sideways depending on how the Fed rate hikes, inflation, unemployment and geopolitical crises play out.
However, this does not prevent me from expressing a bearish view on the US retail sector. Establishing a SXR short futures position would be appropriate in the negative outlook.
Happy Trading.
Disclaimers
*Trade ideas cited above are for illustration only, as an integral part of a case study to demonstrate the fundamental concepts in risk management under the market scenarios being discussed. They shall not be construed as investment recommendations or advice. Nor are they used to promote any specific products, or services.
CME Real-time Market Data help identify trade set-ups and express my market views. If you have futures in your trading portfolio, check out on CME Group data plans in TradingView that suit your trading needs www.tradingview.com
Sp500future

Painful scenario sp500 spy spx What if this move is just setting up for a run to 4323 range?
If we could end up in that range somewhere between late March on the early side to end of May on the late side.
Then increase the negative narratives with inflation/interest rates/further housing market crash/war etc. to send us into market crash by Q3 we could then see this thing ran all the way back down to 3323 within 12-18 months.
IF you get something like that. AND you're BUYING at that point and not beaten up /exhausted/liquidated etc. i TRULY think you'll be buying a generational bottom.
ALWAYS have more powder. You never know what these markets might do.

SPX500USD YASSINEIØS M15 GOOD LUCK 🩸Please respect the analysis. Today is a beautiful day, a golden opportunity. Just a little patience and diligence, we will be the best Happy holiday Any questions about the transaction are welcome YASSINEIØS&

SP500A wonderful investment opportunity to buy the SP500 with the breach of the side channel shown in the analysis, as well as the breach of the bearish trend and a positive candle indicating that buyers entered the market in a positive way. Please be patient with the deal. Good profits. My friends, traders.

S&P 500: Two Pattern to Trade in short termHi everyone!
The trend is bullish on S&P 500 (Futures), and if we try to follow US Index on intraday chart, we have two important levels: 4,189.75 and 4,098.50. Potential resistance breakout should develop a harmonic structure with Target around 4,238.50, conversely, 4,098.50 failure should trigger bearish consolidation around 4,048.00 area. Technically, both setups are high risk, so using a small size should be a good choice.
...trade with care! 👍
If you think that my analysis is useful, please...
"Like, Share and Comment" ...thank you! 💖
Cheers!

S&P 500: Intraday SessionHi everyone!
The short-term technical structure remains bullish, but to confirm it, it is forced to follow one of the movements shown on the chart (1h), having said that, let's try to follow today's session together...
If this idea will be supported by your "Likes" we will continue to follow the crypto with updates below.
thanks for your attention and please... trade with care! 💖
SPX also showing strong upside to come with a C&H target 4,600Cup and Handle has formed over the last few months.
We have had a break up out of the brim level and now looks like the price wants to bounce and run up further.
This is following onto the long position and update we did with the SPX a few months ago.
As traders we need to adjust course and apply new patterns as they come.
7>21>200
RSI>50
Target 4,600
With the Jobs added better than expected last Friday and with the signs of an economic recovery, The US is showing strong signs of a rally.
This could be before the catalyst for the expected fall.
Regardless, I am bullish for now and the charts don't lie!

US500 Long Play 06-02-23 (H4)This week I'm targeting the daily FVG. We broke the previous BSL last week now heading toward the FVG.

SP500 - OutperformersSP500 analysis :
Outperformers :
1. Telecom
2. Consumer Durables
3. Real Estate
4. Technology
5. Finance
6. Materials
7. Energy
Underperformers :
1. Industrials
2. Utilities
3. Healthcare
4. Staples

SPDR Select Sector Fund looking great for upside to $120Perfect Cup and Handle has formed with XLE.
We just need to wait for the crucial breakout and close above the brim level.
With moving averages, all is looking great with 7>21>200 - Green - Bullish
RSI - Buy divergence >50 - Bullish
Target 1 $120.00
GENERAL INFO:
The SPDR Select Sector Fund is a series of exchange-traded funds (ETFs) that are managed by State Street Global Advisors.
It is designed to track the performance of specific sectors of the S&P 500 index. There are 22 different funds covering sectors like Energy, Financials, Health Care, and Technology.
This is available as it's a cost-efficient way for investors to gain exposure to specific sectors of the market, without buying individual stocks.
This fund also gives an indication on the sentiment in general markets. Which looking at this analysis it's bullish and we can expect the markets to continue up in February. Fantastic!

Possible Diamond Bottom on S&P500I've been frustrated trying to figure out what the s&p500 is doing as it won't crash and won't recover. I think it might actually be forming a diamond bottom pattern: thepatternsite.com
This is a pretty accurate sign of a bottom. It's likely to fully recover, so if it starts breaking upward don't question it. Good luck!

S&P 500 market will open for the forth day todayThe S&P500 index yesterday closed at its highest trade line level in three days at 3,999.26 as investors turned to US stocks.
Most of the gains in this week's pullback in US stock prices have been led by bank stocks as well as shares of some media companies, which were probably untapped by individuals and businesses.
The S&P is now up 5.2% this week
This is not a piece of financial advice.
Hit the like button if you like it and share your charts in the comments section.
Thank you

SP500 SHORT IDEASP500
Daily deer volume imbalance dotor orj irj baigaa
ene hawias unalt orj ireh buren bolomjtoi
Eswel jaahan deeshleed daily poi zone deerees
dooshoo rejection awan unah bolomjoti haragdaj baina.

Annnnnnnnd it's gone. expecting 0% day. daily hammerbreakout of bear channel has failed. Expect some crazy daily candle

SP500 LETS BACKS TO 4000$It seems that the sp500 downturn has come to an end, it is time to recover or bounce at least against the desired 4000$.

SP500 showing major bull run to 4,410 with 1 MAJOR obstacleThe SP500 has formed a Cup and Handle and another bigger Cup and Handle in the Daily chart.
The price has broken up and out of it and the Moving Averages are all looking good giving the first target of 44,100.
The big BUTT!
Is that there has been a massive downtrend since 23 December 2021, which the price will have to overcome.
The price action is showing bullishness and I hope to science that the price breaks up and out of the downtrend range.
this will dish us up a nice Santa Claus rally. And bias wise I am long 13 stocks at the moment :P

S&P 500 Chart Analysis....
Hello Traders, here is the full analysis for this pair,
let me know in the comment section below if you have any questions,
the entry will be taken only if all rules of the strategies will be
satisfied. I suggest you keep this pair on your watch list and see if
the rules of your strategy are satisfied.
Dear Traders,
If you like this idea, do not forget to support with a like and follow.
PLZ! LIKE COMMAND AND SUBSCRIBE.

#US500 #SP500 #forex #US500 #SP500 #TRADING
- Shark Pattern 🦈
- Daily Frame
- The pattern fails to close the price above : 4326

S&P 500 Daily Analysis with ICT Concepts After performing a Market Structure Shift on Daily, S&P 500 long Swing Target is $4355 🎯
This is in confluence with Weekly FVG and Optimal Trade Entry (0.618-0.7 fibs) for the Short Idea
1. Long to $4355
2. Short from $4355 to mid range $3915 and lower
Good Luck 🍀

spx500 shortDear friends and companions:
According to my roadmap, after hitting the bottom of the ascending channel, the price will have a correction up to the specified area.
If you like my analysis, please like and follow me CME_MINI:ES1!

American Airlines Group flying up to $16.93 Inv Head and Shoulders has formed on Daily chart
We are just waiting for the breakout which will send the price to Target $16.93
With the bull market across the board with investors moving their money back to stocks and out of crypto, we are seeing global upside to come for stocks.

S&P500 showing all time highs thanks to 200MAIn the weekly chart of the S&P500, we can see the price has been on a continuous uptrend since 2011.
It’s moved from 1,170 up to a high of 4,834.
One indicator that I believe has helped this uptrend, the squiggly black line. This is the one and only 200 Day Moving Average.
This is the indicator that all investors and traders take note of. When the price is above the 200MA, the price is in a bull market.
And when the price is below the 200MA the price is in a bear market.
It is clear to us that since 2011, the 200MA has been a trampoline for the S&P500.
Each time the price touches, not only does it rally. It goes beyond to new all time highs.
And guess what happened last month?
It touched, and we got our rally.
On top of that, we have Falling Wedge in the chart (Triangle formation).
This is where the demand and supply drops, where the market consolidates before the next leg up.
As we’ve had our 200MA price touch, we can expect the S&P 500 to rally to a target of 4,834.

ES - Is the bottom in???Fellow traders,
ES is in a tricky place. Many traders are getting excited about longs this week and I can't blame them. However, my strategy is painting a different picture.
Last Tuesday and Wednesday we saw 3580 holding LIKE A BRICK WALL. It is very clear institutional entities had an interest in defending the level. 3600 - 3580 was a battle zone that I don't want any part of.
Last Thursday we had a mega hammer bar that pierced the low with power, then reversed and closed at the MA's (moving averages). In all technical respects, this bar is telling us to tighten expectations on shorts. It's location in the median range (3720 - 3520) reduces it's value as a bottom indicator. Clear respect of the MA's tells us this was a controlled lift from the low.
Friday was ALMOST an equal and opposite bar, however, the body of the candle is completely inside Thursday's candle body with it's upper wick smaller than Thursday's down wick. The value of this bar is very low.
All this being said, last week was a balance as expected. Last Sunday I had mapped out a few short entries, one at 3720 that did work well later in the week. Tuesday I raised an order on it and Wednesday the order was removed based on the daily chart structure. Specifically I don't like how the MA's are bunched together.
So I'm at an impasse. Chances are this week is going to be unprofitable for many traders. There is NO clear direction for my strategy. 2 conditions that would prompt my interest this week
1. Solid moves above 3680 with verified long entries around 3720
2. Daily closes below 3580 with short entries round 3520
I bet this would be a good week for range traders, but I'll leave that fun for those folks.
