Mastering indecision candlestick patterns - How to use it!In this guide I will explain the indecision candlestick patterns. The next subjects will be discussed:
- What are indecision candlestick patterns?
- What is the doji?
- What is the spinning top?
- What is the high wave candle?
What are indecision candlestick patterns?
Indecision candlestick patterns are formations on a price chart that suggest uncertainty in the market. They appear when neither buyers nor sellers have full control, meaning the price moves up and down during the trading period but closes near where it opened. This creates a candle with a small real body and often long wicks on either side, showing that the market explored both higher and lower prices but ended up not committing strongly in either direction. These patterns are often seen during periods when traders are waiting for more information before making bigger moves.
What is the doji?
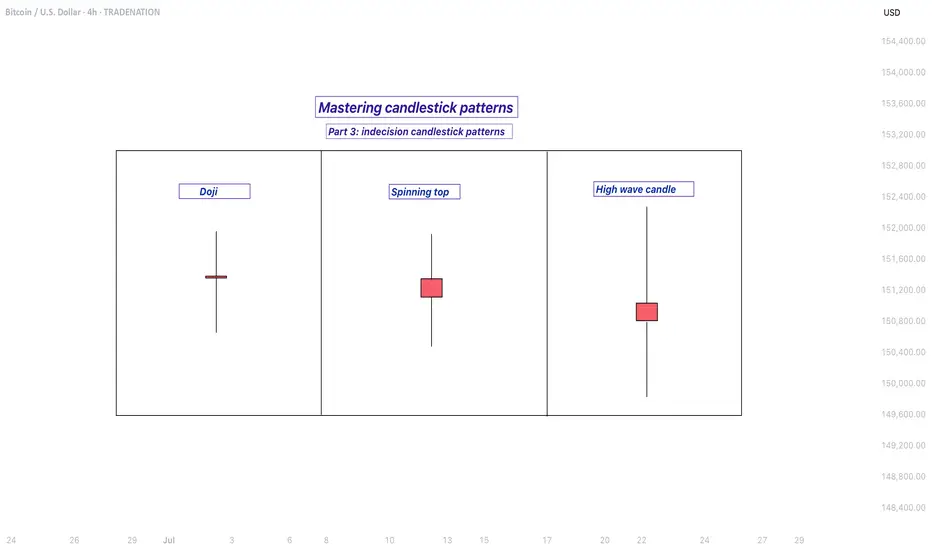
One of the most well-known indecision candles is the doji. A doji forms when the opening price and the closing price are almost identical, resulting in a very thin body. The wicks, which show the highest and lowest prices of the period, can be long or short depending on market activity. A doji tells us that buying and selling pressure were almost equal, which can happen during pauses in trends or before major reversals.
What is the spinning top?
Another type is the spinning top. A spinning top also has a small body, but unlike the doji, the open and close are not exactly the same. The wicks on both sides are typically of similar length, indicating that the market moved both up and down significantly before settling close to the starting point. This pattern reflects hesitation and a balanced struggle between bulls and bears.
What is the high wave candle?
The high wave candle is a more dramatic version of indecision. It has a small real body like the other patterns but features very long upper and lower shadows. This means the market swung widely in both directions during the period, but ultimately closed without making strong progress either way. The high wave candle signals strong volatility paired with uncertainty, which can often precede sharp moves once the market chooses a direction.
When you see these types of candles, they are essentially the market saying “I’m not sure yet.” They often appear at turning points or before big news events and can warn that the current trend may be losing strength. However, they are not guarantees of reversal or continuation on their own. Traders usually combine them with other technical signals or chart patterns to confirm whether the market will break out in one direction or the other.
-------------------------
Disclosure: I am part of Trade Nation's Influencer program and receive a monthly fee for using their TradingView charts in my analysis.
Thanks for your support. If you enjoyed this analysis, make sure to follow me so you don't miss the next one. And if you found it helpful, feel free to drop a like 👍 and leave a comment 💬, I’d love to hear your thoughts!
Spinning Top
How Can You Use a Spinning Top Candlestick Pattern in Trading?How Can You Use a Spinning Top Candlestick Pattern in Trading?
The spinning top candle is a key tool in technical analysis, highlighting moments of market indecision. This article explores what spinning tops represent, how they differ from similar patterns, and how traders can interpret them to refine their strategies across various market conditions.
What Does a Spinning Top Candlestick Mean?
A spinning top is a candlestick pattern frequently used in technical analysis. It consists of one candle with a small body and long upper and lower shadows of approximately equal length. The candle’s body symbolises the discrepancy between the opening and closing prices during a specified time period, while the shadows indicate that volatility was high and neither bulls nor bears could take control of the market.
This pattern signifies market indecision, where neither buyers nor sellers have gained dominance. It suggests a state of equilibrium between supply and demand, with the price oscillating within a narrow range. The spinning top may indicate continued sideways movement, particularly if it appears within an established range. However, if it forms after a bullish or bearish trend, it could signal a potential price reversal. Traders always look for additional signals from confirming patterns or indicators to determine the possible market direction.
It’s important to note that the spinning top candle is neutral and can be either bullish or bearish depending on its context within the price chart. The colour of the candle is not important.
Spinning Top vs Doji
Doji and spinning top candlesticks can be confused as they have similar characteristics. However, the latter has a small body and upper and lower shadows of approximately equal lengths. It indicates market indecision, suggesting a balance between buyers and sellers without a clear dominant force. Traders interpret it as a potential reversal signal, reflecting a possible change in the prevailing trend.
The doji candlestick, on the other hand, has a small body, where the opening and closing prices are very close or equal, resulting in a cross-like shape. If it’s a long-legged doji, it may also have long upper and lower shadows. A doji candle also represents market indecision but with a focus on the relationship between the opening and closing prices. Doji patterns indicate that buyers and sellers are in equilibrium, and a potential trend reversal or continuation may occur.
How Do Traders Use the Spinning Top Pattern?
Traders often incorporate the spinning top candle pattern into their analysis as a way to interpret moments of market indecision. Whether the pattern appears during a trend or at key turning points, its context plays a significant role in shaping trading decisions.
In the Middle of a Trend
When a spinning top forms in the middle of an ongoing trend, traders often view it as a signal of potential market hesitation. This indecision can indicate a pause in momentum, suggesting either a continuation of the trend or the possibility of a reversal.
Entry
In such cases, traders typically wait for confirmation of the next price move. A break above the high of the spinning top may signal the trend will continue upward, while a break below the low could suggest the trend may move down. Observing how subsequent candles interact with the spinning top can help a trader gauge the market’s intentions.
Take Profit
Profit targets might be aligned with key price levels visible on the chart, such as recent highs or lows. For traders expecting trend continuation, these targets might extend further, while those anticipating a reversal might aim for closer levels.
Stop Loss
Stop-loss orders might be set in accordance with the risk-reward ratio. This placement helps account for the pattern's characteristic volatility while potentially protecting against unexpected movements.
At the Top or Bottom of a Trend
When a spinning top forms at a significant peak or trough, it often draws attention as a potential reversal signal. This appearance may reflect market uncertainty after a prolonged uptrend or downtrend.
Entry
Confirmation from subsequent price action is critical. Traders typically observe if the price breaks above the candle (bullish spinning top) or below the candle (bearish spinning top) to determine the likelihood of a reversal.
Take Profit
Targets could be set at major support or resistance zones. A trader expecting a reversal may look for levels reached during the previous trend.
Stop Loss
Stops could be placed in accordance with the risk-reward ratio, allowing for the volatility often present at trend-turning points while potentially mitigating losses.
Remember, trading decisions should not solely rely on this formation. It's crucial to consider additional technical indicators, market trends, and risk management principles when executing trades.
Live Example
In the EURUSD chart above, the red spinning top candle appears at the bottom of a downtrend. A trader went long on the closing of the bullish candle that followed the spinning top. A take-profit target was placed at the closest resistance level, and a stop-loss was placed below the low of the spinning top candlestick.
There is another bearish spinning top candlestick pattern on the right. It formed in a solid downtrend; therefore, a trader could use it as a signal of a trend continuation and open a sell position after the next candle closed below the lower shadow of the spinning top candle.
A Spinning Top Candle: Benefits and Drawbacks
The spinning top candlestick pattern offers valuable insights into market indecision, but like any tool in technical analysis, it has its strengths and limitations. Understanding these might help traders use it more effectively.
Benefits
- Identifies Market Indecision: Highlights moments where neither buyers nor sellers dominate, providing a clue about potential price reversals or continuations.
- Versatile Across Trends and Markets: Can signal price consolidation, continuation, or reversal depending on its context. It’s also possible to use the spinning top across stocks, currencies, and commodities.
- Quick Visual Insight: The distinctive shape makes it easy to spot on charts without extensive analysis.
Drawbacks
- Requires Confirmation: On its own, the pattern lacks particular signals, needing additional indicators or price action for confirmation.
- Context-Dependent: Its reliability depends heavily on where it forms in the trend, making it less useful in isolation.
- Prone to False Signals: Market noise can produce spinning tops that do not lead to meaningful movements, increasing the risk of misinterpretation.
Takeaway
The spinning top candlestick reflects market indecision and suggests a potential reversal or consolidation. Traders use this pattern as a tool to identify areas of uncertainty in the market. Therefore, it's important to consider the spinning top pattern within the broader context and get confirmation from other analysis tools.
If you want to test your spinning top candlestick trading strategy or apply it to a live chart, open an FXOpen account and start trading with tight spreads from 0.0 pips and low commissions from $1.50. Good luck!
FAQ
What Is a Black Spinning Top?
A black (red) spinning top is a variation of the spinning top candlestick pattern with a small body and equal-length shadows. This is different from the white (green) spinning top, as its body indicates a lower closing price. Traders analyse its context, technical factors, and confirmation from other indicators to interpret its significance.
What Is a Spinning Top Candlestick?
A spinning top candle meaning refers to a pattern characterised by a small body and long upper and lower shadows of roughly equal length. It reflects market indecision, where neither buyers nor sellers hold a clear advantage, and is often used in technical analysis to assess potential trend reversals or consolidations.
Is the Spinning Top Bullish or Bearish?
The spinning top candlestick pattern is neutral by nature. Its significance depends on the context within the price chart. When it appears at the end of an uptrend, it may signal a bearish sentiment, while at the end of a downtrend, it can indicate a potential bullish reversal.
What Does a Spinning Top Candle Indicate?
This pattern indicates a period of indecision and balance between buying and selling pressure. Depending on its position within a trend, it can signal consolidation, continuation, or a reversal in price direction.
What Is the Spinning Top Rule?
There is no fixed "rule" for spinning top trading. Traders typically look for confirmation from subsequent price movements or other technical indicators to decide on a course of action.
Is Spinning Top a Doji?
Although similar, spinning tops and doji candles differ. A spinning top has a small body with visible discrepancies between opening and closing prices, whereas a doji’s body is almost non-existent.
Trade on TradingView with FXOpen. Consider opening an account and access over 700 markets with tight spreads from 0.0 pips and low commissions from $1.50 per lot.
This article represents the opinion of the Companies operating under the FXOpen brand only. It is not to be construed as an offer, solicitation, or recommendation with respect to products and services provided by the Companies operating under the FXOpen brand, nor is it to be considered financial advice.

USD/CHF How To Trade Accumulating Pair With Spinning TopsThis Is An Educational + Analytic Content That Will Teach Why And How To Enter A Trade
Make Sure You Watch The Price Action Closely In Each Analysis As This Is A Very Important Part Of Our Method
Disclaimer : This Analysis Can Change At Anytime Without Notice And It Is Only For The Purpose Of Assisting Traders To Make Independent Investments Decisions.
