FLOCK Near Resistance After Long DowntrendFLOCK is currently trading near the upper trendline of a falling wedge structure. This area acts as a key resistance, as price has respected the wedge boundaries throughout the downtrend. The recent push higher shows improving momentum, but the structure is still intact until a breakout is confirmed.
If price manages to break and hold above the upper trendline, it would signal a potential trend reversal, with room for a stronger recovery toward higher resistance levels. Falling wedges often resolve to the upside, especially when price compresses near resistance like this.
If price fails to break the upper trendline and gets rejected, a pullback toward the lower boundary of the wedge remains possible. This makes the current zone critical for short term direction.
Spot

UNI - Long idea.BINANCE:UNIUSDT.P
I am waiting for a reaction at this level. The nearest target is to break through the $6.1 high.
Add it to your watch list. Set alerts and wait for the price to approach the level.
I will not short. I will work strictly from the level.

NEAR - spot, long term.BINANCE:NEARUSDT.P
Throughout 2025, the coin remained within its range.
I consider exiting the range a deviation, and we will get the same deviation on the other side of the range.
Good luck with your trading! Use your risk management strategy.
The ideal entry point will be: $1.4 and $1.25.
The targets on the chart are a minimum of $3.2.

Key reasons to consider QRLQuantum Resistant Ledger (QRL) is the only live L1 blockchain with full post-quantum cryptography since 2018.
1. Technological barrier: uses XMSS (hash-based, NIST-approved), resistant to Shor and Grover quantum attacks today. BTC, ETH, SOL, and almost all others are at risk in 5-15 years.
2. Maximum supply is fixed at 105 million (same as BTC - 21 million). About 80 million have already been mined, emission tail until 2140, inflation falls to ‹0.2% by 2030.
3. Low market capitalization with high uniqueness: ~$110-130 million (price ~$2.1 million), making the project one of the most undervalued in the quantum security segment.
4. Active development 2025-2026:
* Launch of EVM-compatible L2 (QRL-EVM) in Q1 2026 – will allow DeFi applications to migrate without changing the cryptography.
* Partnerships with governments and enterprises (UK, Switzerland) for long-term value storage.
* Integration into Ledger cold wallets (native support from 2024).
5. Historical performance in the bear market: in 2022-2024, it fell 12-15 times weaker than most altcoins, proving itself to be "digital gold 2.0" for long-term holders. 6. In short: QRL is portfolio insurance against the day when quantum computers break ECDSA. At the current price, it's one of the most asymmetric bets in crypto.
In short: QRL now, in December 2025, is like Bitcoin in 2009!

Wait for Nice!I placed an order with 25% cash on the price of $61,800.
After that, we will monitor the trend, volume and behavior of the market around this price.
Let's see what will happen!

AVAXUSDTIn the daily timeframe, there is a strong resistance zone around $15, which can be considered the first target. If this resistance is broken and price manages to hold above the breakout level, higher targets will become accessible.

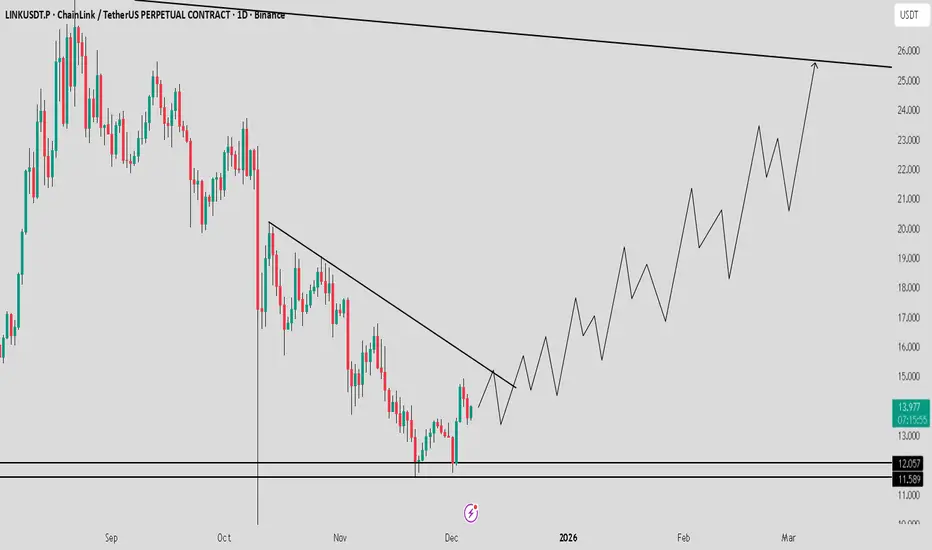
LINK Showing Strong Spot Structure_Double Bottom Point Toward 25If you want to accumulate a strong spot coin, LINK / USDT is one of the best options right now. It has formed a clean double bottom and is showing strong upward momentum. I expect a continuation move toward $25 soon. Manage risk wisely and always follow confirmations.
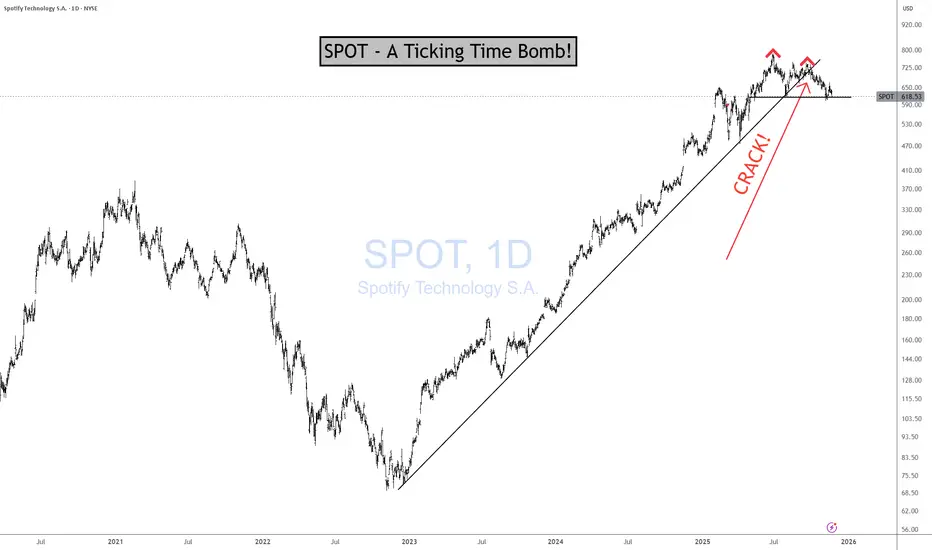
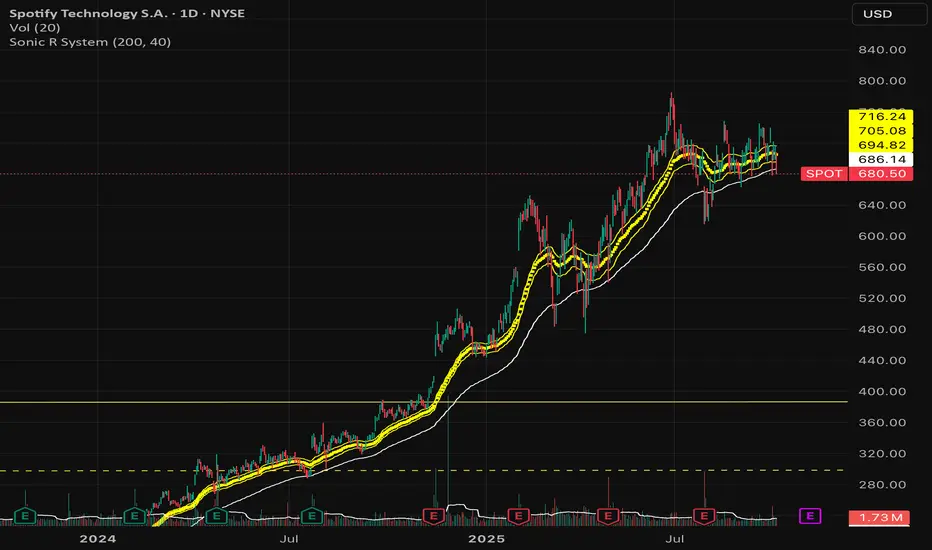
SPOT - A Ticking Time Bomb!SPOT Earnings Yield of 1.3% according to current data — meaning you’re getting about 1.3 cents of profit per dollar invested. LOL!
Better you give me your hard-earned money and I'll give you 2% instead of 1.3%. I like to splurge! :)
The Structural Constraint
Spotify cannot scale margins the way Netflix did because:
They don’t own the content
They don’t control input costs
They have to pay out ~70% of every dollar to rights holders
Their pricing power is weak and regulated by deals with labels
The labels decide what happens to Spotify’s margins, not Spotify
This is the definition of a business with a hard economic ceiling.
No amount of subscribers fixes the cost structure.
Spotify’s long-run net margin:
1–2% (When they “beat,” the gains evaporate the next quarter.) If Spotify hit 5% margins — a level they’ve never sustained.
And on a positive note —
THANK YOU for helping me hit 5,000 followers! 🙏🔥
Let’s keep going.
If you find value in the work:
👉 Boost
👉 Follow
👉 Leave a comment
Let’s push to 6,000 and keep building a community rooted in facts, not fairy tales.
Spot + Hedge — The Fundamental Framework for Investors Who TradeYou don’t have to treat holding and trading as two separate worlds. The most effective market participants combine both. They anchor their strategy in long-term conviction while using short-term tools to manage volatility and protect capital. This balance allows them to participate in structural growth without exposing their portfolio to unnecessary drawdowns.
Spot holdings are the foundation. A well-built spot position compounds through cycles, absorbs volatility, and benefits from every wave of adoption that pushes the market forward. Staking adds an additional layer by generating yield during periods of consolidation. For traders who think in cycles rather than days, spot is the engine that keeps building value in the background.
A hedge position serves a different purpose. It is not designed for aggressive speculation. It is a tactical layer that reduces exposure when conditions become unstable. Futures shorts, when sized properly, act as a defensive tool that preserves the value of your long-term assets without forcing you to sell them. This approach keeps you invested while giving you room to breathe during sharp corrections.
When hedging makes sense:
– After a strong rally pushing into major resistance levels.
– When funding rates are extremely positive and the market is crowded with leveraged longs.
– When macro data shifts, liquidity tightens, or a regulatory event increases uncertainty.
– When your portfolio has grown significantly and you want to lock in part of that increase without taking profits.
The purpose of the hedge is stability. You are not aiming to turn the short into a profit engine. You are using it as portfolio insurance. A well-timed hedge limits the damage during pullbacks and keeps you positioned for the next leg of the cycle.
Simple implementation example: assume you hold $20,000 of ETH spot as your long-term allocation. To hedge, you short 25–30 percent of the position using ETH perpetual contracts. If ETH drops 10 percent, the hedge cushions the downside by generating gains on the short. If ETH continues rising, your spot position captures the upside and the hedge becomes the cost of protection, similar to an insurance premium.
This framework helps traders stay in the market, avoid emotional exits, and preserve capital during volatile periods. It combines conviction with discipline and gives long-term holders a practical way to navigate uncertainty without breaking their overall strategy.

#BTC Time to Buy ?!I believe We could have another downside move , and then we can have a buy position on it as Scalp . for 6-15%
Added in watchlist .

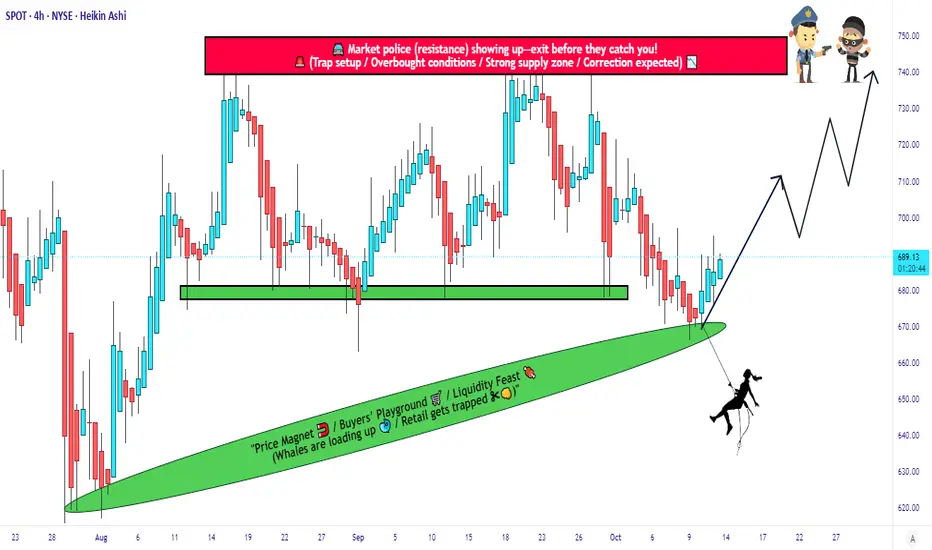
SPOT Price Action | Strong Support, Tight Stop, Open Target!🎧 SPOT | Thief Trader Profit Playbook 💰
“When Music Meets Money — Spotify’s Chart Is About to Drop Beats & Gains!” 🎵📈
🧭 Plan:
Bullish Bias — Thief-style layered accumulation for a smart entry!
We’re eyeing SPOT (Spotify Technology S.A.) for a potential swing/day trade move north.
🎯 Entry (Layering Strategy)
💎 The Thief Strategy uses multiple limit layers to build a strong position.
Here’s the sneak-in setup (choose your own comfort):
🧩 Buy Limit 1 → $670
🧩 Buy Limit 2 → $680
🧩 Buy Limit 3 → $690
(You can expand layers based on your risk appetite — remember, thieves adapt!) 😎
🛑 Stop-Loss (Thief’s Safe Escape)
This is the Thief SL @ $650
⚠️ Note: Dear Ladies & Gentlemen (Thief OG’s), this is not a fixed SL — trade smart, manage your own risk. You make money → you take money. 💼
🎯 Target Zone (Police Barricade 🚓)
Target: Around $740
The chart shows a strong resistance + overbought area + possible trap zone — that’s where the police barricade is! 🚧
Escape with profits before they catch your bags! 💨💰
⚠️ Note: Again, Thief OG’s — this is a flexible TP zone, not financial advice. Secure your profits when the opportunity sings! 🎤📊
🧩 Correlated Pairs to Watch ($)
Keep an eye on these correlated tickers for extra confirmation or sentiment cues:
NASDAQ:NFLX → Streaming sector momentum 🎬
NASDAQ:AAPL → Tech sentiment driver 🍏
NASDAQ:MSFT → Market leader correlation 🖥️
NASDAQ:META → Digital ad revenue influence 💬
NASDAQ:QQQ / AMEX:SPY → Index health check 💪
These tickers often dance together in the same rhythm — when the tech sector grooves, SPOT follows the beat! 🕺
⚙️ Technical Key Points:
Bullish structure holding above $650 zone support 🧱
Momentum strengthening after pullback retest 🎢
RSI mid-zone recovery — not yet overbought, potential room to run! 📈
Volume showing accumulation footprints 👣
✨ If you find value in my analysis, a 👍 and 🚀 boost is much appreciated — it helps me share more setups with the community!
⚠️ Disclaimer:
This is a Thief-style trading strategy, shared for educational & fun purposes only.
Trade responsibly. I’m not your financial advisor — I’m your chart burglar! 😜💼
#SPOT #Spotify #SwingTrade #DayTrade #StockMarket #ThiefTrader #LayeringStrategy #TechnicalAnalysis #BullishSetup #TradingView #EditorPick #ProfitPlaybook #SPY #QQQ #NASDAQ #StocksToWatch
Crude Oil's Critical Breakdown: Is a Plunge to $58 Imminent?Hello, TradingView community! 👋 SpotCrude (WTI) has taken a significant turn, closing the week at a precarious 61.168 . After failing to sustain its recent rally, oil is now teetering on the edge of a major support level. Is this the beginning of a new downtrend, or will buyers step in to defend the line? The upcoming week, November 3rd to 7th, will be decisive.
Let's drill down into the multi-timeframe data, blending classic technical theories with key indicators to forge a robust trading strategy for the days ahead. 💡
🌍 The Macro Outlook: Weekly & Daily Charts - The Bears Are Back in Town
The market is a battlefield, and the trend is your strongest ally.
The higher timeframes are flashing significant warning signals, suggesting the recent strength was merely a correction in a larger downtrend.
Weekly Chart (1W) : The long-term picture remains bearish. As per Dow Theory , the primary trend is down, with the recent push higher failing at a key resistance zone. The price is firmly below the Ichimoku Cloud, and the formation of a Bearish Engulfing candle last week is a powerful rejection signal.
Daily Chart (1D) : On the daily chart, the story of failure becomes clearer. We have a potential Double Top formation right at a major resistance level. The RSI is exhibiting a clear bearish divergence where price made a higher high, but the RSI failed to confirm, indicating weakening momentum. The price has been decisively rejected and is now threatening to break down from this topping pattern.
⚔️ The Swing Trader's Battleground: 4-Hour & 1-Hour Analysis
For swing traders, a classic and powerful reversal pattern has taken center stage.
4-Hour Chart (4H) : This timeframe is the most critical. A clear Head and Shoulders pattern has formed, and crucially, the price has already broken below the neckline . This is a textbook bearish reversal signal. The Bollinger Bands are expanding, pointing to an injection of downside volatility . From a Wyckoff Theory standpoint, this breakdown represents a "Sign of Weakness" (SOW) following a distribution phase at the highs.
1-Hour Chart (1H) : The hourly chart confirms the breakdown with conviction. Price is trading well below the VWAP and the Ichimoku Cloud, both of which are now acting as overhead resistance. Any attempt to rally back to the broken neckline (around the 62.00-62.20 area) is likely to be met with significant selling pressure.
🔬 The Intraday Scalpel: 30M, 15M, & 5M Insights
For intraday traders, the path of least resistance is clearly down.
30M/15M Charts : These timeframes are displaying a strong, impulsive downtrend. Following the initial breakdown, we are seeing the formation of a Bearish Pennant or flag. This typically represents a brief pause as sellers reload for the next push lower. The RSI is hovering near oversold levels, so a minor bounce is possible, but this is likely a selling opportunity, not a reversal.
5M Chart : On the 5-minute chart, the VWAP is the key level to watch. As long as the price remains below it, bears are in full control. Scalpers should be wary of any sudden spikes upward, as they could be a bear trap designed to lure in buyers before the next decline. Watch for volume to increase on down moves as confirmation of the bearish intent.
⏳ Gann Theory & Price/Time Analysis
Applying the principles of W.D. Gann, the rejection occurred at a key Gann resistance angle. The price has now broken below a key support angle, suggesting an acceleration of the downtrend. Gann's range analysis points to the $58.00 - $58.50 area as the next major price magnet to the downside.
🎯 Actionable Trade Plan for the Week Ahead
Based on this comprehensive analysis, the bearish case is overwhelmingly strong.
The Primary Bearish Scenario 🐻
Entry: The ideal entry is to short a pullback to the broken Head and Shoulders neckline, targeting the 62.00 - 62.20 resistance zone. An alternative entry is to short the breakdown of the current bearish pennant, below 61.00 .
Targets: The first target is the psychological 60.00 level. The main target, derived from the Head and Shoulders pattern measurement, is the major support zone at 58.50 .
Invalidation: A strong and sustained 4H candle close back above the right shoulder of the pattern, specifically above 63.00 , would negate the immediate bearish thesis.
The Low-Probability Bullish Scenario 🐂
Entry: This is a counter-trend trade and is not recommended. It would require an exceptionally strong reclaim of the 62.50 level, effectively invalidating the entire Head and Shoulders pattern.
Targets: Resistance at 63.50 and 64.50 .
Invalidation: Any drop back below 62.00 .
Conclusion: The Evidence Points Down
The technical picture for Crude Oil is decidedly bearish. With a confirmed Head and Shoulders breakdown on the 4H chart, supported by weakness on both higher and lower timeframes, the path of least resistance is to the downside.
This week, the strategy is to sell the rallies . Be patient and wait for a high-probability entry near established resistance.
What are your thoughts on oil? Are you positioning for a further drop, or do you see a reversal in the cards? Share your analysis in the comments below! 👇
Disclaimer: This is not financial advice. This analysis is for educational purposes only. Always conduct your own research and manage your risk appropriately.

S&P 500 (US500) MASSIVE TECHNICAL BREAKDOWN | ULTIMATE Trading 🚀 S&P; 500 (US500) MASSIVE TECHNICAL BREAKDOWN | Oct 27-31, 2025 | ULTIMATE Trading Strategy 📊
Current Price: 6,792.5 | Strategy: Intraday Swing Trading | Timeframes: 5M → 1D Analysis ⏰
━━━━━━━━━━━━━━━━━━━━━━━━━━━━━━━━━━━━━━━━━━━━━━━━━━━━━━━━━━
💪 DAILY (1D) ANALYSIS - Swing Trader's Powerhouse Setup
S&P; 500 on the daily timeframe is displaying STRONG BULL STRUCTURE near support zones offering clean entry opportunities this week! 🎯
━━━━━━━━━━━━━━━━━━━━━━━━━━━━━━━━━━━━━━━━━━━━━━━━━━━━━━━━━━
⚡ 4-HOUR (4H) SWING TRADE SETUP - PRIMARY ENTRY BLUEPRINT
The 4H timeframe is showing TEXTBOOK BREAKOUT FORMATION! When price closes above 6,840 with volume spike = AGGRESSIVE LONG ENTRY triggered! Ichimoku Cloud on 4H shows bullish cloud color with price above all components = strong continuation bias locked in! 📊
━━━━━━━━━━━━━━━━━━━━━━━━━━━━━━━━━━━━━━━━━━━━━━━━━━━━━━━━━━
🎯 1-HOUR (1H) INTRADAY EXECUTION ZONE - Strike Point Identified
Hourly chart displaying PERFECT CONSOLIDATION BREAKOUT PATTERN!

End of 3years of uptrend soon !?- NYSE:SPOT has been in an uptrend for last 3 years. It appears that it's running out of gas.
- NYSE:SPOT has sneakily increasing price of subscription for the last two years continuously which has propped up the numbers.
- I believe it will enter in correction territory very soon as soon as the next year.
- There are lot of gaps unfilled while it was on the uptrend.
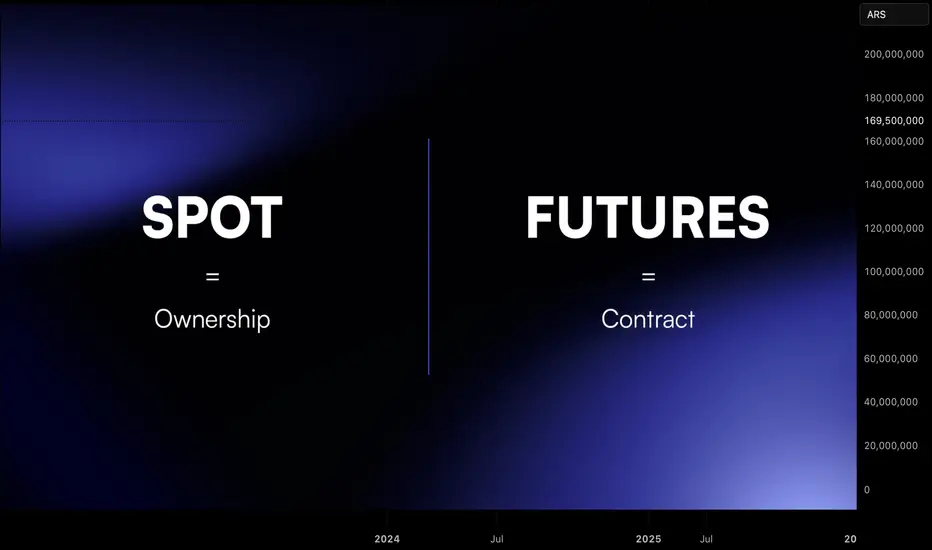
Futures vs Spot: What Traders Need to Know1. Introduction
In crypto, two of the most common ways to trade are spot markets and futures markets.
Both can be profitable, but they operate differently and knowing the differences is critical for survival.
Spot trading is straightforward: you buy the asset, you own it.
Futures trading is more complex: you speculate on the asset’s price without actually owning it.
This guide explains the differences, benefits, and risks of each so you can decide which suits your style.
2. What Is Spot Trading?
Spot trading is simple. You buy the asset, you own it.
There is no leverage. You pay the full price.
Profit and loss move one-to-one with the asset’s price.
Pros
Simple to understand.
No liquidation risk.
Can benefit from staking or long-term custody.
Cons
Limited upside with small capital.
Cannot profit when the market falls.
3. What Is Futures Trading?
Futures are contracts. You do not own the asset, only exposure to its price.
They allow leverage, often up to 10x or more.
You can go long to profit from rising markets or short to profit from falling ones.
Contracts can have expiry dates or be perpetual.
Pros
Flexibility to trade both directions.
Efficient capital use with leverage.
Useful for hedging spot positions.
Cons
Liquidation risk.
Complex funding fees on perpetuals.
Temptation to overtrade.
4. Key Differences: Spot vs Futures
Spot = You own the asset.
Futures = You own a contract.
Spot = No leverage.
Futures = High leverage possible.
Spot = Profits only when price rises.
Futures = Profits when price rises or falls.
Spot = Best for beginners and investors.
Futures = Best for experienced traders and hedgers.
Spot = simplicity. Futures = flexibility, but higher risk.
5. Why Futures Can Be Risky
Leverage is attractive, but it cuts both ways:
A 10 percent drop with 10x leverage equals a 100 percent account loss.
Liquidations close positions automatically if collateral is too low.
6. When to Use Spot vs Futures
Use spot if you want to own crypto long-term.
Use spot if you prefer simplicity and no liquidation stress.
Use futures if you want to hedge your holdings.
Use futures if you need market exposure with limited capital.
Use futures only if you have strict discipline and risk control.
7. Combining Spot and Futures
Many professionals use both:
Hold spot ETH as a long-term investment.
Use futures shorts to hedge during downturns.
This balances long-term conviction with short-term protection.
Think of it like insurance: futures protect spot positions when markets get volatile.
8. Risk Management Is the Deciding Factor
Whether you trade spot or futures, risk management decides survival:
In spot: limit allocation per asset.
In futures: control leverage, set stop losses, and manage liquidation risk.
In both: size positions by account % risk.
Without a risk plan, futures become gambling and even spot can lead to poor results.
#BTCUSDT.P (1H Chart)#BTCUSDT.P
(1H Chart)
🔹️ Bitcoin Analysis Update 🔹️
The bullish outlook from the previous analysis remains valid.
The yellow box resistance has been engulfed, and I expect the bullish move to continue.
📌 Best entry zone: Blue Box
🎯 Main target for this long setup: Red Box (114,000 – 114,500)
🚀 If you enjoyed this analysis, please give it a boost 💙
and to not miss any new analyses or setups, make sure to follow me 📊
🆔️ @Rasoolahmadi

USOIL: 70$ BREAKOUT ROCKET FUELED! Black Gold Rally 🛢️ USOIL: 70$ BREAKOUT ROCKET FUELED! Black Gold Rally 📊
Current Price: $65.465 | Date: Sept 27, 2025 ⏰
📈 INTRADAY TRADING SETUPS (Next 5 Days)
🎯 BULLISH SCENARIO
Entry Zone: $65.20 - $65.60 📍
Stop Loss: $64.80 🛑
Target 1: $66.50 🎯
Target 2: $67.30 🚀
🎯 BEARISH SCENARIO
Entry Zone: $65.80 - $66.20 📍
Stop Loss: $66.60 🛑
Target 1: $64.70 🎯
Target 2: $64.00 📉
🔍 TECHNICAL ANALYSIS BREAKDOWN
📊 KEY INDICATORS STATUS:
RSI (14): 59.4 ⚡ Bullish Momentum Zone
Bollinger Bands: Mid-Band Breakout 🔥
VWAP: $65.35 - Acting as Springboard 💪
EMA 50: $64.80 ✅ Golden Cross Setup
Volume: Institutional Interest Rising 📊
🌊 WAVE ANALYSIS:
Elliott Wave: Wave 3 Impulse Loading 🌊
Fibonacci Target: $68.50 (161.8%) 🎯
🔄 HARMONIC PATTERNS:
Bullish Bat Completion at $64.90 ✨
ABCD Pattern targeting $67.20 🔄
⚖️ SWING TRADING OUTLOOK (1-4 Weeks)
🚀 BULLISH TARGETS:
Psychological: $70.00 🏆
Weekly Resistance: $68.80 🌙
Gann Level: $69.25 ⭐
📉 BEARISH INVALIDATION:
Weekly Support: $63.50 ⚠️
Critical Break: $62.00 🚨
🎭 MARKET STRUCTURE:
Trend: Ascending Triangle 💪
Momentum: Energy Building 🔥
Wyckoff Phase: Accumulation End 📈
Ichimoku: Bullish Cloud Entry 🟢
⛽ OIL MARKET DYNAMICS:
Supply Cuts: OPEC+ Extensions 🛢️
Demand Growth: Winter Season 🌨️
Inventory Draws: Bullish Data 📉
Geopolitical Premium: Risk-On ⚔️
⚡ RISK MANAGEMENT:
Max Risk per Trade: 2% 🛡️
R:R Ratio: Minimum 1:2 ⚖️
Breakout Confirmation: $66.00 hold 📏
🌍 FUNDAMENTAL CATALYSTS:
EIA Reports Supporting Bulls 📈
Middle East Tensions Premium 🌍
China Demand Recovery Signs 🏭
US Dollar Weakness Helping 💵
🔥 CRITICAL LEVELS TO WATCH:
Breakout Zone: $66.00-$66.30 💥
Support Cluster: $65.00 | $64.50 | $64.00 🛡️
Resistance: $66.50 | $67.50 | $68.00 🚧
🎯 FINAL VERDICT:
WTI primed for $70 EXPLOSIVE RALLY! 🚀
Black Gold showing institutional love! 💎
Supply-demand imbalance = bullish fuel! ⛽
Trade Management: Buy dips above $65.00 💰
Breakout Watch: $66.30 decisive level! 🔔
---
⚠️ Disclaimer: Commodity trading carries high risk. Use appropriate position sizing. Educational analysis only.
For individuals seeking to enhance their trading abilities based on the analyses provided, I recommend exploring the mentoring program offered by Shunya Trade. (Website: shunya dot trade)
I would appreciate your feedback on this analysis, as it will serve as a valuable resource for future endeavors.
Sincerely,
Shunya.Trade
Website: shunya dot trade
🔔 Follow Oil Market Updates | 💬 Drop Your $70 Oil Timeline

SPOT BREAKOUT - HYPE ALERT --> THE/USDT🚨SPOT BREAKOUT HYPE ALERT🚨
Missed the $ASTER rocket?
Don’t worry, the real opportunity might just be starting with TSX:THE (@ThenaFi_), now trading on #Binance!
Why am I watching TSX:THE closely?
🔸DEX on BNB Chain, just like $ASTER
🔸Backed by kingmakers CZ & @YziLabs
🔸But while $ASTER is already at a ~$3B market cap, TSX:THE is sitting at just ~$64M… ⏳
Fundamentals?
🔹$ASTER revenue: +/-$37M
🔹 TSX:THE revenue: +/-$39M
That’s right TSX:THE is already OUTPERFORMING in revenue at a fraction of the valuation!
💡TA Spotlight:
TSX:THE is hovering at its historical support, the exact level where it last pumped 20x post-breakout. The chart is loaded for another big move.
📈I wouldn’t be shocked to see the $ASTER hype repeat here, with serious money rotating from $ASTER to $THE! 👀
→Small cap + real fundamentals + explosive TA = This could be a next billion-dollar narrative. 🚀
Not a financial advice, #NFA

CGPT - READY TO FLY$CGPT - bullish breakout ✅🚀
✅120 days downtrend breakout + retest
✅H4 breakout candle
💣A weeekly candle close above 1.050$ would be a catalyst for the bulls!
Price might start a new bull cycle from here 📈
30%+ pump potential !
Importants levels are in my view! #DYOR

$LQTY - 90-Day Falling Wedge Breakout!$LQTY - 90-Day Falling Wedge Breakout! ✅
After 90 days trapped in a falling wedge, we finally got the breakout! 💥
Bullish vibes kicking in for next week? 📈
Follow for more 🐸

$MERL - 6+ Month trend breakout & retest?? AQUISUK:MERL - 6+ Month trend breakout & retest??
Price structure looks very interesting here 📈
Same as before it explode 800%+, I see a bullish retest & a possible whole bottom accumultion!
Key support to be maintained to confirm the retest:
0.17200 or/and 0.16800$

SEI / USDT : Looking so good for strong bullish rallySEI/USDT is showing strong momentum and is once again breaking out of trendline resistance. If this breakout sustains, we can expect a short-term rally toward $0.40 – $0.45.
Spot Update: SEI is also looking very attractive for spot buyers — a good accumulation opportunity.
Midterm Target for SEI: $0.80 – $1 🚀

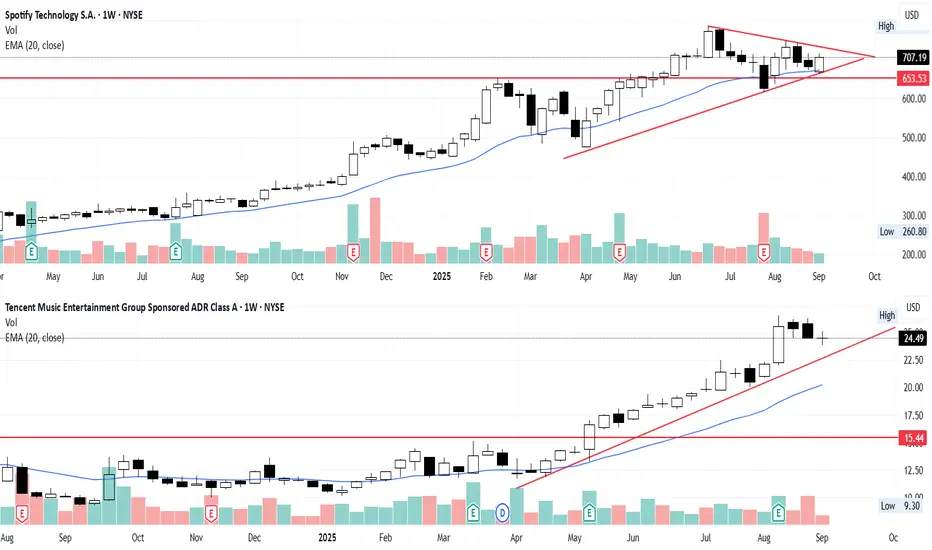
SPOT: Consolidation done in September? SPOT is resting well above the resistance turn support line and is guarded well by the Uptrend support line + EMA20 in weekly chart. TME is unstoppable since May 2025 after broke the long term resistance line. Will SPOT follow their peer TME for the uptrend continuation? The music streaming sector is still looking good, SPOT is still one of the stock to watch in this September definitely. Perhaps TME as well..