Technical Analysis – KASPA/USDT (1D) + spot trade planTechnical Analysis – KASPA/USDT (1D)
Trend Structure & Price Action
KASPA experienced a strong bullish rally (highlighted in orange) starting in mid-April, followed by a descending channel (bullish flag) correction (highlighted in green).
Currently, the price is approaching major support zones, indicating a potential reversal opportunity.
Support & Buy Zones (Marked)
Buy Spot 1: ~$0.062–$0.067 → Key historical support, potential bottom range.
Buy Spot 2: ~$0.070–$0.075 → Moderate support, former resistance turned support.
Buy Spot 3: ~$0.078–$0.081 → Current local demand zone and trendline interaction.
These zones represent incremental buying opportunities during correction.
Indicator Analysis
Market Cipher / Divergence Indicators
Multiple bullish divergence signals are forming (green dots), suggesting buyer interest is growing.
Momentum is in deep negative territory and may be bottoming.
RSI (14)
RSI is at 32.95, which is approaching oversold territory (below 30), signaling a potential reversal.
Money Flow Index (MFI)
MFI is at 19, which is also considered oversold, showing capital is leaving but likely nearing exhaustion.
Stochastic RSI
Stochastic RSI is below 10 (6.22) and starting to cross, indicating a strong potential bullish reversal in the short term.
Trading Plan – KASPA/USDT (Spot Strategy)
Entry Strategy (DCA)
Buy Spot Entry Range Allocation Reason
Spot 1 $0.062 – $0.067 50% Major long-term support, deep oversold zone
Spot 2 $0.070 – $0.075 30% Mid-range support, confirmation zone
Spot 3 $0.078 – $0.081 20% Early entry for aggressive traders
Risk Management
Stop Loss (optional): Below $0.060 (break of long-term structure)
Average Entry (if all 3 zones are filled): ~$0.071 (estimated)
Capital Allocation: Use max 3–5% of total capital per setup for risk control.
Profit Targets
Target Level Price Rationale
TP1 $0.092 – $0.095 Top of descending channel
TP2 $0.105 Previous swing high (April peak)
TP3 $0.120 Breakout and continuation target
KASPA is currently in a healthy correction within a bullish continuation pattern (falling channel). The confluence of oversold indicators (RSI, MFI, Stoch RSI), support zones, and bullish divergence suggests a favorable buying opportunity for swing or position traders. If the price respects these zones, a bounce toward the prior high or breakout levels is likely.
Spot

Solana | SOL spot TRADE SETUP +65%Firstly, let's look at the SOL chart from a larger view to confirm the agreement for a bullish setup.
What we see above is a clear bullish bottom, followed by a sharp V-Shaped recovery in the daily timeframe.
From here, the ideal entry could be within this zone, either dollar-cost average or just one spot buy:
With the STOP-LOSS around here:
And THREE TP (take profit) points:
1️⃣
2️⃣
3️⃣
Naturally with the timeframe of your HOLD increasing as your target moves higher.
_________________________
BINANCE:SOLUSDT

Potential break and retest of ATH's on SPOT!OptionsMastery:
🔉Sound on!🔉
📣Make sure to watch fullscreen!📣
Thank you as always for watching my videos. I hope that you learned something very educational! Please feel free to like, share, and comment on this post. Remember only risk what you are willing to lose. Trading is very risky but it can change your life!

Litecoin Bull Market Bullish Wave Now In The MakingUsing the leverage or not will really depend on what you buy. Bitcoin is trading right now almost at 100K and very close to its All-Time High but this isn't the case for Litecoin or other Altcoins.
Not all your capital should be used for leverage or spot, it can be divided a portion here and a portion there, it is not black or white there is a full color spectrum to choose from and each color have a huge range of gradation. Think about that one for a minute.
If you have to ask the question, "Can I use leverage now?" the answer is always no. The person that can use it don't need to ask. If you have to ask means that you are not prepared or don't know what to expect. Since it is risky and the game is not only the first step, it is better to be prepared.
Using leverage, you can have positions open and "winning" for months and when correction time comes, one mistake can lead to the next until the whole house of cards breaks down and you are left with nothing. It is a complex game to say the least. Learning of course requires practice and for success it is very important to have great entry price and right timing.
How you choose to trade is up to you.
Maybe nobody can beat index funds with compounded interest after tax for 20 years straight or with billions of dollars but individually it can be done in so many ways. It can be done and has been done a countless number of times for 3 years, 5 years, 10 years, 15 years and so on. You don't need a lifetime of this system you just need a big hefty profit and continue with a strategy that adapts to market conditions as you trade and grow.
Investing is not the same as trading. Investors always vouch for buy and hold and do nothing, but trading can be a great asset yet requires work and big money makes it harder, and harder it becomes the bigger the pot.
Individually, as in us, we can make a fortune easy with the right timing, mindset and buy and hold. Buy near the bottom of the bear market or a strong correction. It doesn't have to be the perfect bottom, can be just close and even months away. Sell when prices are high or going up. It doesn't have to be the top nor the exact All-Time High date.
If we can put our capital to grow between 200-500% within each cycle with Crypto, we are not talking billions as we are all small, we can make millions of times more profits than choosing stocks or the investor favorite stock index funds.
The index funds are paying less and less with each passing decade. Crypto is here to shake things up a little bit. A breath of fresh air.
We can go back to high earnings, high profits with very little effort and easy enough that anybody who invest time to actually studying the systems will get their moneys worth. The stock market is so 1950s... Crypto is the future of finance, I don't think there is any doubt anymore.
As long as your money is in the market, you will win long-term.
Namaste.

BTC Range Bound | Breakout Imminent ?👀 Welcome to my Trading View Analysis and Trading Channel Here , we share the latest market analysis, trading signals, and key insights together .
Ready for smarter trades ? ⭐️
⚡️Today , we're going to analyze the BTC( BitCoin) coin together on the daily timeframe and find triggers for our positions .
📊✨ Bitcoin 4H Technical Analysis & Weekly Outlook – May 6, 2025
🔸 BTC is currently trading within a consolidation range between $97,325 and $93,780, indicating a potential accumulation zone before the next major move. 🌀
🔍 Key Technical Levels:
📈 Resistance: Break above $97,325 could trigger a long entry, suggesting bullish continuation. 🚀
📉 Support: Drop below $93,780 may activate a short setup, signaling bearish pressure. ⚠️
📐 Indicators Breakdown:
🔹 EMA 100 & 200: Positioned below price, supporting the bullish bias. 🟢
🔹 EMA 50: Currently sitting above the 4H candle, posing short-term resistance. 🔴
📉 Volume: Noticeable decline, showing market indecision – a common pre-breakout signal. 📊
📌 Key Pivot: A candle close above $94,021 would validate it as strong support. 🧱
📰 Positive Market Developments:
🏦 Morgan Stanley plans to offer spot BTC trading via E*Trade – institutional adoption accelerating. 📈
🏢 Strategy (MicroStrategy) signals further Bitcoin accumulation – corporate trust remains strong. 💼
💰 Over $1.8B flowed into U.S. BTC ETFs last week – investor appetite is growing rapidly. 🧲
📈 Analysts forecast BTC reaching $120K–$200K by end of 2025 – fueled by macro trends & halving cycle. 🌕
💡 Final Takeaway:
🔐 Bitcoin continues to prove itself as a valuable long-term asset, backed by rising institutional interest, robust on-chain fundamentals, and strong technical signals. 🌟
📊 Triggers for both long and short positions are clearly marked on the chart – stay sharp and manage risk! 🎯
I love you all so much . 👀
don't forget about capital management and risk management .
Be careful with your positions . 🥇

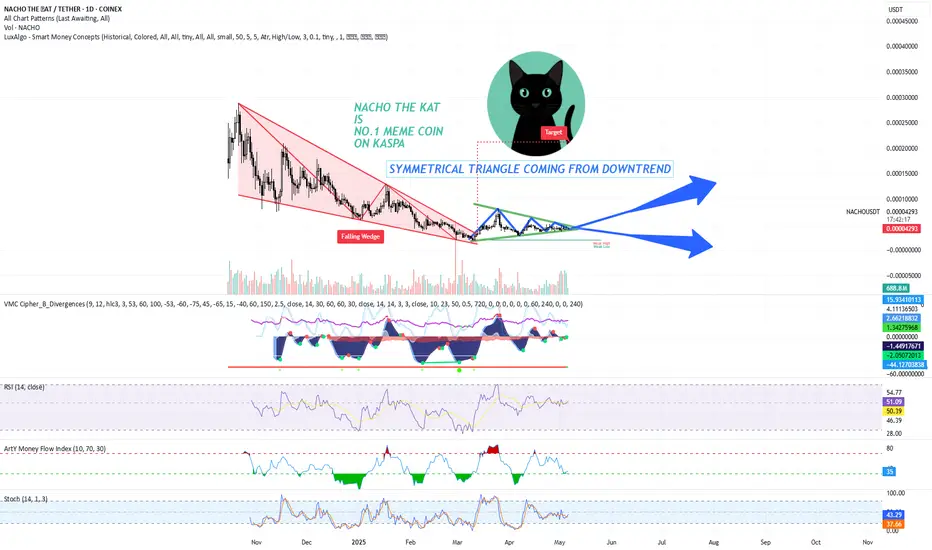
NO.1 MEME COIN ON KASPA IS NACHO THE KAT - DYORThe chart shows a symmetrical triangle pattern forming after a falling wedge. A falling wedge is typically seen as a bullish reversal pattern, indicating that the price may break out to the upside after the convergence of the trendlines. The symmetrical triangle, which is forming after the falling wedge, suggests consolidation before the breakout, likely pointing towards higher price action.
Key Points
Price Action and Trend:
NACHO has been in a downtrend, creating a falling wedge. The falling wedge has converging trendlines, which is a common setup for a bullish breakout.
Currently, the price is consolidating within a symmetrical triangle pattern, with lower highs and higher lows, indicating indecision in the market. The breakout from this triangle is likely to be significant, either continuing the previous downtrend or initiating a bullish reversal.
Volume Analysis:
The volume profile at the bottom shows an increase in volume as the price approaches the apex of the symmetrical triangle, suggesting potential strength behind the breakout.
It's important to monitor if volume increases further upon breakout to confirm the strength of the move.
Key Indicators:
RSI (Relative Strength Index): The RSI is currently around 50.39, suggesting a neutral market sentiment. The RSI has been ranging between oversold and overbought territories, which indicates that NACHO has not yet entered a strong trend but may be preparing for one.
Stochastic RSI: The Stochastic RSI is hovering around 37.57, showing a neutral stance, but it is closer to the oversold region, which could indicate that NACHO is near a potential reversal.
Money Flow Index (MFI): The MFI is at 35, indicating that the market is not yet in a strong buying or selling pressure zone. This shows that there is room for price movement based on volume.
VMC Cipher B Divergences: Positive divergence could suggest bullish momentum emerging, even if the price remains in consolidation.
Target and Resistance Levels:
If NACHO breaks out to the upside from the symmetrical triangle, the target is likely near the upper trendline of the wedge, which aligns with previous highs, possibly reaching the 0.00004500-0.00005000 USDT range.
Immediate resistance is near the 0.00004300 price level.
Support levels to watch are 0.00003000 and 0.00002000, which are key levels from previous price action.
Trading Plan
Entry Strategy:
Breakout Strategy: A strong breakout above the upper trendline of the symmetrical triangle would be a potential buy signal. If the price breaks and closes above 0.00004200, consider entering a long position with a target at 0.00004500-0.00005000.
Volume Confirmation: Ensure that the breakout is accompanied by an increase in volume. A low-volume breakout could be a false signal.
Stop-Loss Strategy:
Initial Stop-Loss: Place a stop-loss just below the symmetrical triangle's lower trendline or 0.00003000. This provides a reasonable distance to avoid being stopped out on small fluctuations.
Trailing Stop: As the price moves up towards your target, consider adjusting your stop-loss to lock in profits, especially if the price exceeds the 0.00004300 resistance level.
Take-Profit Strategy:
First Profit Target: Set a take-profit order around 0.00004500, the first resistance level. This is a key point based on the historical price action and previous swing highs.
Secondary Target: If the price breaks past 0.00004500, adjust the target to 0.00005000, which is the next logical resistance zone.
Risk Management:
Position Sizing: Risk no more than 1-2% of your total capital on this trade. For example, if your trading account is $5,000, you should risk no more than $100-$150 per trade.
Risk-Reward Ratio: Aim for a minimum 2:1 risk-to-reward ratio. For example, if you risk $150 on a trade, aim for a potential reward of $300 or more.
Additional Considerations:
Market Sentiment: As NACHO is a meme coin, market sentiment plays a huge role. Watch for social media trends and any news related to meme coins or Kaspa-based coins that could drive the price action.
Macro Conditions: Stay updated on the general market conditions for cryptocurrencies, as a broader downtrend in the market could limit the upside potential, even if technicals suggest a breakout.
NACHO THE KAT presents a technical setup with the potential for an upward move following a breakout from the symmetrical triangle. A close watch on volume and key price levels will be critical for confirming the breakout and determining the right moment for entry.
ENSUSDT Analysis D1ENSUSDT Following Setup Breakout,Retest Confirm Bouncing Expecting Solid Recovery In Coming Days .

BANANAUSDT Analysis D1BANANAUSDT Descending Trendline Has Already Got Cleared, Banana Can Give Solid Bullish Rally In Coming Days .

ARBUSDT Analysis D1ARBUSDT Descending Channel & Other Multiple Hurdles Has Already Got Cleared Arb Can Give Solid Bullish Rally In Coming Days


HIGHUSDT Analysis D1HIGHUSDT Already Broken Descending Broadening and started Recovery in D1 Chart
Continuity of momentum can see 80-120% Bullish Rally in Short-term .

HOTUSDT Analysis D1HOTUSDT Horizontal Resistance Breakout & Retest Confirmed, Now Holochain Need To Break Descending Channel To Lead Solid Recovery, Expecting 150% Rally After Successful Breakout

FILUSDT Analysis D1FILUSDT Looks Bullish So Far Falling Wedge Breakout, Retest Done, Horizontal Resistance Breakout, Retest Done, Another Trendline Breakout, Retest Done So Whats Next? In My Point Of View Rally Towards 5$ .

ETCUSDT Analysis D1ETCUSDT Trendline Breakout & Retest Has Already Confirmed, Currently Consolidating Within Bullish Pennant Once Pennant Got Cleared, Etc Can Lead Solid Recovery Towards 30-35$ In Coming Days .

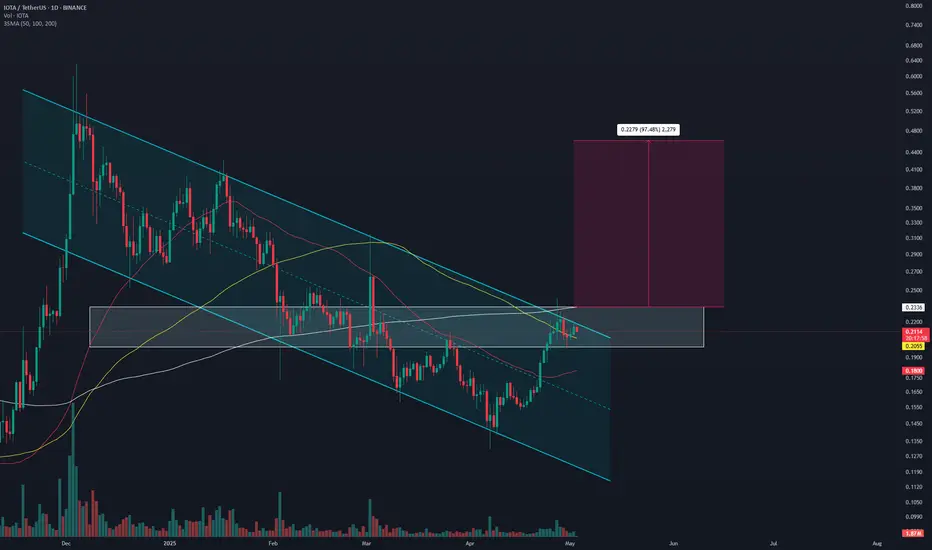
IOTAUSDT Analysis D1IOTAUSDT Seems Like Ready For Strong Bullish Rally, Breakout And Retest Has Already Confirmed, Expecting 2x In Coming Days .
Pullback's Almost Over — Get In Before It RunsThe best time to enter in a bull market is during a pullback — when price temporarily retraces before continuing its upward trend.
In the case of BINANCE:SUPERUSDT , price is currently pulling back into a demand zone between 0.7178 – 0.7109. The overall structure remains bullish, with the blue arrows showing a series of higher lows and the red arrows indicating higher highs.
We expect the price to bounce from this demand zone and potentially break the previous high, continuing the bullish trend.
To confirm the pullback is ending and a reversal is underway, we’ll watch for candlestick patterns. Here are two possible bullish confirmation scenarios:
Price breaks and closes above the high of the last red candle — a bullish engulfing setup.
Price dips deeper into the demand zone, then forms a bullish pattern such as:
Bullish Engulfing
Bullish Harami
Other reversal signals, like a close above the high of the previous two candles.
These are the scenarios I’m watching for on $SUPERUSDT.
Let me know your thoughts!

sand long longterm spot "🌟 Welcome to Golden Candle! 🌟
We're a team of 📈 passionate traders 📉 who love sharing our 🔍 technical analysis insights 🔎 with the TradingView community. 🌎
Our goal is to provide 💡 valuable perspectives 💡 on market trends and patterns, but 🚫 please note that our analyses are not intended as buy or sell recommendations. 🚫
Instead, they reflect our own 💭 personal attitudes and thoughts. 💭
Follow along and 📚 learn 📚 from our analyses! 📊💡"

Spotify (SPOT) – Sustainable Business Model Amid Tariff WarsKey Supporting Arguments
Spotify’s business model is resilient enough to rising tariff barriers between countries and economic downturns
Spotify and other music streaming platforms are undercapitalized and may demonstrate substantial growth in 2025, driven by increasing subscription prices.
Investment Thesis
Spotify (SPOT) stands as the world’s leading global audio streaming platform, boasting over 600 million active users, around 265 millions of whom are paying subscribers. The company’s primary revenue stream is derived from premium subscriptions, which constitute approximately 88% of its total revenue, with advertising revenue comprising the remaining 12%. This model offers the company relative stability amidst ongoing tariff tensions.
Amidst global economic instability and the threat of escalating trade wars, Spotify emerges as a safe haven for investors. Spotify’s audio streaming platform is not reliant on the supply of physical goods, rendering it immune to tariff barriers. The high entertainment value, the ingrained habit of daily usage, and the superior quality of the platform ensure a strong subscriber base, even during times of economic uncertainty. 88% of Spotify’s revenue is derived from paid subscribers, while advertising revenue accounts for only about 12%. This revenue structure makes the company more resilient to downturns in consumer demand and reduced advertising budgets. Approximately 40% of Spotify’s revenue is generated in the U.S. and 10% in the UK, with the remainder coming from other markets worldwide. This geographic diversification mitigates vulnerability to localized economic shocks.
The music streaming sector is undercapitalized. This industry is undergoing transformation. Initially, competition among music streaming platforms was centered on mass user acquisition, often keeping prices low to attract listeners away from piracy services. However, beginning in 2022 and through 2023, a wave of price increases was initiated by all major industry players, including Spotify, Apple, Amazon, and YouTube. As users have grown accustomed to paid subscriptions and their loyalty has increased due to enhanced user experiences, the cost of switching between platforms has risen substantially. This has empowered streaming services, particularly Spotify, to raise prices without experiencing significant audience loss. We anticipate that subscription price increases will be a primary driver of the company’s revenue and margin in 2025.
Our two-month price target for the SPOT stock is $650, with a “buy” rating. We recommend setting a stop-loss order at $500.

UNI — Time to Accumulate? A Clean Long-Term SetupUNI is the native token of the Uniswap DEX — and it's finally back in our interest zone.
After a brutal 70% correction from previous highs, price has retraced into a key accumulation range between $3.60 – $6.76.
This isn’t just another alt — UNI is a fundamental token that arguably deserves a place in every long-term portfolio.
Spot entry around $5.50 looks reasonable, with higher timeframe targets at $10.35, $17.03, and $19.47.
No overtrading here — just a clean long-term thesis. Accumulate, sit back, and let the narrative unfold.
More thoughts in my profile @93balaclava
Personally I trade on a platform that offers low fees and strong execution. DM me if you're interested.

Opportunity in PEPEUSDT PEPEUSDT has just broken its previous high and is attempting to retrace to the 0.00000665 - 0.00000656 range. This could present an opportunity to join the uptrend.
Price reversal confirmation >0.00000679.
Upside target 0.00000728 - 0.00000737.
Invalid level below 0.00000663
TradeCityPro | SUI: Analyzing the Shift from Hype to Stability👋 Welcome to TradeCity Pro!
In this analysis, I will review the SUI coin. This project gained significant hype in 2024 and experienced a substantial upward movement.
🔍 However, in the past few months, after reaching a price ceiling of 5.2689, it entered a corrective phase, and it can be said that its hype has completely dissipated and no longer carries much excitement.
📅 Daily Time Frame
As you can observe in the daily time frame, the price had a strong upward trend and, after breaking and pulling back to the 1.8392 area, it undertook the next upward leg up to 5.2689. During this movement, a severe divergence occurred in the RSI, which influenced the market when it was activated by breaking 50.
✔️ The upward movement accompanied by a trendline, was broken after being rejected from the 5.2689 area. The trigger for this trendline was the 4.0866 area, which was activated and confirmed the trend change after a pullback to this trigger and the break of the 3.6402 support.
🔽 Currently, after the break of 3.6402, a bearish trendline has formed, and the price has reacted to this area several times. Meanwhile, the price has also reacted to a significant support area around 1.8392. This area, actually a range between 1.6462 and 1.8392, is one of SUI's most crucial supports and could prevent further price drops.
✨ For the coin to become bullish again, the main trigger we have is breaking the bearish trendline, and I believe for buying in the spot market, the primary trigger will be breaking this trendline. There is also a significant resistance at 2.7830, which is the main trigger for breaking the trendline.
📈 If the price makes a lower high and low and breaks the support area it currently holds, the trendline trigger will shift to 2.2495, allowing us to enter earlier. A break of 50 in the RSI will also be a suitable trigger for entering a bullish momentum.
🛒 Alternatively, if you trade reactively, the price's reaction to this support area and breaking short-term resistances in lower time frames could be suitable for risky spot buying.
📊 Currently, the market volume has been more favorable to sellers, with volume increasing during price drops and decreasing during corrections, indicating the strength of the bearish trend. However, after the price reached the support area and reacted to it, we've seen two strong bullish candles with significant volume, which could be the first signs of a trend change.
📉 For the price to turn bearish and start the next bearish leg, as mentioned, breaking the support area and the 1.6462 trigger would be suitable, and in this case, the price could start the next bearish leg.
📝 Final Thoughts
This analysis reflects our opinions and is not financial advice.
Share your thoughts in the comments, and don’t forget to share this analysis with your friends! ❤️

SPOT Eiffel Tower CAUTION!This is a very simple setup of an Eiffel Tower pattern that should be respected. Bulls do not want to be long with this setup.
The Eiffel Tower patterns are rare, hence not much talked about or understood. But they are very powerful when the conditions are right.
CAUTION!!

#NOT #NOTUSDT #NOTCOIN #AMD #Analysis #Spot #Futures #Long #Eddy#NOT #NOTUSDT #NOTCOIN #AMD #Analysis #Spot #Futures #Long #Eddy
NOTUSDT.P Lower Time Frame "AMD" Analysis
Great opportunity to invest spot at a specified price.
To get confirmation, you need to be patient until the AMD structure is complete on the lower timeframe, first wait for the manipulation and then get confirmation of entry for buy trades, and follow the price during the distribution phase.
Important areas of the lower & higher time frame are identified and labled.
This Analysis is based on a combination of different styles, including the volume style with the ict style. (( AMD Analysis ))
Based on your strategy and style, get the necessary confirmations for this analysis to buy entery the trade.
Don't forget risk and capital management.
The entry point, take profit point are indicated on the chart along with their amount.
The responsibility for the transaction is yours and I have no responsibility for not observing your risk and capital management.
Note: The price can go much higher than the first target, and there is a possibility of a 300% & 1000% pump on this currency. By observing risk and capital management, obtaining the necessary approvals, and saving profits in the target, you can keep it for the pump.
Be successful and profitable.
(( This is a lower time frame AMD structure inside another higher time frame AMD structure. ))
Please Check NOTUSDT Higher Time Frame "AMD" Analysis from this link :
