$SPY & $SPX — Market-Moving Headlines Friday Feb 6, 2026🔮 AMEX:SPY & SP:SPX — Market-Moving Headlines Friday Feb 6, 2026
🌍 Market-Moving Themes
☁️ Cloud Confidence Restored
AMZN earnings reverse the AI capex panic as AWS profit growth proves spending is paying off
🚗 Legacy Auto Breakdown
Ford EV losses confirm widening gap between legacy automakers and Tesla as price wars intensify
📱 Ad Tech Surprise
SNAP earnings signal renewed advertiser demand and Gen Z engagement after years of stagnation
📊 Jobs Day Volatility
Non-Farm Payrolls set the tone for rates expectations, risk appetite, and end-of-week positioning
🛡️ Gold as Shock Absorber
Gold remains bid as hedge against both recession fear and inflation surprise from jobs data
📊 Key U.S. Economic Data Friday Feb 6 ET
8:30 AM
U.S. employment report Jan: 55,000
U.S. unemployment rate Jan: 4.4%
U.S. hourly wages Jan: 0.3%
Hourly wages YoY: 3.6%
10:00 AM
Consumer sentiment prelim Feb: 55.0
12:00 PM
Fed Vice Chair Philip Jefferson speaks
3:00 PM
Consumer credit Dec: $8.0B
⚠️ For informational purposes only. Not financial advice.
📌 #SPY #SPX #JobsReport #NFP #AMZN #AI #Cloud #Macro #Markets #Stocks #Options
SPX (S&P 500 Index)

SPX500: Bearish Drop to 6850?As the previous analysis worked exactly as predicted, FX:SPX500 is eyeing a bearish reversal on the 4-hour chart , with price testing a key resistance zone after lower highs, converging with a potential entry area that could trigger downside momentum if sellers defend amid recent volatility. This setup suggests a pullback opportunity in the uptrend, targeting lower support levels with more than 1:4 risk-reward .🔥
Entry between 7050–7080 for a short position (entry from current price with proper risk management is recommended). Target at 6850 . Set a stop loss at a daily close above 7100 , yielding a risk-reward ratio of more than 1:4 . Monitor for confirmation via a bearish candle close below entry with rising volume, leveraging the index's dynamics near resistance.🌟
Fundamentally , the S&P 500 closed just shy of a record high on February 2, 2026, up 0.5% to 6,976.44, driven by gains in chipmakers and small caps amid AI optimism. However, February historically poses risks, with waning momentum and potential 10% drops if reversals occur. Today's JOLTS Job Openings (Dec) at 8:00 AM ET (forecast 7.7M) could strengthen USD and pressure equities if robust, signaling resilient labor markets amid Fed caution. 💡
📝 Trade Setup
🎯 Entry (Short):
7050 – 7080
(Entry from current price is valid with proper risk & position sizing.)
🎯 Target:
• 6850
❌ Stop Loss:
• Daily close above 7100
⚖️ Risk-to-Reward:
• > 1:4
💡 Your view?
Is SPX500 setting up for a healthy pullback toward 6850, or will buyers absorb supply and push into new all-time highs above 7100? 👇

Whenever SP500 pullback, watch the old high as new support... Whenever stocks pull back, the key thing I would watch is whether the old high can hold as new support. This is one of the most consistent features of a healthy bull market, and the SPX chart illustrates this perfectly over multiple cycles. Each major advance eventually runs into a correction, often sharp and emotional, but as long as the prior breakout level holds, the broader trend remains intact.
Looking back, we can see several deep pullbacks that initially looked like trend reversals. In reality, they were corrective phases within a rising channel. Once price retested former resistance and buyers stepped back in, the market resumed higher, often with strong impulsive follow-through.
Well, the reason why I bring this chart on is because I see Dollar making some important recovery and if this strenght will resume, stocks can see a pullback, as more investors seems to be selling more and more assets and moving into cash. First was cryptos, then metals, and now just wondering if stocks are next. But 10-12% can be enough; we may not see 20% drop like before. Because always when market goes higehr and higher, pullbacks in % are smaller.
And one more thing, Trump will 100% try to defend any kind of a strong sell-off...
Be carefull, wait on better levels, then chasing new entries here.
GH

$SPY & $SPX — Market-Moving Headlines Thursday Feb 5, 2026🔮 AMEX:SPY & SP:SPX — Market-Moving Headlines Thursday Feb 5, 2026
🌍 Market-Moving Themes
🧠 AI Cost Reckoning
Big Tech spending fears intensify after GOOGL capex shock and AMD collapse, forcing markets to question AI profitability timelines
🏭 Hardware vs Software Divide
Capex-heavy AI buildouts favor chip and infrastructure suppliers while pressure mounts on software margins
💊 Healthcare Rotation Accelerates
LLY strength highlights capital rotation out of volatile Tech into durable growth healthcare
⚖️ Macro Crosscurrents
Weak ADP payrolls clash with strong services data, keeping recession and no-landing narratives in conflict
🛡️ Defensive Repositioning
Gold stabilizes as investors hedge against Tech volatility and labor market uncertainty
📊 Key U.S. Economic Data Thursday Feb 5 ET
8:30 AM
Initial jobless claims Jan 31: 212,000
delayed release due to shutdown
10:50 AM
Atlanta Fed President Raphael Bostic speaks
⚠️ For informational purposes only. Not financial advice.
📌 #SPY #SPX #AI #GOOGL #AMD #Macro #Jobs #Gold #Healthcare #Markets #Stocks #Options

USDT.D VS BTC With BTC testing April 2025 tariff war lows, many will be searching for the low/bottom of the move down.
The Tether dominance chart is often a good indicator of potential turning points in Bitcoins price. Looking at 2023 onwards which was roughly the end of the bear market and start of this bull market cycle, USDT dominance sat around 9% before a sharp drop to kick off the bull run.
Throughout the chart this pattern continues, with each high in USDT.D it means BTC puts in a relative low. However, the charts are not just opposites in that if USDT tops then BTC bottoms, the Tether chart is a clearly defined range compared to Bitcoins trending chart. It's because of the predictable nature of a range where price reacts at the extremes, the support and resistance areas can be estimated on the BTC chart.
Currently with BTC's price falling and testing April 2025 low, Tether has climbed and will soon be hitting the Bearish Orderblock/ origin of the October 2023 rally. For me that is a high probability area of resistance for USDT.D and so a potential bottom for BTC around $68,000.
IF that is to be the case Tether would be rangebound between grey and red zones with a relief rally from BTC being capped off by the grey zone, perhaps around $80,000.

SPX | Anchored VWAP Decision PointUS equities are seeing a familiar pattern: index-level softness driven largely by a renewed tech/AI repricing, rather than uniform downside across all sectors. That usually makes the tape choppier around key levels, because breadth can look “fine” while the index still drifts lower.
On the chart, SPX is playing around the anchored VWAP (~6,864) and struggling to build traction back above it. Price is also compressing inside the local rising channel, while momentum is cooling (RSI sub-50), which often turns VWAP into a proper inflection point rather than just a “nice line on the chart”.
Catalysts: Big-tech earnings sensitivity remains high, and any shift in rate / growth expectations (plus headline risk) can easily be the trigger for a VWAP break or a reclaim.
Takeaway: ~6,864 anchored VWAP is the decision point — above it the structure can stabilise, below it the chart starts to look like a clean pullback path towards the lower dashed channel.

$SPY & $SPX — Market-Moving Headlines Wednesday Feb 4, 2026🔮 AMEX:SPY & SP:SPX — Market-Moving Headlines Wednesday Feb 4, 2026
🌍 Market-Moving Themes
🧠 AI Reversal Setup
AMD earnings confirm AI chip demand is accelerating, resetting sentiment for NVDA AVGO MU and the broader semi complex
📉 Tech Shakeout Exhaustion
Tuesday’s Nasdaq selloff looks like a leverage flush ahead of real earnings confirmation rather than a trend break
💰 Inflation Hedge Resilience
Gold and Silver rebound sharply, signaling investors are not abandoning inflation protection despite recent liquidation
👷 Labor Market Stability
Steady job openings and ADP data reinforce the no-landing narrative heading into Friday’s payrolls
🏦 Fed Noise Returns
Lisa Cook remarks late in the day could reintroduce rate volatility after markets ignored recent Fed warnings
📊 Key U.S. Economic Data Wednesday Feb 4 ET
8:15 AM
ADP employment Jan: 45,000
9:45 AM
S&P final U.S. services PMI Jan: 52.5
10:00 AM
ISM services Jan: 53.5%
6:30 PM
Fed Governor Lisa Cook speaks
⚠️ For informational purposes only. Not financial advice.
📌 #SPY #SPX #AMD #NVDA #AI #ISM #ADP #Macro #Earnings #Stocks #Options

US Job Openings (JOLTS) vs S&P 500: 2026 Divergence PersistsUS Job Openings (JOLTS) vs S&P 500: 2026 Divergence Persists: AI Boom or Recession Warning? 📉🤖
Description:
The historical correlation between US job openings (from JOLTS data) and the S&P 500 has broken down dramatically since late 2022, and as of early 2026, the gap is widening. This chart overlay highlights a key macro divergence that traders should monitor closely for potential market shifts. 📊
Chart Setup on TradingView:
1. Start with the S&P 500 index: Search for "SPX" or "SP:SPX" as your main symbol. 🔍
2. Add a comparison: Go to "Compare" in the chart menu, search for "FRED:JTSJOL" (Job Openings: Total Nonfarm, sourced from Federal Reserve Economic Data). ➕
3. Normalize for better visualization: Use percentage change from a baseline (e.g., November 2022) or index both to 100 at a common point. ⚖️
4. Timeframe: Monthly or weekly for longterm view; add a vertical line at November 30, 2022 (ChatGPT release date) to mark the divergence start. 📅
5. Optional indicators: Add RSI on SPX for overbought signals, or correlate with unemployment rate (FRED:UNRATE) for additional context. 📈
Key Data Points (as of February 3, 2026):
| Metric | Value | Change from Peak/Recent |
| Latest Job Openings (Nov 2025) | 7.146 million | 41% drop from peak of 12.134 million (Mar 2022) |
| S&P 500 Close (Feb 3, 2026) | 6,907.41 | +44% from Nov 2022 levels (~4,800), hitting new highs |
| Job Openings Rate | 4.3% | Down from 7.3% peak in 2022 |
| Historical Correlation (pre2023) | ~0.85 (strong positive) | Now near 0, indicating decoupling |
Analysis & Context:
Historical Trend: Job openings have traditionally mirrored stock market performance, as a tight labor market signals economic strength, boosting corporate earnings and investor confidence. From 20002022, the two moved in tandem through booms and busts (e.g., post2008 recovery). 📜
The Divergence : Starting around late 2022, coinciding with the public release of ChatGPT and the AI hype cycle, job openings began trending downward while the S&P 500 surged. Openings have fallen steadily (e.g., 303,000 drop in Nov 2025 alone), driven by sectors like accommodation/food services (148,000 drop) and transportation (108,000 drop), offset partially by gains in construction (+90,000). 🔻
Potential Causes:
AI Productivity Gains: Companies are leveraging AI tools to automate tasks, reducing the need for new hires while maintaining output. This "productivity paradox" allows earnings growth without labor expansion. 🤖💼
Economic Softening : Quits rate steady at ~2.0% and layoffs at 1.7 million suggest a cooling but not collapsing job market. However, if this persists, it could foreshadow weaker consumer spending. ❄️
Fed Policy & Inflation : With rates stabilizing, markets are pricing in growth, but labor data lags, creating a mismatch. 💰
Implications for the Economy : Bullish view: This is a "soft landing" where AI drives efficiency, supporting higher valuations. Bearish view: Divergences like this have preceded recessions (e.g., 2000 dotcom bust). If openings drop below 7 million, it might signal broader weakness, pressuring megacap tech stocks that have driven SPX gains. ⚠️
Actionable Insights for Traders:
ShortTerm : Watch tomorrow's JOLTS release (Feb 4, 2026) for December 2025 data: consensus expects ~7.23 million. A miss below 7.1M could trigger SPX pullback; consider shorting via SPY puts if it breaks 6,850 support. ⏰
MediumTerm Strategy : If divergence widens (openings <6.5M by mid2026), rotate from growth stocks to defensives (e.g., utilities, consumer staples). Target SPX upside resistance at 7,000; downside support at 6,800 (50day MA). 🔄
Risk Management : Use this as a macro overlay: pair with VIX for volatility spikes. Set alerts on TradingView for JOLTS updates via FRED integration. 🛡️
Trade Idea : Long SPX if openings stabilize above 7M (bullish confirmation); hedge with VIX calls if below. Position size: 12% risk per trade. 💡
What do you think: bullish on AI or bearish on labor? Share your views below! 🗣️
#SPX #JOLTS #Economy #AI #Trading

S&P Wheel Spinning Around Fibo 161. End Of TrendLast time I’ve published about the S&P was in mid November, 2025 mentioning higher time frames like the weekly and the monthly charts. And I was expecting a downtrend to start in January (I know, we are in February), I’ve even mentioned to a couple of friends. Though I remind you that the Stoch RSI on the monthly chart has crossed downwards as expected.
I’ve also mentioned before that every financial report is expecting a recession mid 2026 and if everybody is expecting and declaring the same thing, either it doesn’t happen or it happens earlier by another reason. I might be wrong but I’m publishing what I’m observing and seeing on the charts.
As you know, these time frames take a bit time to form. And as we see on the daily chart, the bars on are struggling around Fibonacci 161 level. An indicator that we have reached the end of the trend. And the RSI is having a huge negative divergence which is kind of scary.
In addition, Nvdia cannot move upwards and having a similar appearance - which is like a Wycoff distribution. And Bitcoin is another thing to pay attention to. It’s being beaten up bad. I was expecting Btc to go as low as 74,000 level but seems like it will bounce and go lower than this for another round. (Possible to go as low as 45-50,000 level.) Bitcoin moves first (either way), the stock market follows. All of these might turn out to be wrong but time will tell.

S&P500 Channel Down pulling back to the 1D MA100.The S&P500 index (SPX) has been trading within a 2-month Channel Up and despite yesterday's strong recovery on a 1D MA50 (blue trend-line) rebound, the price is correcting equally aggressively today.
That is technically part of the pattern's new Bearish Leg. With the previous two Legs hitting their respective 0.786 Fibonacci retracement levels, we expect the current one not to diverge and target 6835. That would be just above the 1D MA100 (green trend-line), which is technically the Support that distinguishes the long-term bullish trend from the bearish.
Notice also that last week's Top coincided with the 1D RSI getting rejected on its 4-month Lower Highs trend-line. A strong long-term Bearish Divergence indeed.
---
** Please LIKE 👍, FOLLOW ✅, SHARE 🙌 and COMMENT ✍ if you enjoy this idea! Also share your ideas and charts in the comments section below! This is best way to keep it relevant, support us, keep the content here free and allow the idea to reach as many people as possible. **
---
💸💸💸💸💸💸
👇 👇 👇 👇 👇 👇

Day 101 — Blowing 5 Accounts: The "Storm" That Never CameEnded the day -$1,264.56 per account... a grim start to February. After an 8-day win streak last month, I had this nagging feeling that a "storm" was coming to hit my accounts, and today that self-fulfilling prophecy came true. I took what I thought was a high-probability trade at the 97 MOB, but the market didn't care—it broke right through and kept running. Between Friday and today, I’ve lost about 5 accounts. While the payouts year-to-date are still solid, the real cost here is the time lost building those accounts. Now, the grind to regrow the farm begins.
Day 101— Trading Only S&P 500 Futures
Daily P/L: -$1264.56
Sleep: 5 hours
Well-Being: Good
🔔News Highlights: *DOW NOTCHES BEST DAY IN NEARLY TWO WEEKS AS FEBRUARY BEGINS ON A STRONG NOTE
📈Key Levels for Tomorrow:
Above 6985= Bullish Level
Below 6980 = Bearish Level

$SPY & $SPX — Market-Moving Headlines Tuesday Feb 3, 2026🔮 AMEX:SPY & SP:SPX — Market-Moving Headlines Tuesday Feb 3, 2026
🌍 Market-Moving Themes
🧠 AI Earnings Reset
PLTR blowout restores confidence in enterprise AI demand with read-through to AI SOUN and broader software
🏭 Manufacturing Re-Acceleration
Strong ISM manufacturing confirms expansion and shifts narrative away from recession fears toward real-economy growth
💾 Memory Supply Crunch
Rotation continues from compute into storage as SNDK MU and WDC benefit from AI data bottlenecks
💰 Anti-Fiat Stabilization
Gold and crypto attempt to base after forced liquidation as markets digest Kevin Warsh Fed Chair nomination
📉 Dip-Buying Psychology
Equities absorb weekend panic as capital rotates out of crowded hedges and back into stocks
📊 Key U.S. Economic Data Tuesday Feb 3 ET
9:45 AM
- S&P final U.S. services PMI Jan: 52.5
10:00 AM
- Job openings JOLTS Dec: 7.1 million
- ISM services Jan: 53.5%
⚠️ Disclaimer: For informational purposes only. Not financial advice.
📌 #SPY #SPX #PLTR #AI #ISM #JOLTS #Macro #Earnings #Stocks #Options

SPX: AI spending shakes techThe previous week has been a volatile one, with respect to all uncertainties surrounding markets and hence, increased nervousness. Fed officials decided to keep interest rates unchanged at the FOMC Meeting, which was strongly expected. The US President announced on Friday that he is proposing Kevin Walsh as the new Fed Chair in May this year. This information was well perceived by markets, considering previous worries regarding the future independence of the Fed from political interference. Still, markets continued to trade with a negative sentiment, where the S & P 500 reached 7K as the new ATH, but tumbled down to 6.893. The index is closing the month at 6.939.
The previous week brought the majority of earning reports for tech companies, as well as industrials, finance, energy and consumer sectors, like IBM, AT&T, Visa, Mastercard, Exxon Mobil and others. The overall theme for investors was evaluation of how AI capital spending translates into profit growth. Strong earnings came from Meta, Apple, Verizon, and energy stocks. However, the huge weekly surprise came from Microsoft. Although the company reported solid quarterly results, still investors' concerns over Microsoft's slowing cloud growth and heavy AI capital spending dropped the value of its shares by some 12%. This was one of the worst days for MSFT during the last several years.
The week ahead also brings quarterly results of some big names in tech and pharma industries like Alphabet (Google), Amazon, Elly Lilly, Pfizer. On a macro level, the week ahead brings US jobs data, where JOLTs and Unemployment rate in December will be posted. Some volatility might be triggered again.


Is the S&P 500 in distribution right now?Is the S&P 500 showing signs of distribution? If the 6,850 support breaks, things could get ugly, with a potential move toward 6,100. If 6,850 holds, we may see another leg higher.

SPX500 | Risk Sentiment Weakens After Precious Metals SelloffSPX500 | Pressure Builds as Precious Metals Selloff Shakes Risk Appetite
U.S. stock index futures moved lower as a violent selloff in precious metals unsettled investor sentiment at the start of a week packed with corporate earnings and key economic data. The abrupt reversal in metals has raised broader risk concerns, keeping equity markets cautious ahead of major catalysts.
With volatility elevated, traders are focusing on technical confirmation for the next directional move.
Technical Outlook
The index continues to trade below the 6918 pivot, maintaining a bearish structure.
As long as price remains below 6918, downside pressure is expected toward 6877.
A break below 6877 would confirm bearish continuation, exposing further downside toward 6845, followed by 6798.
On the upside, a 4H candle close above 6918 would invalidate the bearish bias and support a recovery toward 6941, with further upside toward 6988.
Key Levels
• Pivot: 6918
• Support: 6877 – 6845 – 6798
• Resistance: 6941 – 6988

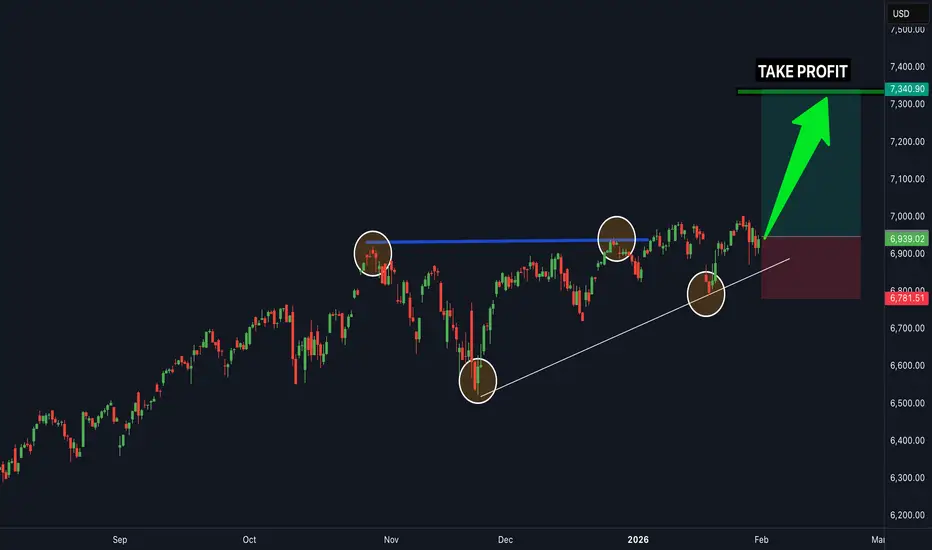
SPX.. buy nowSPX 500 is in a clear upwards channel and has broken the last bit of resistance (white trendline line shown) - this is a clear confirmation that the next target will be the next resistance zone to the upside shown above (this is a great buy trade opportunity) - buy SPX 500 now...
02/02/26 Weekly OutlookLast weeks high: $90,610.47
Last weeks low: $75,706.32
Midpoint: $83,158.39
With January of the new year wrapped up it's been quite the opening month for Bitcoin and the broader market in general.
The loss of the yearly open ($87,500) confirmed the bears remain in control and as such, with the help of an enormous crash in metals, pushed Bitcoins price back towards 2025's Yearly low of $74,500. Now in the early hours of the weekly open that exact level has been traded with a perfect double bottom on the HTF chart. Does this mean BTC is now safe to move back up?
A relief bounce may be on the cards from here, my targets would be the inefficiency zones at 0.25 ($80,000) and if the bounce has real backing maybe $86,000. However I am not yet satisfied that the April Low has been effectively traded just yet...
For more confirmation of a bottom being in I would like to see the demand zone swept with sellers continuing to pour in but buyers soaking up the volume resulting in very little price movement. In effect this would be forced sellers (liquidations) moving their BTC to high conviction buyers in the market. I am not yet satisfied that we have had this play out.
The fear and greed index sits at 14, the same score as the Covid crash but interestingly it's a higher score than the sell-off in November of last year at a score of 11. This gives us an interesting divergence similar to that of the end of the bear market in 2022. It's also significantly lower than the April low of last year at a score of 24.
This week is about seeing where/if BTC finds strength, with BTC strength alts will follow. Also Tradfi and specifically the metals market is something to keep a eye on. It's not everyday an asset loses $4T in value in 3 days like silver did!

Is the US500 About to Really Tank or Is This Just a Quick Flush?US500 Indices A Roadmap for Gold and Currencies 🧐 The market is at a critical "make or break" point that will dictate the direction of Gold, Bitcoin, and major currency pairs for the coming weeks.
In this deep-dive technical analysis, we break down the current US500 (S&P 500) structure to identify institutional "Smart Money" levels. Whether you trade indices, commodities, or Forex, understanding this roadmap is essential for navigating the current precarious "Risk-Off" environment.
Key Takeaways:
📍 Institutional Levels: Identifying the "Point of Control" where big money is stacking orders.
🕯️ Price Action Signals: Why recent weekly pin bars are signaling a momentum shift.
💰 Liquidity Flushes: How to spot the early-year "traps" designed to hit over-leveraged traders.
🌍 Market Correlations: The direct impact of US500 movement on Gold (XAUUSD) and safe-haven currencies like the Swiss Franc (CHF).
📉 Risk Management: Why "sitting on your hands" is currently the most profitable trade - it protects your capital!

$SPY & $SPX — Market-Moving Headlines Week of Feb 2–6, 2026🔮 AMEX:SPY & SP:SPX — Market-Moving Headlines Week of Feb 2–6, 2026
🌍 Market-Moving Themes
💥 Anti-Fiat Unwind
Gold, Silver, and Crypto suffer forced liquidation as capital rotates out of crowded hedges
🧠 AI Earnings Take Center Stage
GOOGL, AMZN, PLTR headline a second straight AI earnings stress test week
🏭 Manufacturing vs Services Split
Weak manufacturing data contrasts with resilient services, complicating the growth narrative
👷 Labor Market Reality Check
ADP, Jobless Claims, and Friday’s Jobs Report will drive Fed cut expectations
🌏 Emerging Market Pressure
India budget selloff highlights fragility across EM, raising spillover risk to EEM
📅 Post-FOMC Re-Pricing
Markets digest last week’s Fed tone through hard data instead of rhetoric
📊 Key U.S. Economic Data — Feb 2 to Feb 6 (ET)
MONDAY, FEB. 2
- TBA Auto sales Jan | Previous: 16.1M
- 9:45 AM S&P flash U.S. manufacturing PMI Jan | Previous: 51.9
- 10:00 AM ISM manufacturing Jan | Actual: 48.4 | Forecast: 47.9
TUESDAY, FEB. 3
- 9:45 AM S&P final U.S. services PMI Jan | Previous: 52.5
- 10:00 AM Job openings Dec | Actual: 7.1M | Previous: 7.1M
- 10:00 AM ISM services Jan | Actual: 53.5 | Previous: 54.4
WEDNESDAY, FEB. 4
- 8:15 AM ADP employment Jan | Actual: 45K | Forecast: 41K
THURSDAY, FEB. 5
- 8:30 AM Initial jobless claims Jan 31 | Actual: 212K | Previous: 209K
- 10:50 AM Atlanta Fed President Raphael Bostic speaks
FRIDAY, FEB. 6
- 8:30 AM U.S. employment report Jan | Actual: 55K | Forecast: 50K
- 8:30 AM U.S. unemployment rate Jan | Actual: 4.4% | Previous: 4.4%
- 8:30 AM U.S. hourly wages Jan | Actual: 0.3% | Previous: 0.3%
- 8:30 AM Hourly wages YoY | Actual: 3.6% | Previous: 3.8%
- 10:00 AM Consumer sentiment prelim Feb | Actual: 54.0 | Previous: 56.4
- 3:00 PM Consumer credit | Actual: $8.0B | Previous: $4.2B
⚠️ Disclaimer: For informational purposes only. Not financial advice.
📌 #SPY #SPX #Macro #JobsReport #NFP #Earnings #AI #Crypto #Gold #Markets #Options

Markets 2026Let’s take a look at the charts of the DAX, Nikkei 225, and S&P 500 and evaluate the current situation from a technical perspective - the following picture emerges:
Germany - DAX
The structure looks very clean, with targets across multiple timeframes aligning well with each other.
We are forming wave 5 , and within it, the fifth sub-wave has already started.
Potential target: 29,300
Japan - Nikkei 225
The market is completing a large fifth wave, with expectations for price to move above 58,000 .
USA - S&P 500
Not long ago, the index reached a new high at 7,000 .
Further upside could take the index to 7,200 .
The common trend across the DAX, Nikkei 225, and S&P 500 is clear:
markets are making new highs and completing their final waves.
However, growth is not infinite. 2026 may become the year when trend reversals begin to emerge.
Fundamental Perspective
From a fundamental standpoint, the global economy is facing multiple unresolved structural issues:
Germany
Lack of cheap energy
Declining industrial production
Heavy dependence on exports
Japan
Demographic crisis
Rising rates / expensive credit
Deflation and persistently weak inflation
United States
Bubble risks in AI and Big Tech
Fragile consumer sector
High leverage in both corporate and consumer sectors
This is only a short list of problems in the real economy.
If we look at China or almost any country within the European Union, we see a very similar picture.
In addition, the global political environment remains highly unstable:
Escalations and new conflicts
Restructuring of the global financial system
Trade wars and sanctions
All of this, combined with the massive Japanese yen carry trade, could create a domino effect across global markets.
Conclusion
What this analysis aims to highlight is simple:
We are entering a period of increased uncertainty and challenging market conditions.
These conditions may be difficult for long-term investing, but they can also create more opportunities for active traders.
Act with caution - and good luck with your trades.

S&P 500: Institutional Demand Zones vs. Macro HeadwindsS&P 500 (SPCFD) Strategic Market Analysis – 4H Timeframe
1. Market Structure & Price Action Overview
The S&P 500 is currently exhibiting a high-level consolidation within a dominant bullish trend. The price action at these peaks suggests a strategic liquidity engineering phase, where the market is balancing before its next directional expansion.
2. Key Liquidity Pools & Demand Zones
The technical map identifies two primary zones of institutional interest:
Sell-Side Liquidity (SSL) Target (6,789.05): This level represents the immediate swing low where retail stop-losses are likely clustered. An institutional "sweep" below this level would likely serve as the catalyst for the next leg up, providing the necessary liquidity to fill large buy orders.
Primary Interest Zone ($6,700 - $6,740): This marked demand block aligns with a "Discount" pricing array. This is the first high-probability area where institutional accumulation is expected to resume.
Extreme Discount/HTF Support ($6,520 - $6,550): This lower boundary serves as the "line in the sand" for the current bullish structure. Maintaining this level is vital for the long-term integrity of the uptrend.
3. Momentum & Volume Distribution Analysis
Williams %R: Currently hovering in the neutral territory (−48.11), confirming the lack of immediate directional conviction. A dip into the oversold region (below −80) followed by a sharp recovery would be a classic trigger for a long entry.
Accumulation/Distribution (A/D): The curve remains resilient at 195.75B. The lack of a sharp divergence suggests that while the price is stalling, major players are not aggressively offloading positions, supporting a "buy-the-dip" thesis.
4. Institutional Executive Summary
Market Bias: Neutral-Bullish. While the macro trend is intact, the micro-structure favors a corrective move to tap into liquidity before further upside.
Strategic Execution Note:
"Patience is advised until the 6,789 liquidity pool is neutralized. A successful sweep of this level, coupled with a bullish rejection in the 6,740 demand zone, would offer a High-Probability Long Setup. Risk parity should be maintained, eyeing a move back toward the previous highs and beyond."
⚠️ STRATEGIC WARNING: High-Volatility Window
The market is currently entering a high-impact zone. While the technical structure remains bullish on a Higher Timeframe (HTF), the price is stalling at premium levels. We are expecting a liquidity-driven correction before the next sustainable expansion. Do not chase the current highs; wait for the "smart money" footprint.

S&P 500 Almost thereIn my opinion the SPX is following the Japanese Nikkei index. After the blow-off top we will see a deep retracement to 1.800-3.000$ which will take a whole decade or even longer.
I will keep updating my predictions in the future.
