Hellena | SPX500 (4H): LONG to resistance area of 7010.Colleagues, I expect the upward movement in the medium-term wave “1” to continue.
The minor wave “3” should still be developing, and I expect a repeat update of the high of the higher-order wave “3” (6929.4).
I consider the 7010 area to be the nearest target. If we calculate using Fibonacci expansion, the target is higher, but I always play it safe and take the nearest targets.
Manage your capital correctly and competently! Only enter trades based on reliable patterns!
S&P 500 (SPX500)

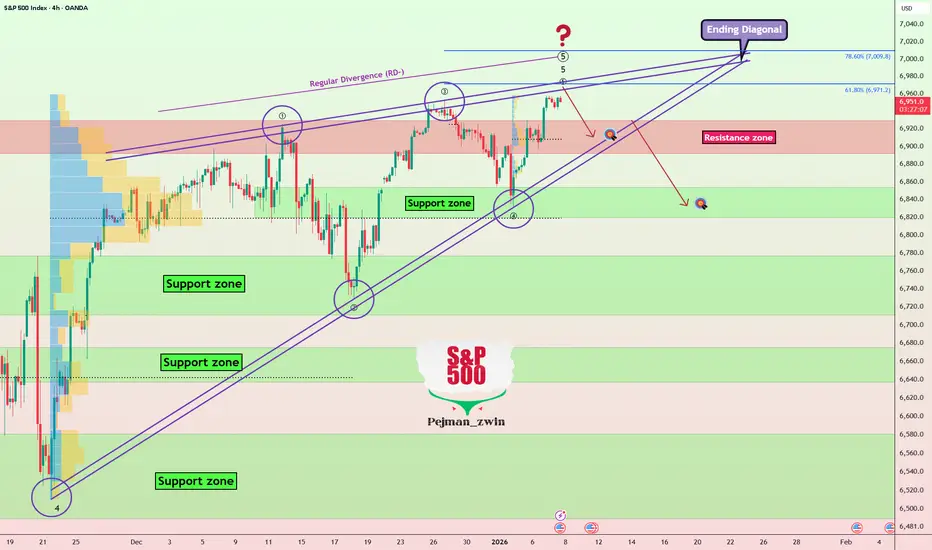
S&P 500 Makes New ATH — Is This a Fake Breakout?As I expected in the previous idea , the S&P 500 Index( FX:SPX500 ) reached its targets, with a risk-to-reward ratio of 1:67.
The S&P 500 has managed to set new all-time highs as we entered 2026. The question now is whether the S&P 500 will continue its bullish trend throughout 2026 or if we should anticipate a correction in the U.S. stock market.
It’s important to note that the S&P 500 is a key index for the markets, and its correlation with Bitcoin( BINANCE:BTCUSDT ) is quite high. Therefore, it’s always beneficial to keep an eye on the S&P 500 when analyzing the crypto market, especially Bitcoin.
Currently, the S&P 500 seems to be trading above the resistance zone($6,930_$6,892). However, considering the volume of this breakout, it doesn’t seem like a very convincing breakout.
From an Elliott Wave perspective, we might expect the main wave 5 of the S&P 500 to conclude with the help of an ending diagonal, and this wave 5 could complete near the upper lines of the ending diagonal.
I expect that the S&P 500 may decline at least to around $6,917, and if it breaks back below the resistance zone and the lower lines of the ending diagonal, we could see further declines to around $6,837 or even lower, leading to a downturn in the U.S. stock market.
Note: It’s worth noting that rising tensions in global affairs could also pose a risk to the S&P 500, potentially causing abrupt declines.
First Target: $6,917
Second Target: $6,837
Stop Loss(SL): $6,988
💡 Please respect each other's opinions and express agreement or disagreement politely.
📌S&P 500 Index Analyze (SPX500USD), 4-hour time frame.
🛑 Always set a Stop Loss(SL) for every position you open.
✅ This is just my idea; I’d love to see your thoughts too!
🔥 If you find it helpful, please BOOST this post and share it with your friends.
S&P500 Index Guess for 2026 Using Wall Street Ests
S&P 500 Index
19 hours ago
S&P500 Index Guess for 2026 Using Wall Street Ests
1
1
Grab this chart
256
19 hours ago
Wall Street each January makes an estimate for the year ahead S&P500 Index, the largest index used for indexing returns and for managing capital. It's a fascinating practice to take a 'snapshot' of the mentality of the collective wisdom of Wall Street brokerage firms. These are the top 12 brokers in the US which guide portfolio managers globally.
I included the long term average of 9%-10% as a reference so you can see that in 2025 Wall Street was bullish and clustered right around the average return as shown by the cluster of black rectangles. Oddly, the previous year estimates seem to have a "value support" function too where the market held on the pullback in the first quarter of 2025 at the level of the 2024 guesses. See for yourself how this worked in 2025.
You can also see that the cluster of guesses around 6600 in the SPX created multiple rounds of volatility in the fall of 2025 as the market ran into selling at the "common guess level". This turbulence could have been the result of people either raising cash or rotating from growth to value stocks in the 3rd-4th quarter.
So, on initial glance for 2026, I think the mid-term elections will have the most impact on the market and the uncertainty will cause sideways action through the year and finish with a sub-average, but positive year. IF we go under 6400, then I could see the market head down to 6200-6000 where I had seen it for last year.
Either way, stay tuned as I update this "guess" along the way as I have done in years past. Overall, the batting average is quite good, but decide for yourself.
Wishing you all a healthy and successful 2026!
Tim West
January 6, 2026 2:16PM EST
(hidden since yesterday due to additional scripts accidentally left on the chart hidden)

ES (SPX, SPY) Fundamental Analysis for Wed Jan 7As we head into Wednesday's session, the S&P 500 E-mini futures are testing significant resistance at the prior day's highs, reflecting a strong rebound from the lows observed last week. The current market landscape is marked by various challenges, including a divided Federal Reserve, softening labor data, and emerging geopolitical tensions, particularly related to U.S. military actions in Venezuela.
The Federal Reserve is maintaining its interest rates at the 3.50%-3.75% range after a 25 basis point cut in December. Internal divisions within the Fed have become increasingly apparent, with some members advocating for more substantial cuts while others are in favor of holding rates steady. Currently, the market assigns roughly a 15% chance of a rate cut in January, with the next Federal Open Market Committee (FOMC) meeting scheduled for January 27-28.
The minutes from December's meeting revealed growing concerns over short-term funding stress and the potential for abrupt market volatility, spurring discussions regarding the possibility of Treasury purchases to enhance liquidity in the financial system.
Data Catalyst Update
ADP Employment Change (Released at 8:15 AM ET)
- Actual: +41K
- Forecast: +50K
- Previous: -32K
Today's ADP Employment change shows a modest miss, reflecting a labor market that is recovering yet remains soft. While this figure is an improvement from November's contraction, it falls short of expectations. This outcome supports the view of a gradual cooling in the labor market without signaling an imminent recession. The reading is mildly dovish for the Federal Reserve's policy stance and offers limited directional clarity ahead of Friday's Non-Farm Payrolls report.
ISM Services PMI (Scheduled for 10:00 AM ET)
- Forecast: ~53.0
- Previous: 52.6
The ISM Services PMI is the key market-moving release of the day. Given that the services sector accounts for approximately 70% of U.S. economic activity, the implications of this report are significant. A reading below 50 would indicate contraction and likely trigger risk-off sentiment in the markets. Conversely, a robust reading above 54 could reignite concerns about hawkish Fed policies, putting pressure on equities. The ideal scenario for market bulls would be a print that comes in line with expectations or slightly soft, thereby sustaining the narrative of a "soft landing."
Additional Releases of Note:
- Factory Orders (10:00 AM): Expected -1.2%
- JOLTS Job Openings (10:00 AM): Expected 7.64M, down from prior 7.67M
- Fed Vice Chair Bowman to speak at 4:10 PM
LABOR MARKET CONTEXT
In the last week of 2025, initial jobless claims fell to 199,000, marking the lowest level since early last year. This decline indicates a resilient labor market, even as the unemployment rate has risen to 4.6% in November—the highest rate since September 2021. This uptick can be attributed primarily to federal workforce reductions linked to ongoing government restructuring efforts.
Overall, the labor market appears stable, characterized by low hiring and equally low firing rates. Continuing claims have increased to 1.92 million, underscoring the reality that although layoffs have remained subdued, job seekers are facing extended search periods. The upcoming Non-Farm Payroll (NFP) report, with a forecast of approximately 55,000 new jobs, will offer crucial insights into the employment landscape for December.
GEOPOLITICAL RISK
The recent U.S. capture of Venezuelan President Nicolás Maduro has injected a new layer of uncertainty into the geopolitical landscape. In the wake of this development, Washington has announced plans to take temporary control of Venezuela while facilitating the involvement of U.S. energy firms in the exploration and development of the country’s vast oil reserves—the largest in the world. This situation has led to a modest uptick in demand for the dollar as a safe haven, while simultaneously increasing volatility within energy markets.
From an equities perspective, this scenario presents a short-term challenge as investors grapple with the implications of U.S. access to Venezuelan oil. However, should this development result in a significant increase in oil supply, it could ultimately have disinflationary effects.
CURRENCY & RATES
The EUR/USD exchange rate has retraced to the 1.1685-1.1700 range after failing to maintain momentum above the 1.1800 threshold. While the dollar is finding some support driven by geopolitical flows, it remains fundamentally weak in light of expectations for Federal Reserve easing. The DXY index is currently hovering around 98.25, notably below the recent high of 100.40.
On the European front, German inflation has come in at 1.8%, marking the first dip below the European Central Bank’s 2% target since September 2024. This development effectively reduces the likelihood of any near-term ECB interest rate hikes, maintaining the narrative of policy divergence between the ECB and other central banks.
In the bond markets, a rally occurred overnight as yields fell, reflecting a shift in investor risk positioning as they look ahead to 2026.
Market Structure Analysis
ES futures closed Tuesday at 6,988.25, marking a notable rebound from Monday's low of 6,931. This upward movement has brought prices near key resistance levels established in the prior week and quarter, specifically between 6,991 and 6,995. This zone represents a significant confluence of resistance.
While daily oscillators indicate elevated levels, they do not yet reach extremes, allowing for the possibility of continued upward momentum should this resistance be surpassed. The overarching trend remains bullish, underscored by a series of higher highs since the lows observed in October. However, an analysis of the 4-hour and 1-hour timeframes reveals overbought conditions, which typically signal a need for consolidation or a potential pullback.
Market Outlook: Neutral-to-Bullish with Anticipated Pullback
The current macroeconomic landscape favors equities, as the Federal Reserve adopts a more accommodative stance, inflationary pressures appear to be easing, and while the labor market remains stable, signs of cooling are evident. However, market positioning has grown extended near resistance levels, and the upcoming ISM report introduces potential volatility.
From a bullish perspective, an ideal scenario would see a quick dip in response to the ISM data, targeting the 6,960-6,970 support zone. Such a pullback could facilitate institutional buying before the market resumes its upward trajectory. A sustained move above 6,995 would pave the way toward the psychologically significant 7,000 mark and possibly higher.
Key Risk Factors to Watch:
- A surprisingly strong ISM reading (greater than 55) could reignite hawkish concerns from the Fed.
- Ongoing tensions in Venezuela could introduce additional market uncertainties.
- Pre-NFP positioning may lead to increased market volatility and choppy trading conditions.
Bottom Line
Today's market outlook is largely shaped by the upcoming 10:00 AM release of the ISM Services index, which is expected to bring significant volatility. The recent ADP employment report, which fell short of expectations, did not stir up much reaction, leading to a market that remains in a cautionary holding pattern around key resistance levels.
Traders should be watchful for potential trading opportunities, particularly during any pullbacks to the value-area support. Current higher-timeframe trends suggest a preference for buying on dips rather than pursuing breakouts at these elevated levels.
Key Levels to Monitor:
- Support: 6,959 - 6,972
- Resistance: 6,991 - 7,000

SPY Weekly Outlook – Week 1 of 2026SPY Weekly Outlook – Week 1 of 2026
Technical Look:
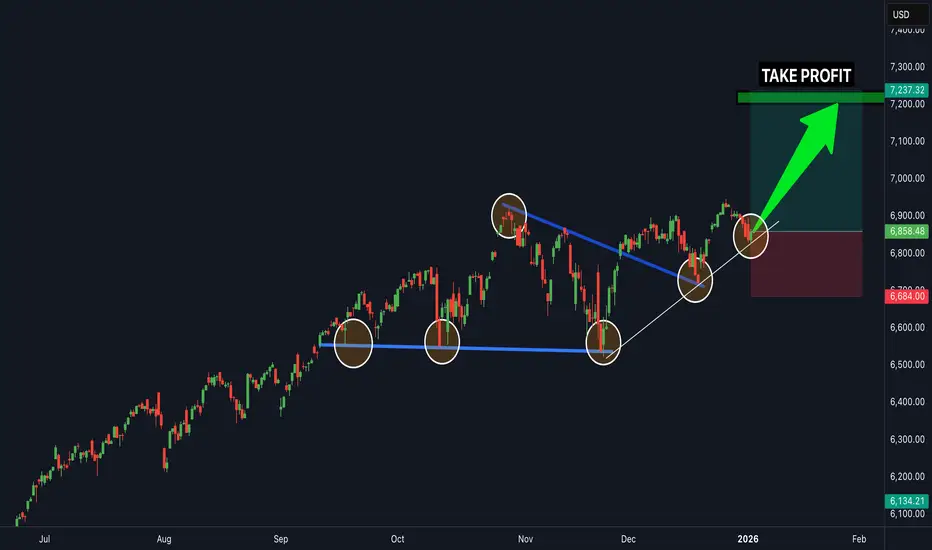
Price moved exactly as planned in my December 21 Weekly SPY outlook (you can check the linked idea). The market bottomed on December 17, which was also anticipated in my December 14 Weekly SPY prediction. After that, price pushed into all time highs and got rejected from those levels.
Currently, SPY is retracing from the highs and appears to be seeking additional liquidity and energy before any continuation higher. This consolidation phase may take longer than initially expected.
Scenarios – Prediction:
I am tracking two main scenarios for SPY during January 5–9.
Scenario 1: Bullish Scenario
The 684 level is marked as an options put wall. I will be closely watching for a 4H close above this level.
A confirmed 4H close above 684 would indicate that the bullish scenario is in play, and I would look to engage on the long side.
Potential upside targets for this scenario:
686.75 – 689 – 691.75
Scenario 2: Bearish Scenario
If price fails to break above 684 and starts declining, I would consider that SPY is seeking lower prices.
Downside targets in this scenario:
678.75 – 673 – 669.25
If price breaks 678.75 aggressively , I would then consider lower targets to be in play. Otherwise, the 678.75 level could act as a strong bounce zone for a potential upside reaction.
Position Management Notes:
Each target level may cause significant pullbacks or reversals. Personally, I take partial profits at these levels and keep the remaining position open toward the next targets, while trailing the stop loss to breakeven. This is how I manage my positions.
I share deeper US Market breakdowns and weekly scenario updates on Substack. Link is in my profile.
Disclaimer: This analysis is for educational purposes only and reflects my personal opinion. It is not financial advice.

S&P500 policy uncertainty from TrumpMarket reaction drivers
Trump’s housing policy post triggered a risk sell-off, particularly in real-estate and related stocks. His plan to ban large institutional investors from buying single-family homes spooked the sector and weighed on broader sentiment. Blackstone and other home-related names slid sharply on the announcement.
Defence stocks were also hit after Trump said he would block dividends and stock buybacks for defence contractors unless they increase production and maintenance — dragging names like Northrop Grumman, Lockheed Martin and RTX lower. (From your text)
Later, a Trump request to boost the 2027 US defence budget from $1 trn to $1.5 trn offered a potential positive catalyst for defence firms after the close, partially counterbalancing earlier negativity. (From your text)
Index performance
The S&P 500 closed lower as the renewed policy risk pressured markets. The headline index fell modestly, but the decline would have been worse without gains in mega-cap tech (the Magnificent 7 outperformed), while the equal-weight S&P underperformed, showing broader sector weakness. (From your text)
Sector and style effects
Real estate and private equity names underperformed due to the housing policy news.
Capital goods and defence stocks lagged on policy risk and restrictions on payouts.
Tech leaders provided relative support, helping to limit the overall S&P drawdown.
Oil & energy sectors may see positioning around access to Venezuelan crude — with US refiners potentially benefiting if imports are expanded — adding a nuanced catalyst for energy stocks.
(Bloomberg)
Overall tone for S&P 500 trading
Risk-off bias: policy uncertainty from Trump’s housing and defence remarks pressured cyclical and value sectors.
Selective strength in growth/tech: large cap tech helped cap losses.
Cross-market complexity: commodity and energy setups (Venezuelan crude access talks) add nuance to sector rotation.
Key Support and Resistance Levels
Resistance Level 1: 6942
Resistance Level 2: 6965
Resistance Level 3: 6986
Support Level 1: 6873
Support Level 2: 6847
Support Level 3: 6826
This communication is for informational purposes only and should not be viewed as any form of recommendation as to a particular course of action or as investment advice. It is not intended as an offer or solicitation for the purchase or sale of any financial instrument or as an official confirmation of any transaction. Opinions, estimates and assumptions expressed herein are made as of the date of this communication and are subject to change without notice. This communication has been prepared based upon information, including market prices, data and other information, believed to be reliable; however, Trade Nation does not warrant its completeness or accuracy. All market prices and market data contained in or attached to this communication are indicative and subject to change without notice.

Silver vs SPX: A Case for Multi Year OutperformanceThesis
Silver has a credible probability of outperforming the S&P 500 over a multi year horizon, potentially five to ten years, driven by persistent macroeconomic constraints, negative real rate bias, and a structurally tight supply demand balance. This outcome does not require systemic collapse or hyperinflation, only continued policy and fiscal pressure.
Macro framework
The US debt burden materially limits monetary policy flexibility. Aggressive rate hikes risk destabilizing an economy that remains highly dependent on credit expansion, while sustained easing increases the likelihood of above target inflation. This creates a long term bias toward financial repression, where nominal growth is supported at the expense of real purchasing power.
In such environments, real assets historically outperform financial assets on a relative basis. Even moderate but persistent inflation combined with capped or declining real rates is sufficient to favor precious metals versus equities.
Relative performance rather than absolute collapse
This thesis is not predicated on hyperinflation or fiat currency failure. Equities may continue to rise nominally, but silver does not need stocks to fall outright to outperform. A period of stagnant or modest equity returns alongside rising commodity prices is enough to generate meaningful relative outperformance.
Supply and demand dynamics
Silver supply is structurally constrained. A large portion of global production is a byproduct of base metal mining, limiting the ability of supply to respond quickly to higher prices. At the same time, industrial demand continues to grow, particularly in energy transition, electronics, and defense related applications.
Above ground inventories remain limited relative to potential demand surges. While demand is not infinite and substitution can occur at sufficiently high prices, the adjustment process is slow and often price disruptive, creating conditions for volatility and upside asymmetry.
Strategic behavior as a signal
Corporate and governmental behavior increasingly reflects concern over future availability of critical materials. Prepayment agreements, long term offtake contracts, and supply chain security initiatives suggest that some participants are prioritizing certainty of access over spot pricing. These behaviors tend to emerge when markets underestimate future scarcity.
As resource security becomes a higher priority, capital allocation decisions may shift in ways that favor commodity producers and real assets over long duration growth equities.
Pathways to silver outperformance
Silver is likely to outperform the S&P 500 under several realistic scenarios, including
Persistent inflation that keeps real rates near zero or negative
Continued fiscal expansion and debt growth without meaningful consolidation
Rising industrial demand without a commensurate increase in supply
Increased strategic stockpiling by governments or corporations
Periods of equity market stagnation or valuation compression rather than outright crashes
None of these conditions require extreme outcomes, and several can occur simultaneously.
Risks to the thesis
This thesis would be weakened if real interest rates remain meaningfully positive for an extended period, if fiscal discipline materially improves, or if technological substitution and recycling significantly reduce silver demand. A sustained expansion in silver supply would also challenge the upside case. Though arguably unlikely, these risks are still possible.
Conclusion
Silver outperformance is not inevitable, but the risk reward profile appears asymmetric. The combination of policy constraints, structural supply limits, and demand sensitivity creates a setup where silver has multiple viable paths to exceed equity returns over a multi year period. The primary risk lies not in short term volatility, but in the possibility that macro conditions resolve more favorably than currently expected.

S&P500 Uptrend breakout supported at 6873Despite major geopolitical headlines out of Venezuela, markets largely looked through the risk, with macro data driving price action instead. A weaker-than-expected US ISM manufacturing print reinforced expectations for faster Fed rate cuts, triggering a rally in Treasuries and supporting equities. The S&P 500 rose 0.64%, closing just 0.43% below its record high, with broad-based risk appetite evident across US and European markets.
Lower yields, easing growth concerns, and the absence of a negative shock from geopolitics continue to underpin equities. With rate-cut expectations firming and momentum strong, the near-term bias for the S&P 500 remains supported, though proximity to record highs suggests gains may be more incremental and data-dependent.
Key Support and Resistance Levels
Resistance Level 1: 6942
Resistance Level 2: 6965
Resistance Level 3: 6986
Support Level 1: 6873
Support Level 2: 6847
Support Level 3: 6826
This communication is for informational purposes only and should not be viewed as any form of recommendation as to a particular course of action or as investment advice. It is not intended as an offer or solicitation for the purchase or sale of any financial instrument or as an official confirmation of any transaction. Opinions, estimates and assumptions expressed herein are made as of the date of this communication and are subject to change without notice. This communication has been prepared based upon information, including market prices, data and other information, believed to be reliable; however, Trade Nation does not warrant its completeness or accuracy. All market prices and market data contained in or attached to this communication are indicative and subject to change without notice.

Jan 6 SPXHello,
Trading 0dte options these days are either 0 or Hero due to the fact that it is trading near ATH.
Yesterday volume was +10% higher the the avg daily volume which was an indicator that the market would push higher... I personally entered puts pre-market hoping that it would retest the bottom trendline to close some gaps before pushing higher, and I think that would've given us a fresh ATH. I flipped to calls when we crossed 6908. It was a humbling day but it's not the end.
Looking at Jan 6:
Major factor: we are trading just ~30 points away from ATH and we have all of this Venezuela news which is obviously loved by the market, however, keep watching China's reaction.
Looking at the levels, on the 4hrs + Daily Charts the market has just established a higher low obviously around ~6827 and moving to creating a higher high! depending on when it will make it but if we get it this week I'd say around 6965-7000.
On the Hourly Chart, I see a good opportunity to make test the channel and make a higher high but that would need a ~60 points push and huge volume... Possible? Yes, but very risky play
Given the above, I see the market moving up fast to create the higher high and then move back down to ~6880-6920 to form the new higher low. Or, sideways and burning premiums and delay the push for tomorrow!
I would be cautious with puts and would rather calls around the open or unless we clear our 6920 level.
GOOD LUCK!!!

ES (SPX, SPY) Analysis, Levels, Setups for Tue (Jan 6)U.S. stock markets closed on a positive note today, buoyed primarily by gains in the energy sector and large banking institutions. This upside was propelled by headlines related to Venezuela, which invigorated both the energy market and investor risk sentiment. Meanwhile, the ISM Manufacturing Index for December showed a contraction, remaining below the 50 threshold, which reinforces the narrative of uneven economic growth and places increased emphasis on upcoming services data scheduled for release later this week.
Looking Ahead to Tuesday:
The macroeconomic calendar for Tuesday appears relatively light, suggesting that the equity markets may engage in a more directional trading pattern unless unexpected geopolitical developments emerge overnight. The primary risk window looms larger later in the week with significant reports on ADP employment, ISM Services, and the EIA energy outlook, culminating in the Nonfarm Payrolls report.
Overnight Outlook into New York:
The most probable scenario sees a rotation around the 6948.50 level (VWAP), with a two-sided trading dynamic expected. Key support is identified at the 6942.50/6940.00 range, while the first resistance ceiling is placed between 6955.25 and 6963.50. A bullish scenario would emerge with a stable hold above 6942.50 and a successful move through 6955.25, paving the way toward the 6963.50 resistance level and beyond. Conversely, bearish pressure may materialize if the index falls below 6940.00, with a failure to reclaim 6942.50 potentially exposing levels around 6932.75 and the 6912.75-6906.00 range.
Trade Setups for Tomorrow
A++ Long Setup (Preferred):
Entry: 6932-6935 (PDL / NYAM.L test)
Stop: 6927
Target: 6948-6955
B+ Short Setup (Fade Rally) :
Entry: 6950-6955 (VWAP / Y-POC rejection)
Stop: 6960
Target: 6935-6940
Deep Discount Long (If Major Flush):
Entry: 6906-6912 (LO.H / AS.H zone)
Stop: 6900
Target: 6940-6950
Good Luck !!!

SPX 0DTE idea JAN 6 2026SPX is currently trading inside a balance zone, not a clean trend.
Momentum slowed after the last push up, and price is now reacting around key levels.
This is a wait-for-confirmation environment, not a prediction market.
Key Levels
• 6900–6922 → Balance / Chop zone
• 6922 → Major resistance
• 6898→ Breakdown trigger
• 6883 → 6869 → 6857 → Downside targets if selling accelerates
Bullish Scenario (CALL)
Only valid after confirmation:
• Break and hold above 6922
• Acceptance above the level (15m / 1H close)
• Successful retest holding above.
Targets:
• TP1: 6935
• TP2: 6960
Bearish Scenario (PUT)
More favorable if price loses balance:
• Breakdown below 6898
• Failure to reclaim.
Targets:
• TP1: 6883 ( is the acceleration level. Acceptance below it usually leads to faster downside movement. )
• TP2: 6869
• Extension: 6857
Summary
• ❌ No trades inside 6900–6920
• ❌ No guessing direction
• ✅ Trade confirmation, not hope
Above 6922 → CALL
Below 6895 → PUT

SPX500: Bullish Push to 7000?As the previous analysis worked exactly as predicted, FX:SPX500 is eyeing a bullish breakout on the 4-hour chart , with price rebounding from a key support zone near the upward channel's lower boundary, converging with a potential entry area that could ignite upside momentum if buyers defend against dips. This setup suggests a continuation opportunity amid the ongoing uptrend, targeting higher resistance levels with 1:2.5 risk-reward .🔥
Entry between 6860–6890 for a long position (entry at current price with proper risk management is recommended). Target at 7000 . Set a stop loss at a daily close below 6845 , yielding a risk-reward ratio of 1:2.5 . Monitor for confirmation via a bullish candle close above entry with rising volume, leveraging the index's resilience in the channel.🌟
📝 Trade Setup
🎯 Entry (Long):
6860 – 6890
(Entry at or near current levels is valid with proper risk & capital management.)
🎯 Target:
• 7000
❌ Stop Loss:
• Daily close below 6845
⚖️ Risk-to-Reward:
• ~ 1:2.5
💡 Your view?
Does SPX500 defend the channel support and break toward 7000 — or do we see another consolidation before the next leg higher? 👇

S&P 500 Showing Seller Weakness After Multiple Corrections — BreSummary
The S&P 500 has completed three consecutive corrective phases from the 6945–6922 zone, signaling weakening downside momentum and increasing potential for a bullish continuation.
Technical Analysis
The S&P 500 index has experienced three successive corrective moves originating from the 6945–6922 price zone. These corrections have unfolded in the form of long, medium, and short waves, a structure that typically reflects exhaustion during the corrective phase rather than the start of a strong bearish trend.
The decreasing depth and duration of each corrective leg clearly point to seller weakness and diminishing downside pressure. Buyers are increasingly absorbing supply, suggesting that the market is preparing for a potential impulsive move higher.
From a price action perspective, the market is consolidating and compressing below resistance, creating conditions favorable for a volatility expansion once a key level is breached.
Trading Scenarios
Scenario 1 – Higher Risk (Aggressive Entry):
Traders may consider entering near one of the recent price lows, accepting a higher level of risk in exchange for an early position. This approach is based on the assumption that the corrective phase is complete and a strong bullish impulse may follow.
Scenario 2 – Lower Risk (Confirmation Entry):
A more conservative strategy is to wait for a clear breakout above resistance, confirmed by a strong bullish Marubozu candle. This provides momentum confirmation and reduces the probability of a false breakout.
Key Levels to Watch
Support Zone: 6945 – 6922
Key Resistance: Previous corrective highs
Bullish Confirmation: Breakout with strong bullish candle structure
Invalidation: Sustained acceptance below the support zone
Takeaway
As long as the S&P 500 holds above the 6945–6922 support zone, the market structure favors a bullish continuation. Aggressive traders may position early at the lows, while conservative traders should wait for a confirmed breakout with strong momentum.
Hashtags
#SP500 #US500 #PriceAction #MarketStructure #BreakoutTrading #TechnicalAnalysis

SPX.. buy now SPX 500 is in a clear upwards channel and has broken the last bit of resistance (white trendline line shown) - this is a clear confirmation that the next target will be the next resistance zone to the upside shown above (this is a great buy trade opportunity) - buy SPX 500 now...
US500 Structure Turns Positive as Demand Builds📈 Bullish US500 / SPX500 Swing Trade Opportunity | Thief Layer Strategy 🛡️💰
🔥 Asset: US500 / SPX500 Index
📅 Trade Style: Swing Trade
📊 Market Bias: Bullish Momentum
💡 Trade Plan – Thief Layer Entry Strategy
We’re playing a multi-layered bullish entry using Thief’s layering method 👇
🔹 Limit Layers:
• Buy Limit @ 6820
• Buy Limit @ 6840
• Buy Limit @ 6860
• Buy Limit @ 6880
(Add more layers based on personal risk tolerance & preference)
Layer Method: Using multiple limit orders helps accumulate positions on weakness and improve average entry for swing upside.
🛑 Stop Loss – Thief OG Rule
🔒 SL: 6800 (Thief SL)
➡️ Adjust SL based on your own risk level and strategy. Manage risk yourself — only use my SL as reference, not guidance.
⚠️ I am not recommending you ONLY use my SL/TP — trade at your own risk & adjust as needed.
🏁 Target Zone
🎯 Primary Target: 6980
📌 This zone aligns with strong resistance, potential overbought reaction & trap level — cautious profit-taking area.
🔗 Related Markets to WATCH
Here are correlated markets that often move with SPX500:
✔️ US Dollar Index (DXY) – correlation influences risk sentiment and equities. A stronger USD often supports equity strength, though relationship varies over time.
✔️ NASDAQ / US Tech Index – tech is a big driver for US500 performance due to sector weight.
✔️ Crude Oil (WTI / Brent) – recent patterns showed equities trending in tandem with oil, reflecting risk appetite.
✔️ EUR/USD & GBP/USD — sentiment indicators that often swing with risk on/off market mood.
🧠 Fundamentals & Macro Drivers
📌 Economic Outlook: U.S. growth expected without recession in 2026, aiding risk assets.
📌 Fed Policy: Recent rate cuts and expectation of additional easing support equity valuations.
📌 Earnings Growth: Most major sectors projected with higher expected growth for 2026.
📌 AI + Tech Tailwinds: Continued AI investment remains a key bullish driver for US equities.
📅 Watch Upcoming News Events:
• U.S. Nonfarm Payrolls
• Fed Rate Decisions / FOMC Minutes
• CPI & Inflation data
• PMI & Retail Sales
📌 Why This Setup
✅ Multi-layer entries improve execution quality
✅ Bullish macro backdrop + earnings support
✅ Clear risk zone + target
✅ Correlation watchlist for context
💬 Trade smart, manage risk, and always confirm with your own analysis.
If this idea helped, *like 👍, comment 💬, and follow 📌 for more Thief strategy setups!

Let the chart explainFirstly, HAPPY NEW YEAR!!
In terms of the chart, people seem not to understand - candlesticks provide a whole lot of info. The majority of indicators are reflections of old price action.
Last year I covered several posts on mechanical structures and the associated techniques. Here's one;
Let's give an example here using GBPUSD.
This is how you can simplify your trading.
First, identify the larger range.
There are two obvious things that stand out in this example; firstly the trend itself and secondly, the break of the structure that caused the new low.
The reason they are important is to show the momentum (orderflow), in other words, who's in control.
We could do this in several ways - the mechanical is just a simple way to allow you to repeat the same process almost on autopilot.
Once you can spot the obvious without much effort, the ranges become a lot easier and the analysis is done in under one minute.
Now I have my range, next step I can look for some rationale as to where and why a Pull Back is likely to come to.
For clarification
Just to show you, a simple way to do this is use the volume profile tool and just cover range high or low to the opposing high or low.
So why here?
Well, to understand this, there are some other interesting areas to look into, such as supply and demand (not for this post) but in simple terms, it was this supply that made the new low.
OK, so if you get this so far. Another post that might be useful for you is one of my posts from 2021 here on @TradingView. This, is a lesson on Dow Theory.
Once you understand the primary range is what was drawn, you can then shift your attention to the secondary trend.
If you remember, how we broke down the external range. You can now see an internal range formed.
If this low had been taken out - the story would be completely different. This would have given more reason for the Pullback to be over and done with.
But in the example, the low held and that means it is still in the Pullback phase. So, unless the larger range high in broken. Indicating a larger trend shift.
The logic is simple, look for changes of character on the smaller ranges and watch them fall like dominoes. Once the secondary trend switches to your favour (back down, in the example) then you have some good, high probability setups on the cards.
Happy New Year to you all, again!
2026 is going to be another AWESOME YEAR!!!
Disclaimer
This idea does not constitute as financial advice. It is for educational purposes only, our principal trader has over 25 years' experience in stocks, ETF's, and Forex. Hence each trade setup might have different hold times, entry or exit conditions, and will vary from the post/idea shared here. You can use the information from this post to make your own trading plan for the instrument discussed. Trading carries a risk; a high percentage of retail traders lose money. Please keep this in mind when entering any trade. Stay safe.

ES (SPX, SPY) Analysis Week-ahead from Jan 5 to Jan 9, 2026Multi-Timeframe Market Analysis
Weekly Overview: The Big Picture
The E-mini S&P 500 (ES) continues to demonstrate an uptrend on a macro scale, characterized by a series of higher highs and higher lows. However, the recent market activity has resembled a gradual grind near the upper boundaries of a multi-month trading range—a behavior often referred to as “premium.” This indicates a slowdown in upward momentum, with pullbacks becoming increasingly pronounced. While the market does not exhibit extreme overbought conditions, the acceleration seen in prior weeks has noticeably diminished.
Daily Trend and Range Dynamics
On a daily basis, the market is operating within an upward trend that is currently exhibiting range-bound characteristics. We are witnessing repeated attempts to test the upper supply zone around the 6980-7000 level, followed by mean reversion toward the mid-to-lower 6900s. The latest daily swing reflects a pullback from this upper band, positioning prices now towards the center of this range, where liquidity zones take precedence over simply chasing trends.
4-Hour Perspective: Impulse vs. Correction
Analyzing the 4-hour chart reveals a distinct corrective move followed by a rebound that has yet to solidify a sequence of higher highs. While the overarching weekly trend remains bullish, the current 4-hour action feels more like a rebound effort, with the market in a phase of "repair" after experiencing a sharp decline.
1-Hour Intraday Context
At the intraday level, the latest 1-hour movement reflects a rebound from the lower 6800s towards the resistance zone in the low-to-mid 6900s. This places traders in a critical “decision zone” as we enter Monday's session, where the market faces a pivotal moment: it must either reclaim and sustain levels above these key resistance shelves (indicating bullish continuation) or risk further fading of rallies, which would suggest a return to range-bound or corrective trading.
Oscillator and Momentum Indicators (Weekly and Daily)
From a momentum perspective, the weekly oscillators point to a constructive yet cooling outlook, lacking signs of a fresh breakout structure. Daily momentum indicators are closer to neutral territory, indicative of a market that appears to be in a wait-and-see mode, poised for a catalyst to determine its next direction.
Volatility Metrics Analysis
VIX Overview
The CBOE Volatility Index (VIX) closed the previous session at 14.51, reflecting a decline throughout the day.
VIX Term Structure
The VIX term structure remains in contango, with an upward-sloping curve indicating that implied volatility is anticipated to rise over the coming months. Specifically, the implied volatility for January sits at 12.55, February at 15.38, and March at 17.34, with further increases projected for later months. This pattern is typically indicative of stable market conditions, suggesting that volatility is being priced higher down the line compared to the present.
Rates Volatility (MOVE)
The MOVE Index, which measures volatility in interest rates, is currently at 62.36 as we approach market close, also reflecting a decrease on the day. This level does not indicate significant stress within the market, aligning more with an environment in which investors are not exhibiting panic regarding interest rate fluctuations.
Options and Positioning Overview
Current Put/Call Ratios (Latest Daily Figures)
- Total Put/Call: 0.83
- Index Put/Call: 1.08
- ETP Put/Call: 0.85
- Equity Put/Call: 0.56
Analysis: The equity flow currently exhibits a call-leaning sentiment, as indicated by the lower equity put/call ratio. In contrast, index hedging remains active, with the index put/call ratio above 1. This duality is characteristic of late-cycle market behavior, where investors often purchase upside in individual stocks while simultaneously maintaining protective index hedges.
10-day Moving Average of Put/Call Ratios
Unfortunately, a definitive and authoritative 10-day moving average for the total put/call ratio is not readily available from the sources providing daily data in a machine-readable format. While the daily figures presented are confirmed, the 10-day averages cannot be securely sourced at this time.
SKEW - Tail Risk Pricing
The SKEW index closed at 141.86, a figure that Cboe describes as reflective of the pricing dynamics surrounding out-of-the-money SPX options, particularly those associated with tail risk. Typically, values for SKEW fluctuate within the 100-150 range. The implication is clear: despite a calm front-end volatility environment (as suggested by VIX levels), tail hedges are attractively priced.
Dealer Gamma Insights
Considering the current landscape of low spot volatility coupled with contango and a modest equity put/call ratio, market conditions suggest that dip buyers may defend the initial downside levels effectively. However, the elevated SKEW indicates that the demand for downside tail protection is increasing, meaning that if the market breaches key support levels (S4), panic-induced hedging activity could accelerate rapid downward movements. This interpretation is based on the metrics discussed and does not represent direct insights from dealer positioning.
Market Breadth and Internals Analysis
Advancers vs. Decliners (NYSE)
On January 2, 2026, the New York Stock Exchange recorded 1,882 advancing issues compared to 882 declining ones.
Breadth Oscillator (McClellan)
The NYSE’s McClellan Oscillator is currently at -18.826, a notable improvement from -76.414 previously. This indicates that while breadth remains slightly negative, the recent uptick suggests a reduction in selling pressure.
Sector Performance Snapshot
Recent market activity has highlighted leadership in the energy sector, along with notable strength in semiconductor stocks, while consumer segments have lagged behind. Should this trend continue, it would support a “grind/range” market environment rather than a drastic “waterfall selloff,” unless unexpected macroeconomic events disrupt the landscape.
Market Dynamics: Minor Wobble vs. Distribution Day
With breadth showing signs of improvement and credit markets not exhibiting significant stress, the current evidence leans towards a “minor wobble/consolidation” scenario rather than a full-scale distribution. This outlook holds, provided that key support levels remain intact and market internals do not deteriorate concurrently.
Credit and Funding Overview
High Yield ETFs
- HYG: 80.67
- JNK: 97.24
High Yield Spreads (OAS)
As of the last available print on December 31, 2025, the ICE BofA US High Yield OAS stands at 2.81%. This level is considered tight and typically signifies “orderly credit” conditions. It is important to monitor these spreads closely; a sharp widening could signal increased risk aversion, which often leads to more significant pullbacks in equity markets.
Sentiment and Crowd Positioning
AAII Sentiment (Latest)
- Bullish: 42.0%
- Neutral: 31.0%
- Bearish: 27.0%
The current sentiment readings indicate a notable tilt toward optimism. While this sentiment alone does not serve as a reliable timing mechanism for market reversals, it effectively diminishes the “wall of worry” that frequently fuels market squeezes.
Cross-Asset and Global Risk Tone
Crypto (Risk-On Proxy)
- BTC: 91,314
- ETH: 3,137.63
The resilience in cryptocurrency prices typically reflects a broader risk-on sentiment, although it should be noted that this is not a definitive indicator for daily movements in equities.
ES vs. NQ Relative Strength
The Nasdaq (NQ) continues to exhibit higher beta characteristics. If NQ consistently underperforms during market rallies, it may hinder attempts for the S&P 500 (ES) to push through resistance levels at R1 and R2.
Scheduled Events(ET):
Mon Jan 5
• 10:00 AM - ISM Manufacturing PMI (Dec)
Tue Jan 6
• 9:45 AM - S&P Global Final Services PMI (Dec)
Wed Jan 7
• 8:15 AM - ADP Employment Change (Dec)
• 10:00 AM - ISM Services PMI (Dec)
• 10:00 AM - JOLTS Job Openings (Nov)
• Late afternoon - Fed speaker risk (watch headlines)
Thu Jan 8
• 8:30 AM - Weekly Unemployment Claims
• 8:30 AM - Productivity and Unit Labor Costs (Q3)
Fri Jan 9 (highest impact)
• 8:30 AM - Nonfarm Payrolls, Unemployment Rate, Average Hourly Earnings
• 10:00 AM - University of Michigan Consumer Sentiment (prelim)
Two A++ setups (Level-KZ Protocol 15/5/1)
A++ Setup 1 - Rejection Fade Short (R1/R2 cap)
Entry: 6934.75-6937.50
Hard SL: 6946.25 (above the 15m rejection wick)
TP1: 6906.50 (S1)
TP2: 6889.50 (S3 top)
TP3: 6875.50 (S4 top)
Invalidation: 15m acceptance above 6940.75 and holding (no immediate snapback)
A++ Setup 2 - Bounce Long (S4 defend)
Entry: 6869.00-6876.00
Hard SL: 6859.75 (below the reclaim wick and below 6861.75 fib magnet)
TP1: 6902.75 (S1)
TP2: 6938.50 (R1)
TP3: 6982.50 (R3 first tag)
Invalidation: 15m bodies holding below 6866.75
Good Luck !!!

MONDAY JAN 5th SPXInteresting week ahead! News about Venezuela and capturing Maduro came out Saturday, and definitely this would be negative on the market... Here's how I see the market reaction:-
- GOLD/SILVER: spike at the open and then digest the news and cool off
- SPX dropping ~0.5 to 6820 premarket and at market open, and might continue the sell of to 6778 level Max and quickly rebound imo as it would give a false break below the uptrend channel on the daily, breaking below 6778 would take us to a bear market which I hardly think would happen
So, I would wait the first 15-30 mins or jump into puts, and wait for the market to retest the 6820 and start picking up calls cautiously. Also, it is worth to note that given the high tensions there might be lots of news coming out about the situation so I wouldn't hold on into positions for so long.
Targets on the upside: T1: 6865 T2: 6880 T3: 6920
Not an investment advice !
Good luck


MES - Descending Wedge at 6,900 | Support Zones Below For Bounce
Executive Summary
Micro E-mini S&P 500 futures (MES1!) trading at 6,900.50 within a descending wedge on the 4H timeframe. After the S&P 500's third consecutive year of gains (+16.56% 1Y), price is consolidating below the 52-week high of 6,995. Multiple support zones below offer potential bounce opportunities. Descending wedge typically bullish reversal pattern.
BIAS: NEUTRAL - Watching Support Zones for Direction
Current Market Data
Current: 6,900.50 (+0.12%)
Day's Range: 6,866.50 - 6,939.75
52-Week: 4,832.50 - 6,995.00
Open Interest: 130.39K
Front Month: MESH2026
Performance:
1W: -1.15% | 1M: +0.51% | 3M: +2.02%
6M: +9.41% | YTD: -0.01% | 1Y: +16.56%
Key Market Context
S&P 500 just completed 3rd consecutive year of gains
50% odds of 4th straight year based on history
Valuation indicators at extreme levels (98th percentile)
Breadth oscillators on sell signals
Equity put-call ratios rising (bearish)
VIX still complacent - bullish for stocks
Fed rate cuts expected in 2026
AAII bears at lowest since Oct 2024
Technical Structure - 4H
Descending Wedge Pattern:
Falling resistance trendline (yellow dashed)
Falling support trendline (yellow dashed)
Wedge narrowing - compression before breakout
Typically bullish reversal (70% break up)
Key Levels:
Resistance:
6,940 - Day's high / immediate resistance
6,970 - Upper resistance (red line)
6,995 - 52-WEEK HIGH
7,000+ - Psychological / breakout target
Support Zones (Purple):
6,860 - 6,880 - Upper support zone
6,800 - 6,820 - Middle support zone
6,720 - 6,760 - Lower support zone
6,675 - Major support (red line at bottom)
SCENARIO ANALYSIS
BULLISH: Wedge Breakout
Trigger: Break above 6,970 with volume
Targets: 6,995 (52-week high) → 7,000+ → 7,100
BEARISH: Test Support Zones
Price tests 6,860-6,880 first support
If fails, drops to 6,800-6,820
Deeper support at 6,720-6,760
Major support at 6,675 (must hold)
My Assessment
Descending wedge at 6,900 with multiple support zones below. Market breadth weakening but VIX complacent. Expect test of support zones before potential breakout. Watch 6,860-6,880 for bounce. Break below 6,675 invalidates bullish thesis.
Strategy:
Watch for bounce at 6,860-6,880 support
Long on wedge breakout above 6,970
Target 6,995 (52-week high), then 7,000+
Stop below 6,675 major support
List your thoughts below!

S&P 500 Daily Chart Analysis For Week of Jan 2, 2026Technical Analysis and Outlook:
During this abbreviated New Year's trading session, the S&P 500 Index is currently continuing to demonstrate an In Force Retracement sentiment. The Index has established a new Mean Support level at 6,833, and it is anticipated that it will persist in its downward trajectory towards the subsequent Mean Support level at 6,877.
It is imperative to recognize that, given the conditions of the market, there exists a considerable probability of a Dead-Cat rebound. This rebound may prompt a retest of the completed Outer Index Rally at 6,945, via the Key Resistance identified at 6,932.
Additionally, it is expected that the prevailing downward sentiment will remain or may even deepen, and intermediate bearish momentum is likely to persist, particularly as the above-named target levels realign with the anticipated market trajectory.

MES – NY Open BreakdownBias remains bullish, but MES moves with a lot more intention.
Double top formed, neckline broke, and now I’m looking for a measured pullback into value.
I’ve mapped out two buy zones and I’m letting price do the work:
🟩 Buy Zone 1
First area of interest. I’ll look for structure, acceptance, and continuation before getting involved.
🟩 Buy Zone 2
Lower zone. If we pull back deeper, I’m happy to wait for a cleaner, higher-quality setup there.
MES doesn’t usually sprint, it walks you into the trade if you’re patient enough 🧘♂️
NY open will tell me whether there’s opportunity or just noise.
Either way, no forcing trades.
Process first. Execution second.

SPX500 Price Action Hinges on 6918 PivotSPX500 | Market Outlook
U.S. stock futures opened notably higher on Friday, the first trading day of 2026, after Wall Street recorded a third consecutive year of gains in 2025. Markets navigated tariff disputes, the longest government shutdown in U.S. history, geopolitical tensions, and concerns over central bank independence.
Investors are now focused on next week’s U.S. payrolls report for labor-market signals, while attention remains on the Federal Reserve. Speculation has increased after reports that Donald Trump is expected to name Jerome Powell’s successor early this year, raising expectations of a potentially more dovish policy shift.
TECHNICAL VIEW (SPX500)
The index is showing signs of a corrective move toward 6918.
While trading below 6918, bearish momentum is expected to resume
A rejection from 6918 would support downside pressure toward 6880, followed by 6866 and 6813
Alternatively:
A 4H candle close above 6918 would invalidate the bearish bias and signal bullish momentum toward 6946 and 6990
Key Levels
Pivot Line: 6918
Support: 6880 – 6866 – 6813
Resistance: 6946 – 6990
