Tomorrow’s Playbook: Levels, News Bias & Scenarios 08/14/2025Summary: Bias = Neutral→Bullish while above 6,464–6,466 and the 15m 200-EMA (6,459). A clean 5m/15m acceptance above 6,491/6,500 favors continuation; otherwise expect a data-driven sweep into 6,475–6,468 to test demand.
Scenarios & Triggers (rule-based)
1) Continuation breakout
• Trigger: 5m close > 6,491 → probe 6,496–6,500.
• Validation: 15m acceptance above 6,500 (no immediate rejection).
• Targets: 6,502–6,505 first; stretch 6,512/6,520 if momentum persists.
• Management: If price reclaims 6,491 from above after a retest, momentum likely intact.
2) Rotation to demand (buy-the-dip if structure holds)
• Trigger: Rejection at 6,489–6,491 with 5m close back inside range.
• Path: 6,482 → 6,475.5 → 6,468; watch order-flow absorption or an FVG fill inside 6,464–6,466.
• Validation: Bullish 5m close from the box and 15m structure holds above 6,459.
• Targets on bounce: Return to 6,489–6,491, then 6,496–6,500.
3) Bearish flip (lower-probability without data shock)
• Trigger (strict): 15m bearish confirmation and sustained acceptance below 6,459 (15m 200-EMA).
• Path: Open the door to a deeper mean-reversion leg toward prior breakout bases (next map would be built after the break).
• Note: No shorts without that 15m confirmation per protocol.
Educational only — not financial advice.
S&P 500 (SPX500)

S&P 500 Index Reaches New All-Time HighS&P 500 Index Reaches New All-Time High
The S&P 500 index set a new all-time high, climbing above the 6,460 mark. The rally in equities is a direct result of yesterday’s CPI report.
According to Forex Factory, the annual CPI remained at 2.7%, whereas analysts had forecast an increase to 2.8%. Moderate inflation readings provide stronger grounds for a Federal Reserve interest rate cut — a move President Trump has been strongly advocating.
Data from the CME FedWatch tool shows that traders now price in a 94% probability of a key rate cut in September, compared to nearly 86% the day before and around 57% a month ago. This prospect of monetary policy easing acts as a bullish driver for the stock market.
Technical Analysis of the S&P 500 Chart
On the H4 chart of the S&P 500, there are grounds to outline an ascending channel (shown in blue). The price is currently in the upper half of the channel — a sign of prevailing optimism in the market.
Following yesterday’s CPI release, the price generated a strong bullish impulse, breaking two resistance levels from below (as indicated by the arrow):
→ August high at 6,406
→ Previous all-time high around 6,440
As a result, these former resistance levels now form the 6,406–6,440 zone. We can assume that:
→ this area may act as support going forward, as buyers clearly held the advantage here;
→ the median line of the ascending channel may also provide support, having shown signs of resistance in early August before being decisively broken on yesterday’s strong impulse.
The RSI indicator is hovering near overbought territory, making the market vulnerable to corrections. However, given the improved fundamental backdrop, any pullbacks might be shallow.
In the short term, the S&P 500 may reach the upper orange line, which defines the growth trajectory from the lower to the upper boundary of the long-term ascending channel. Should the fundamental outlook be further reinforced by positive news — for example, relating to a US–Russia leaders’ meeting — the index could advance towards the upper boundary of the blue channel.
This article represents the opinion of the Companies operating under the FXOpen brand only. It is not to be construed as an offer, solicitation, or recommendation with respect to products and services provided by the Companies operating under the FXOpen brand, nor is it to be considered financial advice.

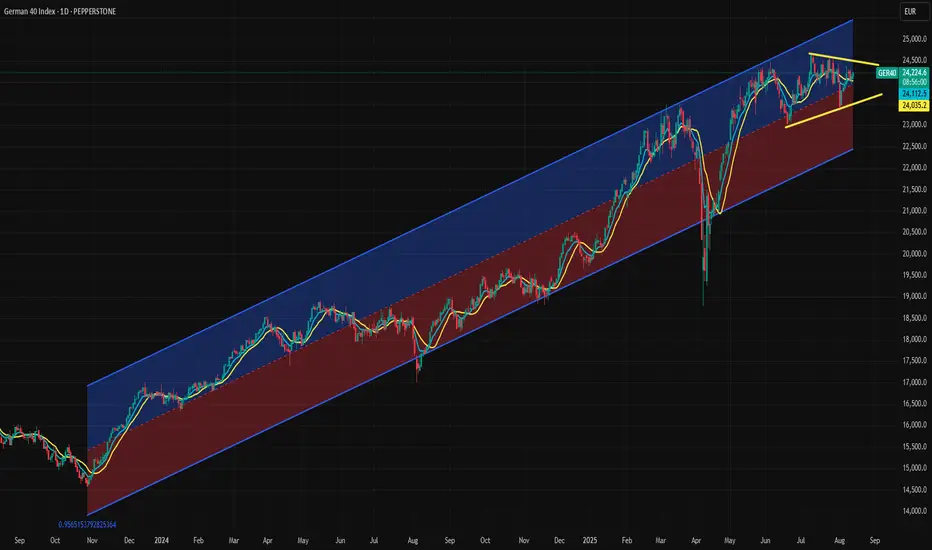
Both Technical and Valuation Signals Points Incoming VolatilityThe DAX has been moving sideways since May, with this flat movement evolving into a triangle formation since June. Price action is contracting, and the index appears to be waiting for a catalyst to determine its next direction.
The DAX is currently near the regression line from the November dip, which keeps both upward and downward possibilities open, consistent with the neutral signal from the triangle pattern.
From a valuation perspective, the DAX’s forward P/E ratio stands at 16.95x, roughly one standard deviation above its 2009-to-date regression line, making it relatively expensive compared to its own history. The S&P 500 trades at a much higher forward P/E of 24.25x, but that figure is near its own long-term regression line. Since early June, the DAX/S&P 500 ratio has fallen by nearly 10%, significantly reducing the DAX’s relative overvaluation and potentially giving it room for another leg higher.
Ultimately, the triangle formation may be the deciding factor. The current upper boundary is at 24,500, and the lower boundary is at 23,490. A break of either could bring volatility back to the DAX, with momentum likely to follow the breakout direction. An upward break could target the 24,400–24,500 zone.
S&P 500 All Round Analysis - S&P 500 Created HistoryTechnical Summary: The primary trend of the S&P 500 is bullish. On the 4H chart, the prices are trending bullish in an ascending channel formation. Prices are rising after reflecting from the lower trendline of the channel on Monday. The prices rose to an all-time high of 6445.75 after accepting support at the fib extension 0.382 at 6402.4. If prices successfully breach the immediate resistance at fib extension 0.50 at 6460.5, then it may rise to the far resistance zone between 6500 - 6518 (fib extension 0.618).
Descriptive Analysis: The S&P 500 notched a record close on Tuesday after consumer prices rose by less than expected in July, increasing the probability of the Federal Reserve cutting interest rates next month.
Data-related Projection: In the absence of key data releases today, market focus has shifted to tomorrow’s U.S. PPI report. U.S. stock markets are being underpinned by bullish sentiment, which is fueled by expectations of future rate cuts, possibly in the September Fed meeting.
Indicator Interpretation: The prices are trending higher in the buying zone of the technical indicators - above the middle Bollinger band and the mid-50 level of RSI.
ALTERNATIVE SCENARIO
Technical Confirmation: If the index fails to rise above fib extension 0.50 at 6460.5 and sustain, but falls below fib extension 0.382 at 6402.4, then further bearishness can be expected.
Facts & Figures: The S&P 500 is a very well-known index of large-cap US stocks, covering about 75% of all publicly traded US stocks. It comprises 505 stocks of 500 companies selected by a committee using 8 criteria.
Daily Pivot: 6420 (CMP: 6445.75, which is trading above the pivot level while writing the report).

Rate-cut optimism fueled risk-on mood, lifting US equities
July CPI showed little inflationary impact from tariffs, amplifying expectations for a September Fed cut. Optimism also returned for small-cap firms, previously seen as most vulnerable to tariff pressures. Headline CPI rose 2.7% YoY in July, 0.1% lower than a year earlier, with a 1.1% MoM drop in energy prices contributing to the overall decline.
BlackRock CIO Rick Rieder noted that shelter costs, the largest CPI component, slowed to their lowest since 2021, significantly boosting the odds of a September cut. He added that the Fed could take a more aggressive approach, with a 50bp cut at the September FOMC.
USTEC extended its sharp uptrend after breaching above the 23700 high. The widening gap between both EMAs indicates the potential continuation of bullish momentum. If USTEC holds above 23700, the index may gain upward momentum toward the psychological resistance at 24000. Conversely, if USTEC breaks below 23700, the index could retreat toward 23300.

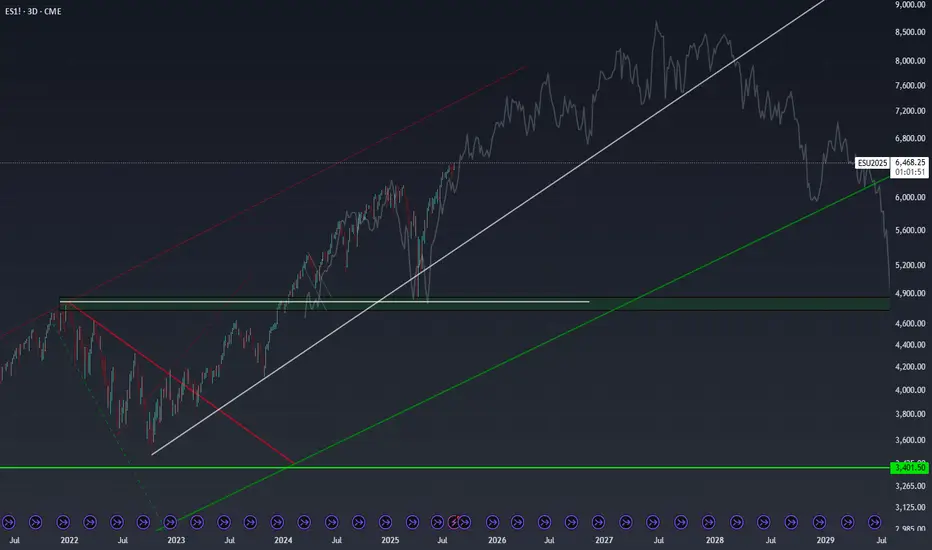
Are We Replaying the Dot Com Era?I’m completely unbiased here - more so curious - but today’s S&P 500 setup looks eerily similar to the late 1990s. In 1996 and 1997, the index posted back-to-back gains of over 20%, just as 2023 and 2024 have done. Then, in 1998, we saw a sharp 20% pullback - much like the one we’ve had in April of 2025. If you overlay that late-’90s fractal on today’s chart, the trajectory points to an S&P 500 level near 8,200 by early 2027.
The bullish case practically writes itself: strong GDP growth, resilient corporate earnings, AI-driven productivity gains, a still-accommodative liquidity backdrop, and investors willing to pay up for growth narratives—just as they did in the dot-com era. The “there is no alternative” (TINA) mentality toward equities was alive then, and it’s alive now. If the trend holds, the next couple of years could deliver staggering upside.
That said, it’s purely an observation - not a prediction. A decisive break below the key rising support trendlines would negate this bullish scenario and shift me to a cautious or neutral stance. Until then, the pattern is worth keeping an eye on.
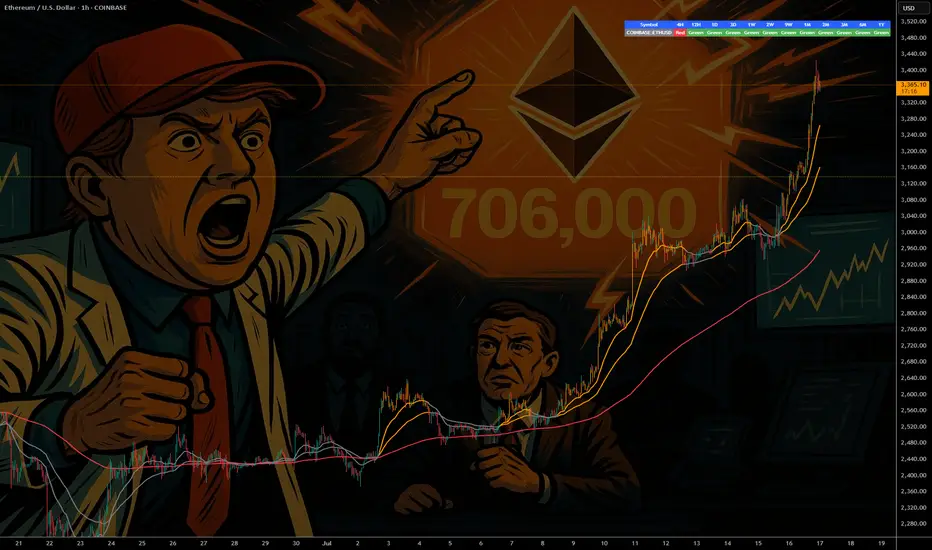
ETH - If You Know ...... You Know whats Coming
NYSE:BLK $BUIDL tokenized U.S.-Treasury fund launched on COINBASE:ETHUSD in Mar 2024—Wall Street is already settling real dollars on-chain.
NYSE:JPM JPMD stablecoin just went live on Base (an COINBASE:ETHUSD L2), piping wholesale payments from a $4 T balance-sheet straight through COINBASE:ETHUSD rails.
COINBASE:ETHUSD isn’t just riding the next crypto cycle—it’s becoming Wall Street’s settlement layer. From BlackRock’s on-chain Treasury fund to JPMorgan’s and soon Bank of America’s dollar tokens, a tidal wave of institutional stable-coin flows is lining up behind ETH. Fewer coins, more real-world volume—if you know, you know what’s coming.
NYSE:BAC CEO says they’ll issue a dollar-backed token the moment regulators nod—another tier-1 bank boarding the Ethereum train.
Stablecoin cap has blasted past $230 B , with 80 %+ of all on-chain transfers riding Ethereum (plus BSC) blocks.
Corporate settlements via stablecoins grew 25 % YoY in 2024 as multinationals replaced SWIFT with instant on-chain clearing.
Daily stablecoin throughput averages $7 B—each hop burning ETH and tightening supply.
BCG projects tokenized real-world assets to exceed $16 T by 2030 , with EVM chains as the default plumbing.
Over 500 M wallets already interact with stablecoins , a 30 % YoY surge led by emerging-market demand.
L2s like BINANCE:ARBUSDT & BINANCE:OPUSDT cut transaction fees 35 % yet still settle back to mainnet—meaning ETH captures the fee stream and the burn.
Bottom line: a tidal wave of bank-grade stablecoins + tokenized assets is lining up behind ETH; supply shrinks, demand soars—if you know, you know what’s coming.
quote] Marty Boots | 17-Year Trader — smash that , hit LIKE & SUBSCRIBE, and share your views in the comments below so we can make better trades & grow together!
ARKK: The Calm Before the Innovation Storm -ALTSEASON Is COMING🚀 ARKK: The Calm Before the Innovation Storm 🌪️
The markets are shifting, and disruption is about to go vertical. ARK Innovation ETF (ARKK) is quietly positioning itself for what could be the most explosive move of this decade. With high-conviction bets in AI, Bitcoin, genomics, and next-gen tech, this isn’t just a fund—it’s a launchpad for exponential growth.
This post breaks down exactly why ARKK could go parabolic—and why the smart money is already moving in. 👇
Explosive upside in 2026
ARKK is already up over 24% YTD , showing strong momentum compared to broader markets and signaling early stages of a potential parabolic move .
High-conviction concentration in game-changers
Top 10 holdings include Tesla, Roku, Zoom, Coinbase, UiPath, Block, Crispr Therapeutics, DraftKings, Shopify, and Exact Sciences. These are leaders in innovation sectors with massive upside potential .
Deep exposure to Bitcoin and digital assets
Heavy allocation to Coinbase and Block gives indirect exposure to Bitcoin . If BTC breaks into a new cycle high , ARKK stands to benefit significantly.
Positioned in exponential growth sectors
Focus on AI, genomics, EVs, fintech, robotics, and blockchain , all of which are entering accelerating adoption phases globally.
Aggressive smart-money accumulation
Cathie Wood’s team continues buying aggressively during dips, reinforcing institutional confidence in the fund’s long-term trajectory.
Technical breakout structures forming
Ascending triangle and multi-month consolidation breakouts suggest a technical setup primed for explosive upside .
Innovation supercycle aligning
ARKK's themes are aligned with major global shifts like de-dollarization, decentralized finance, and AI convergence .
High beta = massive upside leverage
With a beta above 2 , ARKK tends to outperform in bull runs , offering leveraged exposure to innovation without the need for margin.
Resurgence of top holdings
Names like Coinbase, Tesla, Shopify, and Roku are up 50%–100% YTD , driving ARKK’s NAV growth and fueling bullish sentiment .
Long-term vision with short-term catalysts
The fund projects 5x returns over the next five years , while Bitcoin halving cycles, tech innovation, and regulatory clarity serve as short-term ignition points .
Marty Boots | 17-Year Trader — smash that 👍👍, hit LIKE & SUBSCRIBE, and share your views in the comments below so we can make better trades & grow together!

Eli Lilly (LLY) – Pharma Giant at a Key Price LevelHi,
Eli Lilly & Co. is one of the world’s largest pharmaceutical companies, founded in 1876 and headquartered in Indianapolis. It operates in over 125 countries and is best known for blockbuster treatments in diabetes, obesity, oncology, and immunology. Recent growth has been driven largely by its GLP-1 class drugs Mounjaro and Zepbound, which have quickly become industry leaders in the weight-loss and diabetes markets.
Recent Fundamentals (Q2 2025)
Revenue: $15.56 B (+38% YoY)
- EPS: $6.31 (beat expectations)
- Mounjaro sales: $5.2 B
- Zepbound sales: $3.38 B
- Full-year guidance: Revenue $60–62 B, EPS $21.75–$23.00
- Margins: Gross margin ~82.6%, net margin ~25.9%
- Profitability: ROE ~75.5%, ROIC ~29.6%
While fundamentals remain strong, the recent Phase III data for the oral weight-loss pill orforglipron came in below expectations, sparking a ~14% drop, the stock’s steepest one-day decline in decades. Analysts have since trimmed long-term sales forecasts for this product.
From a valuation perspective, the stock trades at a premium (~41× P/E, ~10.7× P/S), leaving little room for major disappointments.
Technicals
Technically speaking, the price has arrived in the zone where I’ve been patiently waiting to share it as an idea. This is a good area from where to start building positions if you’re interested.
There are quite a few technical confluence factors aligning here, but be ready to grab it also around $500 if the market offers it. Let that be your guide:
- If you’re not willing to hold long-term, don’t touch it.
- If you’re not willing to buy more at lower prices, don’t touch it.
Good luck,
Vaido

S&P500 awaits US CPI data capped by 6437US equities were little changed Monday. Nvidia (-0.35%) and AMD (-0.28%) slipped after agreeing to pay 15% of Chinese AI chip sales revenue to the US government in exchange for export licenses — a deal Trump confirmed, adding he may allow a scaled-down Blackwell chip to be sold in China. The Philadelphia Semiconductor Index fell -0.13%, cushioned by Intel (+3.51%) after its CEO met with Trump. The Mag-7 (-0.09%) saw slight outperformance, led by Tesla (+2.85%).
Trump extended the US–China tariff truce by 90 days to November 10, keeping additional tariffs at 30%. China matched the extension.
The Fed chair search now includes vice chairs Bowman and Jefferson, plus Dallas Fed President Logan. Trump appointed EJ Antoni (Heritage Foundation) to lead the Bureau of Labor Statistics.
Markets await today’s US CPI, which could influence Fed rate-cut bets, while gold traders look for clarity after Trump said gold imports won’t be tariffed.
Key Support and Resistance Levels
Resistance Level 1: 6437
Resistance Level 2: 6480
Resistance Level 3: 6520
Support Level 1: 6340
Support Level 2: 6295
Support Level 3: 6256
This communication is for informational purposes only and should not be viewed as any form of recommendation as to a particular course of action or as investment advice. It is not intended as an offer or solicitation for the purchase or sale of any financial instrument or as an official confirmation of any transaction. Opinions, estimates and assumptions expressed herein are made as of the date of this communication and are subject to change without notice. This communication has been prepared based upon information, including market prices, data and other information, believed to be reliable; however, Trade Nation does not warrant its completeness or accuracy. All market prices and market data contained in or attached to this communication are indicative and subject to change without notice.
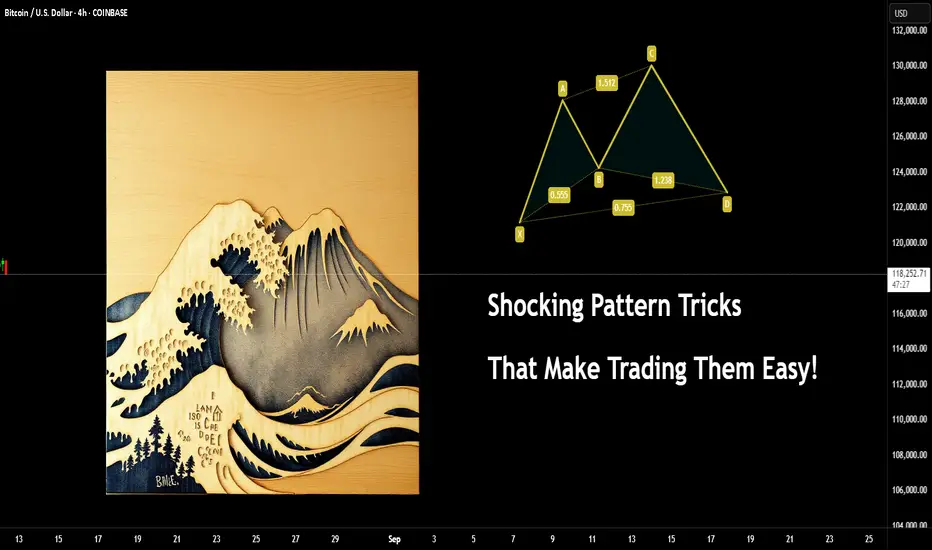
Shocking Pattern Tricks That Make Trading Them Easy!Here's another little viewpoint you might not have thought much about before.
Trading patterns is more popular than you would believe. Some seem to think it's magic or some kind of secret.
The issue is people tend to get fixated on the wrong things, such as the exact Fibonacci relationships and so on.
Let me show you something to simplify the concept, regardless of the pattern.
Example :
You might have seen a Crab pattern?
What you would then expect after spotting one on the chart is a move like this.
But, have you ever stopped to think what the price action is actually saying? It has ZERO to do with Fib relations.
Think of what the trend is doing
I have covered the basics of Dow theory in several posts here. An example of such a post is here (you need to click the image to see the full post).
Ok, Now you can see it's only part of a higher degree wave count. Let's add an example of liquidity and a range.
Are you starting to see it already?
Here's a post on the ranges...
Change the pattern from a Crab to a Bat.
Now look at it and logically what is the chart behind the pattern saying? Both bullish and bearish versions.
What about the good, old head and shoulders technique?
If you are unsure about the pattern, it's market something like this
(examples only) don't comment something like "the levels are wrong" all of these were freehand to show the concept without accuracy.
Looking at the H&S pattern - you can actually see the logic simplified.
Again, if you don't know about internal and external liquidity, here's another post on the topic.
What happens next is the internal structure changes, which then eventually leads to the higher TF change of structure.
And if you were to follow either Fib levels or Elliott Wave counts you will notice the regular move internally looks similar. (marked in red).
This post is just to show you an example and how obvious these can be.
Once you learn the basics, you won't need the complex version to follow price and use this to your advantage.
Have a great week!
Disclaimer
This idea does not constitute as financial advice. It is for educational purposes only, our principal trader has over 25 years' experience in stocks, ETF's, and Forex. Hence each trade setup might have different hold times, entry or exit conditions, and will vary from the post/idea shared here. You can use the information from this post to make your own trading plan for the instrument discussed. Trading carries a risk; a high percentage of retail traders lose money. Please keep this in mind when entering any trade. Stay safe.
Spx500 usdGetting some pips before spx going up again,
This is my bet in the meanwhile,
Dyor always.

SPX500 Swing Short!
HI,Traders !
#SPX500 keeps growing
And is locally overbought
So after the price hit a very
Strong resistance level
Around 6422.93 we will be
Expecting a pullback and
A local bearish correction !
Comment and subscribe to help us grow !

S&P 500 (ES1!): Bullish! Look For Valid Buy Setups!In this video, we will analyze the following FX market for the week of Aug 11 - 15h:
S&P 500 (ES1!)
The S&P 500 rose Friday to close the week strong on a busy week of tariff updates and good earnings.
There is no reason to consider selling.
Wait for pullbacks to FVGs for high probability buys. Look for IRL to ERL, and repeat.
Enjoy!
May profits be upon you.
Leave any questions or comments in the comment section.
I appreciate any feedback from my viewers!
Like and/or subscribe if you want more accurate analysis.
Thank you so much!
Disclaimer:
I do not provide personal investment advice and I am not a qualified licensed investment advisor.
All information found here, including any ideas, opinions, views, predictions, forecasts, commentaries, suggestions, expressed or implied herein, are for informational, entertainment or educational purposes only and should not be construed as personal investment advice. While the information provided is believed to be accurate, it may include errors or inaccuracies.
I will not and cannot be held liable for any actions you take as a result of anything you read here.
Conduct your own due diligence, or consult a licensed financial advisor or broker before making any and all investment decisions. Any investments, trades, speculations, or decisions made on the basis of any information found on this channel, expressed or implied herein, are committed at your own risk, financial or otherwise.

Why the 95% failIt's no secret that over 90% of retail traders lose money. I am not talking about throwing some money into crypto and hoping for the moon type wins or losses. I mean actually trading and making a living from it.
You see, when you start, you are hungry for information - what's the best course, who has the best strategy, what if I trade 25 instruments on a 1-minute timeframe. Surely more profits...
After doing this for over 25 years, you get to see people come and go, sometimes they come back with a new idea and more funds to give the market.
But overall, some of the core problems are - all the gear and no idea.
Not only do people invest in screens, the latest hardware and of course the legendary Bloomberg subscription for 24/7 news.
What about indicators?
Has your screen ever looked a little bit like this?
The issue with more indicators is the majority of them lag to price action, re-paint or are simply not needed. Then combine that with the lack of experience, and you are left questioning do I buy or sell if my RSI is up but the moving average just crossed down?
You are not alone, most traders have been there if not all!
It is hard enough when even the brokers and exchanges fight against you - have you ever seen a scam wick directly to your stop and bounce?
What about the A-book vs the B-book?
In an A-book model, the broker passes their clients' trades directly to the market. Essentially, the broker acts as a middleman, executing trades on behalf of clients in the open market. This means that the broker's profits come primarily from commissions and spreads rather than trading against the client.
B-book, the broker takes the opposite side of the client's trades, essentially acting as the counterparty. Instead of sending trades to the open market, the broker keeps them internally.
The next one that always tickles me is the 100% win rate strategy that someone automated and for a few hundred dollars, it's all yours!!
Look, if there was a silver bullet, a 100% winning strategy you could buy off the shelf - we wouldn't have any other profession on the planet! The world's population would be professional traders. You know the saying " if it sounds too good to be true, it probably is".
You see Elliott waves where they have no right to be. Simply no logic or using them on a tick chart and hoping for miracles.
How about getting some financial advice from a spotty teen who rented a sports car for a video shoot this afternoon? Yeah, sounds like a good plan to help you retire young!
==============================
So, how to avoid all of these things?
Well, to start with, your tradingview chart, on a regular laptop or desktop with one screen, removing all the indicators and increasing the timeframe.
Then you reduce the number of pairs you look at and get to know them. Treat them like a new language. Learn the character traits, how they behave around major news events, what happens to them if the dollar goes up or oil drops 5%.
Don't treat trading like a game.
Instead, treat it like a business, use hours that suit your lifestyle. Deploy proper risk management. Don't see it as a one trade one win type concept. Treat it with respect and profit from it weekly.
You will find, when you learn to manage risk correctly, you care very little about markets going up or down. You tend to sleep with ease and a growing bank balance.
The market has plenty of soldiers fighting on its side, and it does its best to recruit you to fight against yourself!
In summary, less screens, less data inputs (indicators), less instruments, higher timeframes, ignore the influencers, Proper risk management and learn to understand there is no silver bullet.
Trading is statistics and that's all it is.
You can be very profitable with a low strike rate and a large risk-to-reward ratio. Or as simple as a 2% gain per 1% loss and a 50/50 win rate still makes you money!
Disclaimer
This idea does not constitute as financial advice. It is for educational purposes only, our principal trader has over 25 years' experience in stocks, ETF's, and Forex. Hence each trade setup might have different hold times, entry or exit conditions, and will vary from the post/idea shared here. You can use the information from this post to make your own trading plan for the instrument discussed. Trading carries a risk; a high percentage of retail traders lose money. Please keep this in mind when entering any trade. Stay safe.

$COIN Price Action playing out exactly as expected!NASDAQ:COIN price action is following the plan laid out a few weeks ago.
After the momentous rally into all time high I was expecting price to have a deep retracement to the weekly pivot point also the golden pocket Fibonacci retracement $240. That is what we got! This values would correspond with a swing below the major High Volume Node support resetting daily and weekly RSI. Daily RSI is already oversold so I am expecting a bounce for wave B of this wave 2 corrective wave with a target of the $350 High Volume Node major resistance.
The weekly 200EMA is ascending and may meet us in the same area adding confluence but this would take a lot longer to play out.
Alternatively, there is also a gap at $215-230 that never got filled at the larger degree golden pocket which would have me upgrade this pullback to wave 2 instead of wave 4.
Bitcoin stocks have all had a decent retracement causing me to upgrade my Elliot Wave count to a completed macro wave 1 with wave 2 now underway, suggesting the best returns are still to come over the next months for this category asset class in wave 3!
Analysis is invalidated if we go to new highs or lose $140. New long signals are certainly building in the DEMA PBR and Price Action strategies so keep an eye out on the Trade Signals Substack as we have made very food profits lately in these markets!
Safe trading

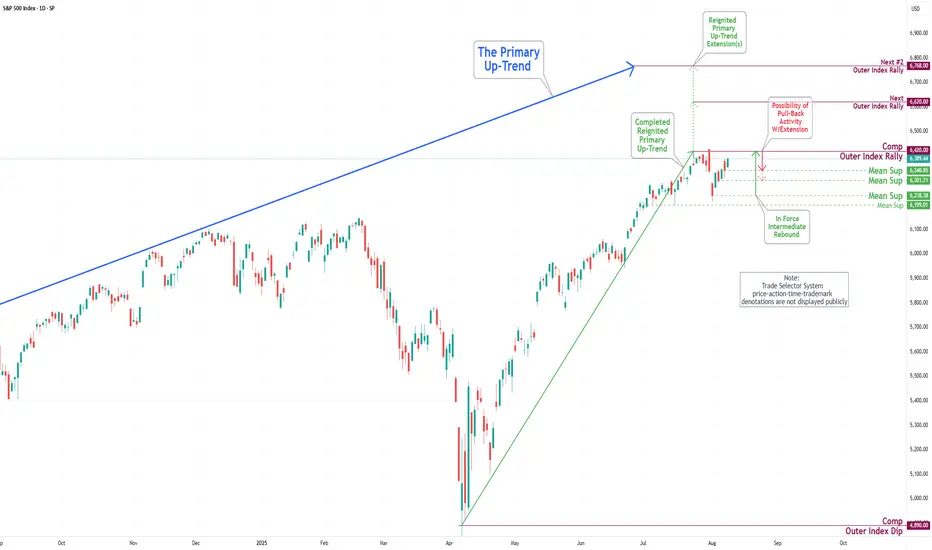
S&P 500 Daily Chart Analysis For Week of August 8, 2025Technical Analysis and Outlook:
During the trading activity of the previous week, the S&P 500 Index exhibited a predominantly bullish trend and is poised to retest the completed Outer Index Rally target of 6420, as outlined in last week’s Daily Chart Analysis. The primary objective now is to target subsequent levels, specifically the next Outer Index Rally target of 6620 and beyond.
It is crucial to recognize that the current price movement may initiate a substantial pullback from the present price action, either before or following the attainment of the Outer Index Rally peak at 6420.
NDX & SPX , Stay heavy on positionsNDX & SPX , Stay heavy on positions. (QLD, TQQQ)
Despite the rebound, the market remains tilted toward hedging and caution.
In stay light on positions zones, I hold QQQ and reduce exposure.
In stay heavy on positions zones, I increase allocation using a mix of QLD and TQQQ.

This V-Pattern on SPX500 Is Stupid CleanHey, it’s Skeptic.
In this video, I’m breaking down a clean V-pattern setup on SPX500 — right in line with what I taught in yesterday’s educational post.
We’re starting from the Daily time frame and walking through the logic behind my long trigger, why the previous fakeout was actually useful, and how to set your stop-loss depending on your trading style (H4 vs 15min).
This isn’t just chart talk — it’s about reading the story behind the candles.
If it helped you see things clearer, give it a boost and drop your thoughts below.
Let’s keep learning — one trap at a time.
Until next time, peace out.
📌 Disclaimer: This video is for educational purposes only and does not constitute financial advice. Always do your own research and manage your risk.

SPX500 at Key Pivot – Bearish Below 6365, Bullish AboveSPX500 – Market Overview
U.S. stock index futures rose on Friday after President Donald Trump’s temporary pick for a Federal Reserve governor boosted expectations for a more dovish central bank board.
Technical Outlook
Stability below 6365, we expect a move down toward 6341.
A 1H close below 6321 would likely extend the bearish trend toward 6301.
A 1H close above 6365 could trigger a push toward 6389.
A confirmed break above 6389 would shift the bias to bullish, targeting 6425 and 6453.
Pivot Line: 6365
Resistance: 6389 – 6425 – 6453
Support: 6341 – 6321 – 6301

Day 4 — Trading Only S&P Futures — +$207, Patience Pays OffWelcome to Day 4 of Trading Only S&P Futures!
After two tough losing days, I took a morning yoga session to clear my mind and approach the market calmly. I started trading late but found a strong A+ setup near 6355, aligned with a major gamma zone and RSI signals, which led to a $200+ profit.
📈 What you’ll learn
The importance of mindset and mental clarity in trading
How to identify strong setups using market structure and gamma zones
Reading RSI on multiple timeframes for confirmation
Managing risk and knowing when to call it a day
⏰ Timestamps
0:00 — Intro & Day 4 Overview
0:30 — Mindset Reset & Trade Recap
1:30 — VX Algo Signal Recap & Setup Breakdown
3:00 — Market News & Impact
3:30 — Key Levels for Tomorrow
4:00 — Closing Thoughts & Next Steps
🔔 VX Algo Signals (9:30am – 2pm EST)
9:39 AM Market Structure flipped bullish on VX Algo X3!
11:20 AM VXAlgo ES X1 Buy signal (triple buy)
11:52 AM VXAlgo ES X1 Buy signal
12:40 PM VXAlgo ES X1 Sell signal
📰 News Highlights
U.S. jobless claims rose to 226,000 vs. estimate 221,000, signaling increased layoffs.
🔑 Key Levels for Tomorrow
Above 6332 = Remain Bullish
Below 6315 = Bearish

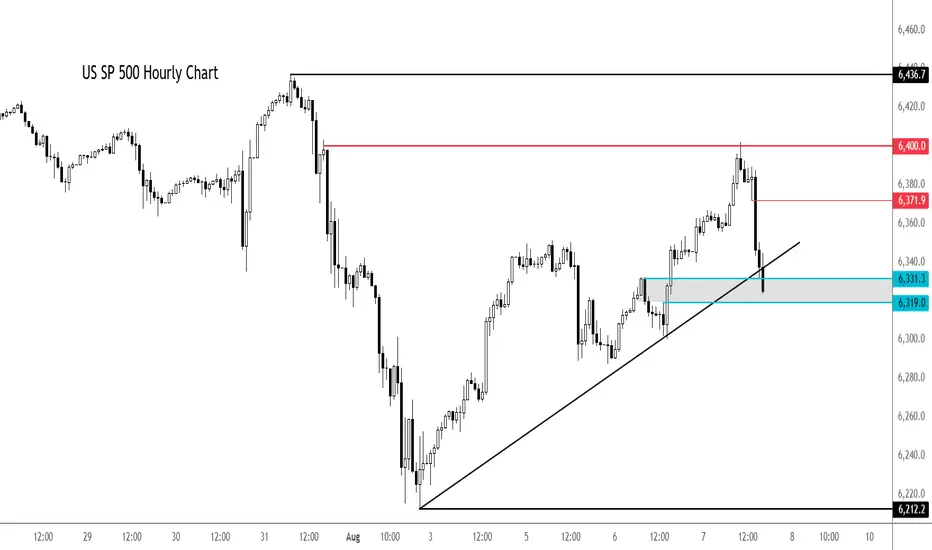
S&P 500 extends drop - can dip buyers come to rescue again?After a decent rally earlier in the day, the major indices and futures started to ease off around mid-morning London trade, before easing further lower in the last couple of hours.
At the time of writing, the S&P was testing its session lows. Here it was probing support and a short-term bullish trend line in the 6319-6331 range. This area needs to hold to keep the bulls happy and in charge. Break this and we could see a bigger correction in the days ahead.
Resistance now comes in at 6372 followed by 6,400.
By Fawad Razaqzada, markets analyst with FOREX>com
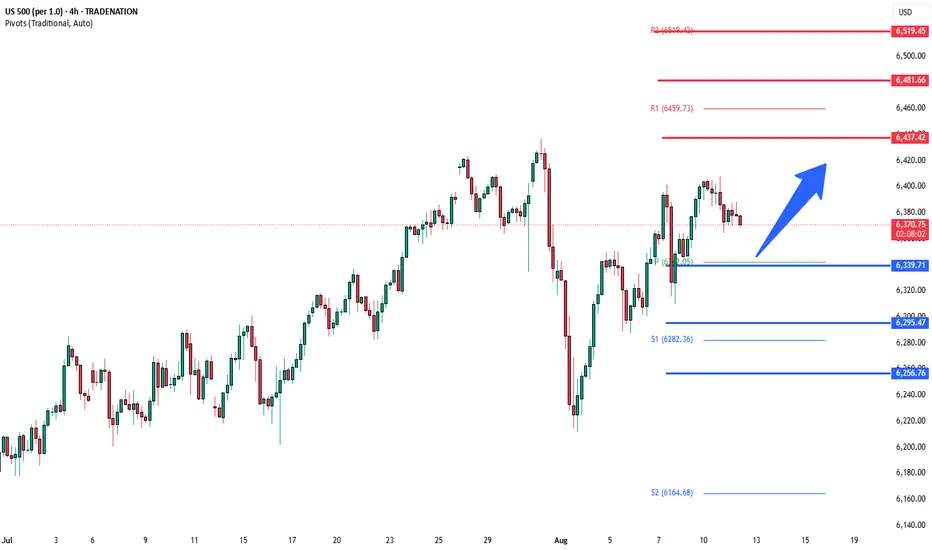
S&P bullish continuation supported at 6340Tariff Turmoil and Geopolitical Shifts – Implications for S&P 500 Trading
Donald Trump's sweeping new tariffs officially took effect, hitting nearly all U.S. trading partners. Switzerland, facing the steepest rates among developed nations, may retaliate by cancelling a major fighter jet purchase, signaling potential defense-sector implications.
Key developments:
Semiconductor imports to face 100% tariffs, unless production is moved onshore – a bullish signal for domestic chipmakers (e.g., Intel, GlobalFoundries) but negative for firms reliant on overseas fabs.
Additional tariffs floated on China over purchases of Russian oil, echoing similar penalties on India – suggesting growing fragmentation in global trade.
Market impact:
S&P 500 sectors likely affected:
Tech (Semis): Tariff pressure may weigh on multinationals like Nvidia or AMD short term, but benefit domestic fabs and U.S.-based supply chains.
Industrials/Defense: Swiss retaliation could ripple through defense contractors if deals are halted.
Energy/Commodities: Any China-Russia oil tensions could lead to energy volatility, affecting names like ExxonMobil or ConocoPhillips.
Meanwhile, China’s exports unexpectedly rose, softening the blow from the U.S. tariff crackdown. Chinese equity gains could calm broader EM sentiment, helping mitigate global risk-off contagion.
Finally, Trump signaled potential peace talks with Putin and Zelenskiy, with the Kremlin confirming a Putin meeting soon. A diplomatic breakthrough could ease geopolitical risk, supporting investor sentiment and equities globally.
Bottom Line for S&P 500:
Expect sector rotation as traders digest tariff fallout. Watch for:
Strength in domestically focused tech and defense stocks
Caution around globally exposed industrials and semis
Short-term volatility tied to trade rhetoric and geopolitical headlines
Key Support and Resistance Levels
Resistance Level 1: 6437
Resistance Level 2: 6480
Resistance Level 3: 6520
Support Level 1: 6340
Support Level 2: 6295
Support Level 3: 6256
This communication is for informational purposes only and should not be viewed as any form of recommendation as to a particular course of action or as investment advice. It is not intended as an offer or solicitation for the purchase or sale of any financial instrument or as an official confirmation of any transaction. Opinions, estimates and assumptions expressed herein are made as of the date of this communication and are subject to change without notice. This communication has been prepared based upon information, including market prices, data and other information, believed to be reliable; however, Trade Nation does not warrant its completeness or accuracy. All market prices and market data contained in or attached to this communication are indicative and subject to change without notice.
