S&P500 sideways consolidation resistance at 6520Summary:
The S&P 500 (-0.01%) slipped for a second consecutive session, dragged by weakness in tech.
The Magnificent 7 (-0.16%) edged lower, with Intel (-3.66%) among the worst performers on reports of a potential 10% US government stake, partly offset by news that SoftBank will buy $2bn in Intel shares.
Broader sentiment was weighed down by a hawkish rates re-pricing and a weaker-than-expected NAHB housing market index (32 vs. 34 expected).
There were some bright spots: the Russell 2000 (+0.35%) outperformed, and Europe’s STOXX 600 (+0.08%) inched up to a 3-month high.
Geopolitics remained in focus as Trump pushed for a summit between Putin and Zelenskiy, with US and EU officials moving on security guarantees for Ukraine.
Conclusion for S&P 500 trading:
The index remains under mild pressure, reflecting rate concerns and housing weakness, while Intel headlines added volatility to tech. Broader market resilience—highlighted by small-cap outperformance—suggests downside is limited in the near term, but the S&P 500 may stay range-bound until clearer signals emerge on rates and housing momentum.
Key Support and Resistance Levels
Resistance Level 1: 6520
Resistance Level 2: 6580
Resistance Level 3: 6637
Support Level 1: 6400
Support Level 2: 6372
Support Level 3: 6340
This communication is for informational purposes only and should not be viewed as any form of recommendation as to a particular course of action or as investment advice. It is not intended as an offer or solicitation for the purchase or sale of any financial instrument or as an official confirmation of any transaction. Opinions, estimates and assumptions expressed herein are made as of the date of this communication and are subject to change without notice. This communication has been prepared based upon information, including market prices, data and other information, believed to be reliable; however, Trade Nation does not warrant its completeness or accuracy. All market prices and market data contained in or attached to this communication are indicative and subject to change without notice.
S&P 500 (SPX500)

Resideo Technologies, Inc. ~ Bullish (Short-term)...Resideo Technologies, Inc. engages in the manufacture and development of technology-driven products and solutions that provide critical comfort, energy management, water management, and safety and security solutions to residential and commercial markets. It operates through the Products and Solutions, and ADI Global Distribution segments. The Products and Solutions segment offers temperature and humidity control, thermal water and air solutions, as well as security panels, sensors, peripherals, communications devices, video cameras, other home-related lifestyle convenience solutions, cloud infrastructure, installation, and maintenance tools, and related software. The ADI Global Distribution segment provides low-voltage security products including security and life safety, access control and video products and participates significantly in the broader related markets of smart home, power, audio, ProAV, networking, communications, wire and cable, and data communications. The company was founded on April 24, 2018 and is headquartered in Scottsdale, AZ.

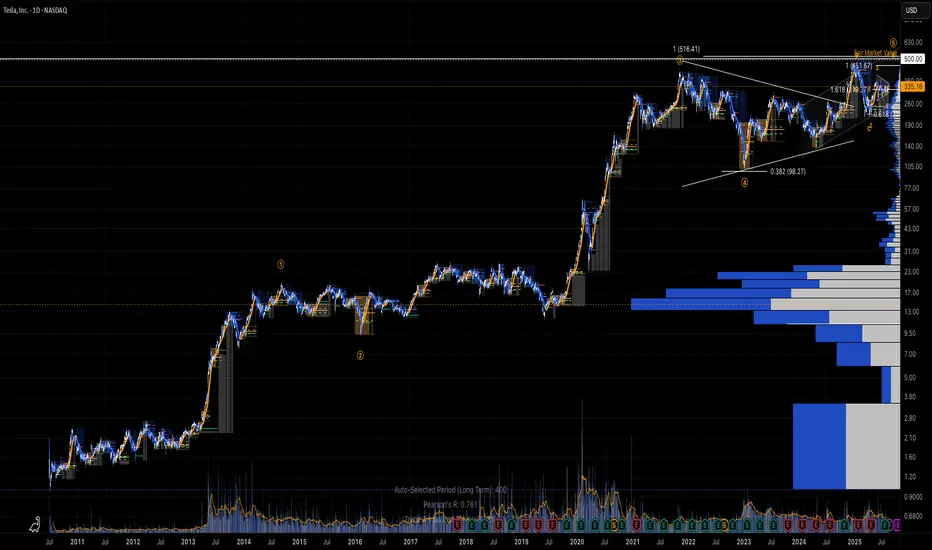
Tesla, Inc. $TSLA ~ Very Concerning (Not much left)...Tesla, Inc. engages in the design, development, manufacture, and sale of electric vehicles and energy generation and storage systems. It operates through the Automotive and Energy Generation and Storage segments. The Automotive segment includes the design, development, manufacture, sale, and lease of electric vehicles as well as sales of automotive regulatory credits. The Energy Generation and Storage segment is involved in the design, manufacture, installation, sale, and lease of solar energy generation, energy storage products, and related services and sales of solar energy systems incentives. The company was founded by Jeffrey B. Straubel, Elon Reeve Musk, Martin Eberhard, and Marc Tarpenning on July 1, 2003 and is headquartered in Austin, TX.
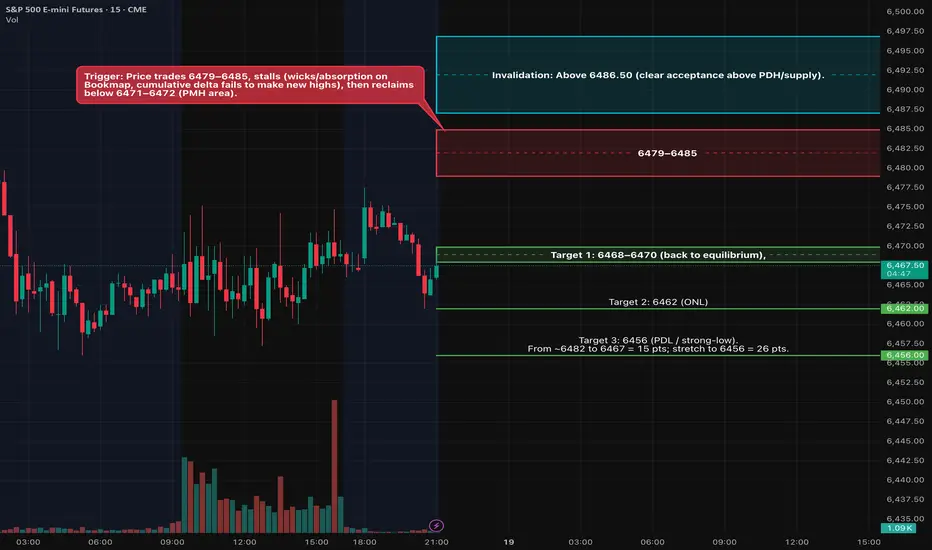
ES Analyses 08/19 Rejection short from 6479–6485 (OB + PDH)Fundamentals (what can move ES)
• 08:30 ET – U.S. New Residential Construction (Housing Starts/Permits). First move risk right at the print; can nudge yields and risk appetite. We’ll let the initial spike settle and then act on the HTF levels below. 
⸻
Key levels from your charts
Numbers rounded to the quarter where needed.
• PDH: 6484.25
• PDL: 6456.00
• ONH: 6475.25
• ONL: 6462.00
• RTH VWAP (today): 6466.50
• PMH / Asia H cluster: 6470.5–6471.75
• 30-min supply / OB: 6479–6485 (overlaps PDH)
• Liquidity/defense zone (“strong low”/Mon swing): 6452–6456
Think of 6468–6472 as the intraday “equilibrium” band we’ve been ping-ponging around; acceptance away from this band is what should start the 15+ pt drive.
Context: We press into the 30-min supply shelf that capped NYPM today.
Trigger: Price trades 6479–6485, stalls (wicks/absorption on Bookmap, cumulative delta fails to make new highs), then reclaims below 6471–6472 (PMH area).
Entry style: Stop-market on the reclaim or limit into a micro pullback after the failed pop.
Invalidation: Above 6486.50 (clear acceptance above PDH/supply).
Targets:
6468–6470 (back to equilibrium),
6462 (ONL),
6456 (PDL / strong-low).
From ~6482 to 6467 = 15 pts; stretch to 6456 = 26 pts.
Order-flow tells: Offers replenish 6480–6485; iceberg/absorption on up-ticks; delta divergence into the level.
Timing
08:30 ET data: stand aside for the first 2–5 minutes; let the impulse show its hand, then look for our triggers.
Federal Reserve Bank of New York
NY AM window: 09:45–11:30 ET.
NY PM window: 13:30–15:30 ET (if morning doesn’t give clean structure).
SPX Weak Bearish Bias → 6440P Caution Trade
# 🏦 SPX Weekly Options Analysis – 8/18
📉 **Market Context**
* Mixed signals across metrics → weak bearish bias
* Price below VWAP → potential short-term downside
* Volume insufficient → low conviction
* Call/Put ratio neutral → no strong directional bias
---
## 🎯 Trade Setup (Cautious Put)
* **Instrument**: SPX
* **Direction**: PUT (SHORT)
* **Strike**: 6440
* **Expiry**: 2025-08-18
* **Entry Price**: \$0.60
* **Profit Target**: \$1.20
* **Stop Loss**: \$0.30
* **Size**: 1 contract
* **Confidence**: 60%
* **Entry Timing**: Market Close
---
## 📈 Breakeven @ Expiry
👉 6439.40 (Strike – Premium)
SPX must **close < 6439.40 by market close** to profit at expiry.
---
## 🧠 Key Risks
* Mixed signals → potential whipsaw ⚡
* Market structure unclear → downside not guaranteed
* Theta decay risk → short-term option, fast time decay
---
# ⚡ SPX 6440P SHORT PLAY ⚡
🎯 In: \$0.60 → Out: \$1.20
🛑 Stop: \$0.30
📅 Exp: 8/18
📈 Bias: Weak Bearish, trade cautiously 🐻
---
📊 **TRADE DETAILS JSON**
```json
{
"instrument": "SPX",
"direction": "put",
"strike": 6440.0,
"expiry": "2025-08-18",
"confidence": 0.60,
"profit_target": 1.20,
"stop_loss": 0.30,
"size": 1,
"entry_price": 0.60,
"entry_timing": "close",
"signal_publish_time": "2025-08-18 15:02:25 UTC-04:00"
}

SPX: absorbed tariffsThe US equity markets continue to be supported by positive market sentiment. The closely watched macro data during the previous week was July inflation, which was 0,2% for the month and fully in line with market estimates. It seems that for the moment, the US economy is ready to absorb the burden of increased trade tariffs and keep inflation within lower levels without too much oscillation. Such development is increasing market expectations that the Fed might cut interest rates in September. Although the index closed the week lower, still, during the week, the S&P 500 reached another all time highest level at 6.475 on Wednesday. The index closed the week at 6.449 on Friday. Analysts are noting that this correction occurred due to weaker consumer sentiment as posted by the University of Michigan on Friday. At the same time, inflation expectations for this year and for the period of next five years have modestly increased.
Considering a new ATH, some profit taking might occur during the week ahead, which could impact modest correction in index. However, considering continuous relatively stable inflation and strong demand posted during July, despite trade tariffs, analysts are noting that the market optimism will continue. For the week ahead, it should be also considered that a yearly Jackson Hole Economic Policy Symposium will be held 21-23 August, where Fed Chair Powell is expected to hold a speech. This event is both well covered by the media and closely watched by investors, looking for an indication of a potential future move on a monetary policy side.
PX500 | Fed in Focus as Geopolitics Drive VolatilitySPX500 Overview
Geopolitics dominates before the Fed takes the stage.
Putin’s stance appears to be that Ukraine should give up not only the territory Russia has taken, but also areas it has failed to capture after more than three years of fighting. This has been repeatedly rejected by Zelenskiy and European leaders, who will stand alongside him in Washington when he meets Trump later today.
Technical Outlook:
The price is expected to test 6425. A 1H close below this level would extend the bearish move toward 6389 and 6366.
To resume the bullish trend, the price must close a 4H candle above 6468, opening the way to higher resistance levels.
Support: 6425, 6389, 6366
Resistance: 6468, 6488, 6528

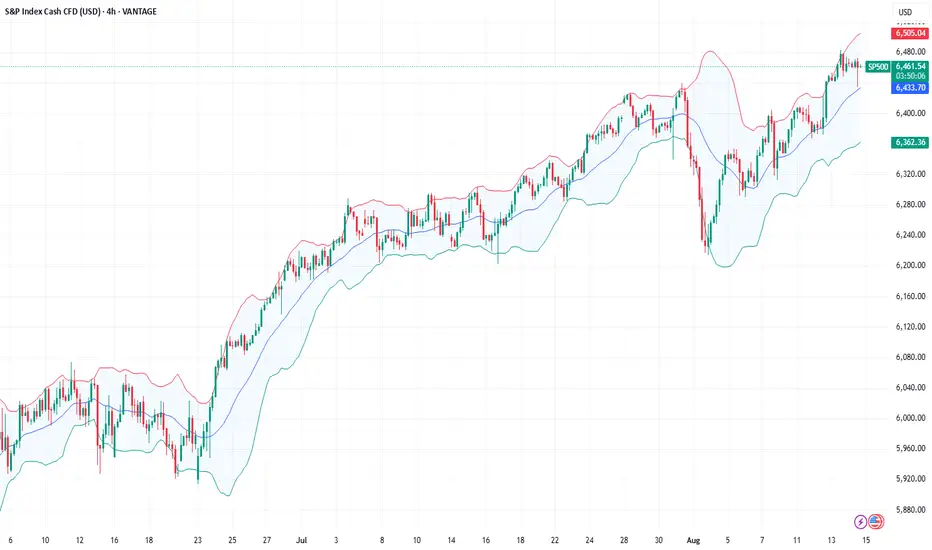
ES (S&P 500 Futures) - Week Plan Aug 18–22Context (W/D/4H/1H/30M): ES is consolidating just under 6,500. Price is boxed roughly 6,466 ↔ 6,504/12 with a cluster of highs above and recurring demand tests below.
Key Levels (zones, not single ticks):
Resistance: 6,504–6,512 (near-term lid). Above that: 6,520–6,550 (weekly supply/“weak high”).
Decision level: 6,492–6,495 (where control often flips intraday).
Supports: 6,464–6,466 (first support) → 6,436–6,440 → 6,380–6,395 (deeper support).
How to read it:
Bull path: A firm break and hold above 6,504 favors a push toward 6,520 → 6,535 → 6,550.
Bear path: Failure at 6,495 or a clean break below 6,464 opens 6,440 → 6,390.
If price stays between 6,466 and 6,504, expect range behavior until a catalyst pushes it out.
Scenarios (next week):
Range continues: Chop between 6,466–6,512 until mid-week events.
Upside break: Hold above 6,504 → test 6,520–6,550 (watch for reaction there).
Downside break: Lose 6,464 with momentum → 6,440, then 6,390 if pressure persists.
Key events (ET):
Wed: Federal Reserve meeting minutes (afternoon).
Thu: Weekly claims; flash PMIs; existing home sales (morning block).
Thu–Sat: Jackson Hole economic symposium (watch for policy remarks).
Notes: Levels are zones and may see initial reactions before acceptance or rejection. This post is for market commentary/education only.

Technical Analysis for US500 (S&P 500)Closing Price: 6447.8 (16th Aug 2025, 12:50 PM UTC+4)
Analysis Methods: Japanese Candlesticks, Harmonic Patterns (ABCD, M/W), Elliott Wave, Wyckoff, Gann Theory (Time/Square of 9/Angles), Ichimoku, RSI, Bollinger Bands, VWAP, Moving Averages (MA/EMA/SMA/WMA).
---------------------------------------------------------------------------------------------
1. Long-Term Trend (Weekly/Monthly)
Elliott Wave:
US500 is in Wave 5 of a bull cycle (Wave 3 peak: 6500, Wave 4 dip to 6200).
Target: 6600–6700 (1.618 extension of Wave 1).
Gann Price Forecasting:
Square of 9: √6447.8 ≈ 80.30 →
Key resistance: 81² = 6561, support: 80² = 6400.
Break above 6561 targets 6724 (82²).
Ichimoku (Monthly):
Tenkan/Kijun: Bullish crossover (Tenkan: 6300 > Kijun: 6200).
Cloud: Price above Senkou Span (6100–6250) – bullish structure.
Moving Averages:
Weekly SMA(200): 6100 (major support).
Swing Outlook: Bullish but extended. Final Wave 5 targets 6600–6700.
2. Medium-Term Swing (4H/Daily)
Harmonic Patterns:
Bearish ABCD on Daily:
A: 6500 → B: 6350 → C: 6450 → D: 6470–6490 (1.272 BC extension).
Bullish Gartley (M Pattern) near 6350 (0.786 XA retracement).
Wyckoff Phase:
Distribution above 6450:
Upthrust at 6470 (16th Aug) on fading volume.
Lack of demand above 6460.
Gann Theory:
Time Window: Aug 19–22 (Square of 9 reversal cluster).
Price-Time Squaring: 6447.8 aligns with Aug 16 – consolidation likely.
Gann Angle: 1x1 support at 6420.
Indicators:
RSI(14) + Bollinger Bands (Daily):
RSI: 66 (neutral-bullish).
Price hugging upper BB(20,2) at 6475 – band expansion signals volatility.
VWAP (Weekly): 6380 (swing support).
Swing Trade Setup:
Short near 6470–6490 → Target 6400. Stop-loss: 6520.
Long near 6350 → Target 6500. Stop-loss: 6300.
3. Intraday Outlook (5M–4H)
Key Levels:
Resistance: 6460 (Gann 1x1), 6475 (daily high), 6490 (ABCD target).
Support: 6440 (VWAP), 6430 (Ichimoku cloud), 6420 (Gann angle).
Indicators:
Ichimoku (1H):
Tenkan: 6445, Kijun: 6435 → Price above both (weak bullish).
Cloud: Thin bullish (6425–6435) – intraday support.
RSI + Bollinger Bands (1H):
RSI(14): 59 (neutral).
Price testing mid-BB(20,2) at 6445 – break below signals bearish shift.
VWAP + MAs:
VWAP: 6442 (intraday pivot).
EMA(20): 6448 (resistance).
Candlestick Patterns:
4H Bearish Engulfing at 6465 → Reversal signal.
1H Evening Star at 6460 → Confirms weakness.
Gann Intraday Squaring:
Time Cycle: 14:00–16:00 UTC+4 (NY open) for volatility.
Price Harmony: Close below 6445 targets 6430 → 6420.
Intraday Trade Plan:
Sell below 6445 → Target 6430 (VWAP) → 6420 (Gann support).
Buy above 6465 only if RSI <65 → Target 6475.
Stop-Loss: 10–15 points.
Summary of Key Signals
Time Frame Bias Entry Target Stop-Loss
Intraday Bearish <6445 6440-6445 6420-6430 6455
Swing Bullish 6350-6370 6450-6500 6300
Swing Bearish 6470-6485 6400-6420 6520
Critical Events:
Gann Reversal Window: Aug 19–22 (watch for Fed minutes/Nvidia earnings).
Daily Close >6500 invalidates bearish patterns and targets 6561.
Risk Note: US500 is highly sensitive to tech earnings and Fed policy. Use tight stops during events.
Disclaimer: Technical analysis reflects historical patterns, not guarantees. Fundamental catalysts can override signals. Always use risk management.
For those interested in further developing their trading skills based on these types of analyses, consider exploring the mentoring program offered by Shunya dot Trade .( world wide web shunya dot trade )
I welcome your feedback on this analysis, as it will inform and enhance my future work.
Regards,
Shunya.Trade
world wide web shunya dot trade
⚠️ Disclaimer: This post is educational content and does not constitute investment advice, financial advice, or trading recommendations. The views expressed here are based on technical analysis and are shared solely for informational purposes. The stock market is subject to risks, including capital loss, and readers should exercise due diligence before investing. We do not take responsibility for decisions made based on this content. Consult a certified financial advisor for personalized guidance.

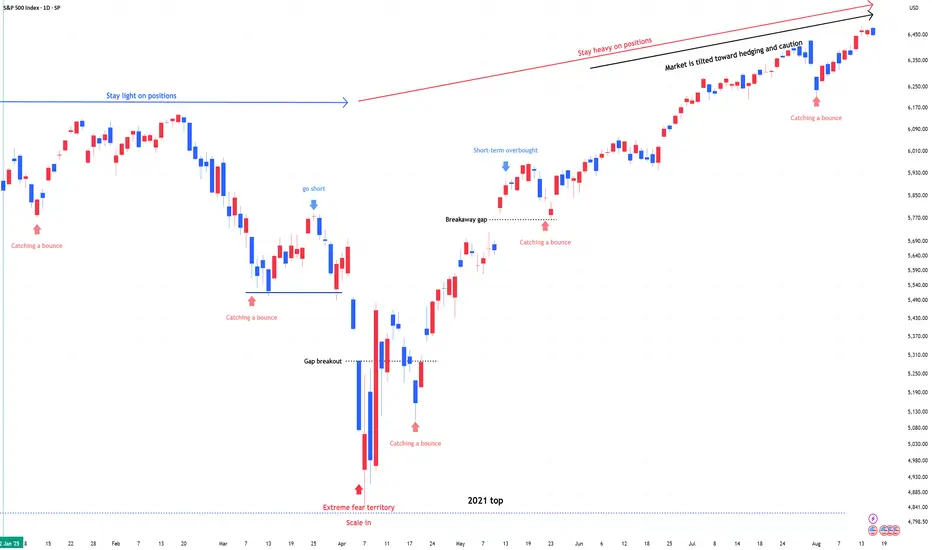
SPX & NDX , Stay heavy on positions.SPX & NDX , Stay heavy on positions. (2x leverage)
Same view as before. No change.
While the market continues to break all-time highs, market participants remain cautious.
Some are even anticipating a pullback in September, and overall, expectations for a correction are widely present.
** This analysis is based solely on the quantification of crowd psychology.
It does not incorporate price action, trading volume, or macroeconomic indicators.
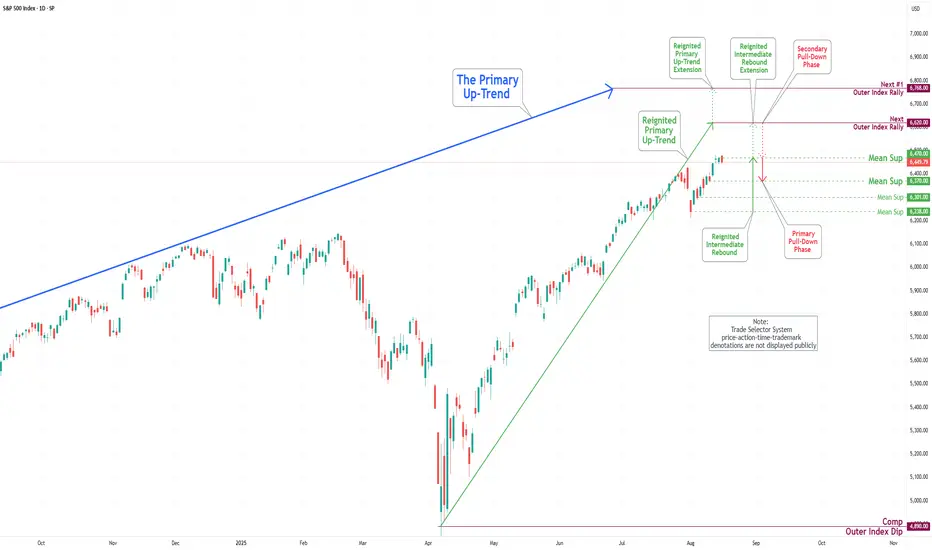
S&P 500 Daily Chart Analysis For Week of August 15, 2025Technical Analysis and Outlook:
During the trading activity of the previous week, the S&P 500 Index exhibited a predominantly robust bullish trend, achieving a noteworthy marker by retesting the completed Outer Index Rally target of 6420, as outlined in last week’s Daily Chart Analysis. The primary objective now is to target the subsequent level, labeled the Outer Index Rally target, of 6620. On the downside, it is crucial to recognize that the current price movement is prone to retreat to Mean Support 6370 before the upward trajectory resumes.
SPX500 | Consolidation at Record Highs – Key Pivot 6468S&P 500 at Record Highs on September Rate Cut Hopes
Futures tracking the S&P 500 and Nasdaq held at record highs on Wednesday, supported by growing expectations that the Federal Reserve could resume its monetary policy easing cycle next month.
Technical Outlook:
The price is expected to consolidate between 6468 and 6425 until a breakout occurs.
Stability below 6468 would favor a bearish move toward 6425.
A 1H close above 6468 could push the price higher toward 6528.
Pivot: 6468
Support: 6437, 6425, 6389
Resistance: 6490, 6500, 6528

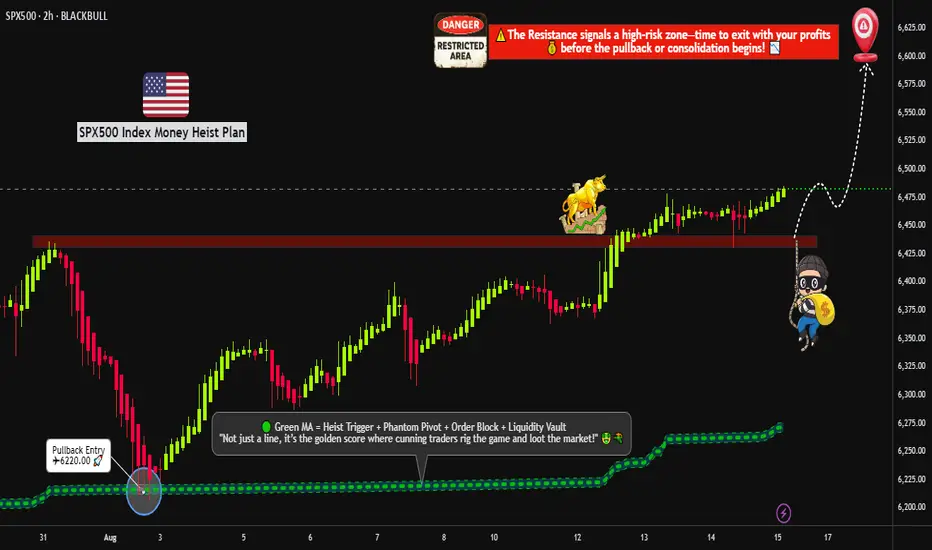
"US500 BREAKOUT – TIME TO LOAD LIMIT ORDERS FOR THE PUMP?"🔥🦹♂️ "SPX500 BANK HEIST – LAYERED BULL RAID IN PROGRESS!" 💰📈
(Thief Trader’s Multi-Limit Order Bullish Ambush – No Weak Hands Allowed)
📍 ASSET: US500 / SPX500 (S&P 500 INDEX)
🎯 HEIST PLAN: BULLISH BREAKOUT
💣 ENTRY: ANY PRICE LEVEL (Thieves use Layered Limit Orders – adapt like a pro!)
🔫 SAMPLE LAYERS: (Scale in like a boss!)
BUY LIMIT LAYER 1: 6475.00
BUY LIMIT LAYER 2: 6460.00
BUY LIMIT LAYER 3: 6440.00
(Add more layers if needed – flexibility is key!)
🛑 STOP LOSS: 6400.00 (Thief’s Emergency Exit – adjust based on your risk!)
🎯 TARGET: 6600.00 (First profit zone – trail or take gains!)
🦹♂️ THIEF TRADER’S MASTER PLAN:
"We don’t ask for permission – we take profits."
🔹 ENTRY TACTICS:
Use multiple limit orders (LAYERED STRATEGY) – like planting timed explosives at key levels.
No panic entries – thieves strike with precision, not emotion.
DCA if needed – but keep bullets for the real move.
🔹 STOP LOSS RULES:
6400 = Danger Zone – if price breaks, abort mission & regroup.
SL too tight? You’ll get stopped out by market noise. SL too wide? You’ll bleed. Find balance.
🔹 TAKE PROFIT STRATEGY:
First TP @ 6600 – secure partial profits.
Let runners ride with trailing stop – or full exit if momentum fades.
🚨 THIEF’S GOLDEN RULES:
✅ Only LONG – no revenge shorts, no greed traps.
✅ Trade in SILENCE – avoid high-impact news (CPI, NFP, Fed).
✅ Risk management = Survival – don’t blow your account on one play.
✅ BOOST & SHARE – if this plan helps, spread the word!
📢 FINAL WARNING:
"This is not financial advice – it’s a thief’s blueprint.
Plan your escape before entry. Market heists require discipline."
💬 COMMENT "ROBBING SPX" if you’re in!
🔥 LIKE & BOOST if you ride with the Thief Trader crew!
🦹♂️ THIEF TRADER OUT.
💸 STEAL SMART. GET RICH. REPEAT.
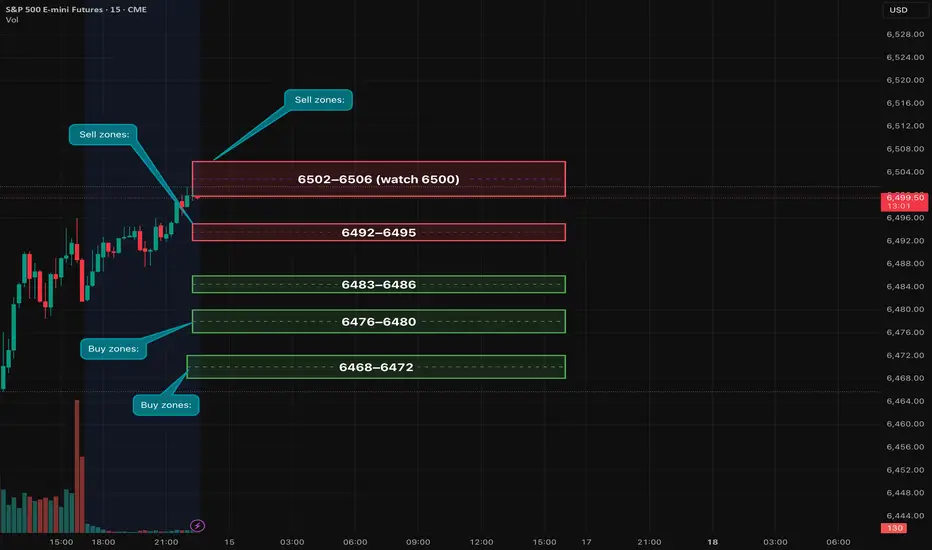
ES1! Plan — Fri Aug 15 | OPEX + U. Mich (10:00 ET). Key levelsES held above 6480 and is pressing into 6490s ahead of monthly OPEX and U. Michigan Sentiment at 10:00 ET. Yesterday’s hot PPI (3.3% YoY) keeps rates sticky; 6500 is a logical magnet/pin.
Levels:
• Sell zones: 6492–6495, 6502–6506 (watch 6500).
• Buy zones: 6483–6486, 6476–6480, 6468–6472.
A++ Setups (≥15-pt TP1):
1. Short 6492–6495 (or 6502–6506) on absorption + LH/ChoCH → TP1 6477–6480, TP2 6468–6472.
2. Long 6476–6480 (or defended 6483–6486) on absorption + HH/VWAP reclaim → TP1 6492–6495, TP2 6502–6506.
Risk: Stop 6–8 pts beyond zones or ≥1.25× 1-min ATR past last swing. Scale 40–50% at TP1; BE+2 on balance; trail swings.
Event risk: 10:00 ET U. Mich; late-day OPEX flows (14:00–16:00) and MOC around 15:50 ET.
Not financial advice.
Summer RALLY-2025: What’s Driving #SP500 and #NQ100 Higher?Dear readers, earlier on June 25, 2025, in our article “Unexpected Surges and Drops in the Indices” we noted the U.S. economy’s readiness for bullish sentiment.
On August 12, 2025 #SP500 climbed above 6,400, and #NQ100 hit a new high above 23,800 as U.S. inflation came in softer than expected, prompting the market to believe in an imminent Fed rate cut — money became “cheaper,” making stocks more attractive. Tech giants and all things AI — chips and cloud — are in high demand and lead the gains. Many companies have reported earnings above forecasts, and buybacks are underway, supporting prices. A weaker dollar is also boosting the revenues of multinational corporations. As a result, investors are buying more aggressively, pushing indices to new records.
5 Reasons Why #S&P500 and #NQ100 Could Hold Their Ground Until the End of 2025:
Dovish Fed. Rate cuts → cheaper money → higher valuations.
AI and data center boom. Growing demand for chips, cloud, and software lifts the tech sector.
Profits + buybacks. Companies beat forecasts and repurchase shares → EPS growth and price support.
Low yields and weaker dollar. Stocks look more attractive than bonds; exporters earn more easily.
Domestic investment in the U.S. Localized production and infrastructure fuel demand for tech and industry.
The foundation of #SP500 and #NQ100 growth is profit. The earnings season added confidence: market participants liked the “breadth” of earnings beats and the resilience of margins among major issuers — the third pillar of the current rally. According to FreshForex, soft inflation and expectations of a Fed rate cut create a window of opportunity for long positions in #SP500 and #NQ100.
S&P500 bullish on rate cut betsS&P 500 hits new high on rate cut bets – The index rose +0.32% to another record as markets priced in further Fed easing. Gains were broad-based, with 421 constituents higher, while small-caps outperformed sharply (Russell 2000 +1.98%, best two-day run since April). The Magnificent 7 lagged (-0.31%), easing from Tuesday’s record.
Macro backdrop – Optimism was supported by rate cut expectations despite geopolitical tensions. Trump warned of “very severe consequences” for Russia without a ceasefire, while US Treasury Secretary Bessent urged Europe to toughen energy sanctions.
Risk appetite – Bitcoin hit a fresh record above $124,500, underscoring investor appetite for risk assets.
Takeaway for traders – Breadth-driven rally suggests underlying market strength beyond mega-caps, with small-cap momentum potentially spilling over into the broader index.
Key Support and Resistance Levels
Resistance Level 1: 6520
Resistance Level 2: 6580
Resistance Level 3: 6637
Support Level 1: 6400
Support Level 2: 6372
Support Level 3: 6340
This communication is for informational purposes only and should not be viewed as any form of recommendation as to a particular course of action or as investment advice. It is not intended as an offer or solicitation for the purchase or sale of any financial instrument or as an official confirmation of any transaction. Opinions, estimates and assumptions expressed herein are made as of the date of this communication and are subject to change without notice. This communication has been prepared based upon information, including market prices, data and other information, believed to be reliable; however, Trade Nation does not warrant its completeness or accuracy. All market prices and market data contained in or attached to this communication are indicative and subject to change without notice.

Tomorrow’s Playbook: Levels, News Bias & Scenarios 08/14/2025Summary: Bias = Neutral→Bullish while above 6,464–6,466 and the 15m 200-EMA (6,459). A clean 5m/15m acceptance above 6,491/6,500 favors continuation; otherwise expect a data-driven sweep into 6,475–6,468 to test demand.
Scenarios & Triggers (rule-based)
1) Continuation breakout
• Trigger: 5m close > 6,491 → probe 6,496–6,500.
• Validation: 15m acceptance above 6,500 (no immediate rejection).
• Targets: 6,502–6,505 first; stretch 6,512/6,520 if momentum persists.
• Management: If price reclaims 6,491 from above after a retest, momentum likely intact.
2) Rotation to demand (buy-the-dip if structure holds)
• Trigger: Rejection at 6,489–6,491 with 5m close back inside range.
• Path: 6,482 → 6,475.5 → 6,468; watch order-flow absorption or an FVG fill inside 6,464–6,466.
• Validation: Bullish 5m close from the box and 15m structure holds above 6,459.
• Targets on bounce: Return to 6,489–6,491, then 6,496–6,500.
3) Bearish flip (lower-probability without data shock)
• Trigger (strict): 15m bearish confirmation and sustained acceptance below 6,459 (15m 200-EMA).
• Path: Open the door to a deeper mean-reversion leg toward prior breakout bases (next map would be built after the break).
• Note: No shorts without that 15m confirmation per protocol.
Educational only — not financial advice.

S&P 500 Index Reaches New All-Time HighS&P 500 Index Reaches New All-Time High
The S&P 500 index set a new all-time high, climbing above the 6,460 mark. The rally in equities is a direct result of yesterday’s CPI report.
According to Forex Factory, the annual CPI remained at 2.7%, whereas analysts had forecast an increase to 2.8%. Moderate inflation readings provide stronger grounds for a Federal Reserve interest rate cut — a move President Trump has been strongly advocating.
Data from the CME FedWatch tool shows that traders now price in a 94% probability of a key rate cut in September, compared to nearly 86% the day before and around 57% a month ago. This prospect of monetary policy easing acts as a bullish driver for the stock market.
Technical Analysis of the S&P 500 Chart
On the H4 chart of the S&P 500, there are grounds to outline an ascending channel (shown in blue). The price is currently in the upper half of the channel — a sign of prevailing optimism in the market.
Following yesterday’s CPI release, the price generated a strong bullish impulse, breaking two resistance levels from below (as indicated by the arrow):
→ August high at 6,406
→ Previous all-time high around 6,440
As a result, these former resistance levels now form the 6,406–6,440 zone. We can assume that:
→ this area may act as support going forward, as buyers clearly held the advantage here;
→ the median line of the ascending channel may also provide support, having shown signs of resistance in early August before being decisively broken on yesterday’s strong impulse.
The RSI indicator is hovering near overbought territory, making the market vulnerable to corrections. However, given the improved fundamental backdrop, any pullbacks might be shallow.
In the short term, the S&P 500 may reach the upper orange line, which defines the growth trajectory from the lower to the upper boundary of the long-term ascending channel. Should the fundamental outlook be further reinforced by positive news — for example, relating to a US–Russia leaders’ meeting — the index could advance towards the upper boundary of the blue channel.
This article represents the opinion of the Companies operating under the FXOpen brand only. It is not to be construed as an offer, solicitation, or recommendation with respect to products and services provided by the Companies operating under the FXOpen brand, nor is it to be considered financial advice.

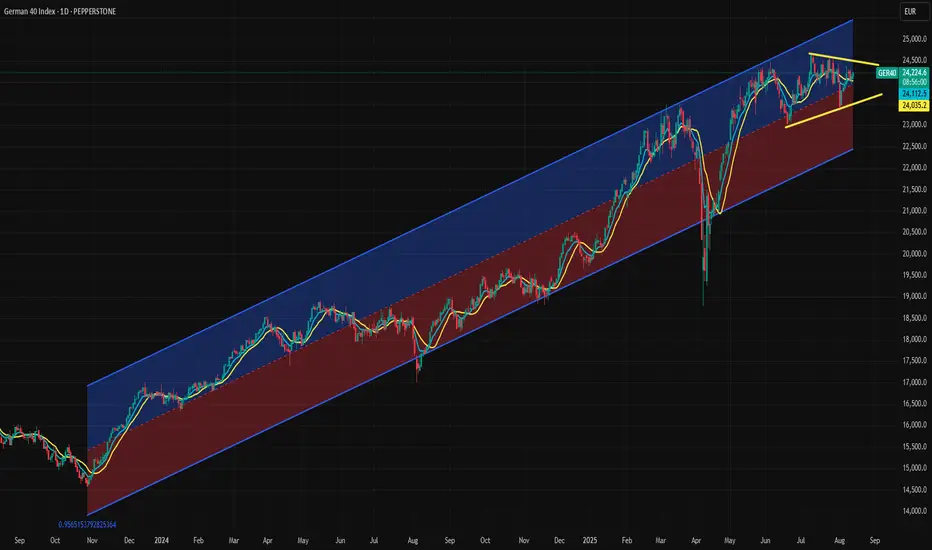
Both Technical and Valuation Signals Points Incoming VolatilityThe DAX has been moving sideways since May, with this flat movement evolving into a triangle formation since June. Price action is contracting, and the index appears to be waiting for a catalyst to determine its next direction.
The DAX is currently near the regression line from the November dip, which keeps both upward and downward possibilities open, consistent with the neutral signal from the triangle pattern.
From a valuation perspective, the DAX’s forward P/E ratio stands at 16.95x, roughly one standard deviation above its 2009-to-date regression line, making it relatively expensive compared to its own history. The S&P 500 trades at a much higher forward P/E of 24.25x, but that figure is near its own long-term regression line. Since early June, the DAX/S&P 500 ratio has fallen by nearly 10%, significantly reducing the DAX’s relative overvaluation and potentially giving it room for another leg higher.
Ultimately, the triangle formation may be the deciding factor. The current upper boundary is at 24,500, and the lower boundary is at 23,490. A break of either could bring volatility back to the DAX, with momentum likely to follow the breakout direction. An upward break could target the 24,400–24,500 zone.
S&P 500 All Round Analysis - S&P 500 Created HistoryTechnical Summary: The primary trend of the S&P 500 is bullish. On the 4H chart, the prices are trending bullish in an ascending channel formation. Prices are rising after reflecting from the lower trendline of the channel on Monday. The prices rose to an all-time high of 6445.75 after accepting support at the fib extension 0.382 at 6402.4. If prices successfully breach the immediate resistance at fib extension 0.50 at 6460.5, then it may rise to the far resistance zone between 6500 - 6518 (fib extension 0.618).
Descriptive Analysis: The S&P 500 notched a record close on Tuesday after consumer prices rose by less than expected in July, increasing the probability of the Federal Reserve cutting interest rates next month.
Data-related Projection: In the absence of key data releases today, market focus has shifted to tomorrow’s U.S. PPI report. U.S. stock markets are being underpinned by bullish sentiment, which is fueled by expectations of future rate cuts, possibly in the September Fed meeting.
Indicator Interpretation: The prices are trending higher in the buying zone of the technical indicators - above the middle Bollinger band and the mid-50 level of RSI.
ALTERNATIVE SCENARIO
Technical Confirmation: If the index fails to rise above fib extension 0.50 at 6460.5 and sustain, but falls below fib extension 0.382 at 6402.4, then further bearishness can be expected.
Facts & Figures: The S&P 500 is a very well-known index of large-cap US stocks, covering about 75% of all publicly traded US stocks. It comprises 505 stocks of 500 companies selected by a committee using 8 criteria.
Daily Pivot: 6420 (CMP: 6445.75, which is trading above the pivot level while writing the report).

Rate-cut optimism fueled risk-on mood, lifting US equities
July CPI showed little inflationary impact from tariffs, amplifying expectations for a September Fed cut. Optimism also returned for small-cap firms, previously seen as most vulnerable to tariff pressures. Headline CPI rose 2.7% YoY in July, 0.1% lower than a year earlier, with a 1.1% MoM drop in energy prices contributing to the overall decline.
BlackRock CIO Rick Rieder noted that shelter costs, the largest CPI component, slowed to their lowest since 2021, significantly boosting the odds of a September cut. He added that the Fed could take a more aggressive approach, with a 50bp cut at the September FOMC.
USTEC extended its sharp uptrend after breaching above the 23700 high. The widening gap between both EMAs indicates the potential continuation of bullish momentum. If USTEC holds above 23700, the index may gain upward momentum toward the psychological resistance at 24000. Conversely, if USTEC breaks below 23700, the index could retreat toward 23300.

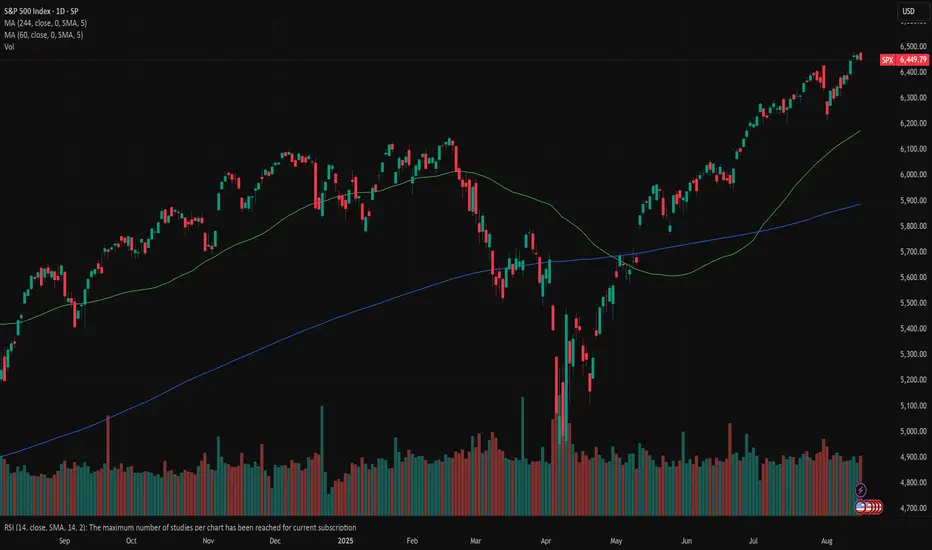
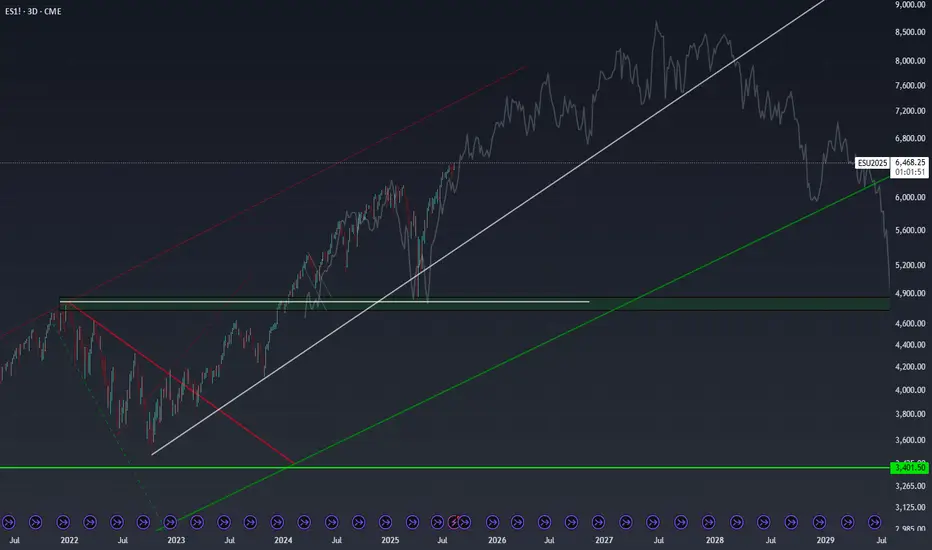
Are We Replaying the Dot Com Era?I’m completely unbiased here - more so curious - but today’s S&P 500 setup looks eerily similar to the late 1990s. In 1996 and 1997, the index posted back-to-back gains of over 20%, just as 2023 and 2024 have done. Then, in 1998, we saw a sharp 20% pullback - much like the one we’ve had in April of 2025. If you overlay that late-’90s fractal on today’s chart, the trajectory points to an S&P 500 level near 8,200 by early 2027.
The bullish case practically writes itself: strong GDP growth, resilient corporate earnings, AI-driven productivity gains, a still-accommodative liquidity backdrop, and investors willing to pay up for growth narratives—just as they did in the dot-com era. The “there is no alternative” (TINA) mentality toward equities was alive then, and it’s alive now. If the trend holds, the next couple of years could deliver staggering upside.
That said, it’s purely an observation - not a prediction. A decisive break below the key rising support trendlines would negate this bullish scenario and shift me to a cautious or neutral stance. Until then, the pattern is worth keeping an eye on.
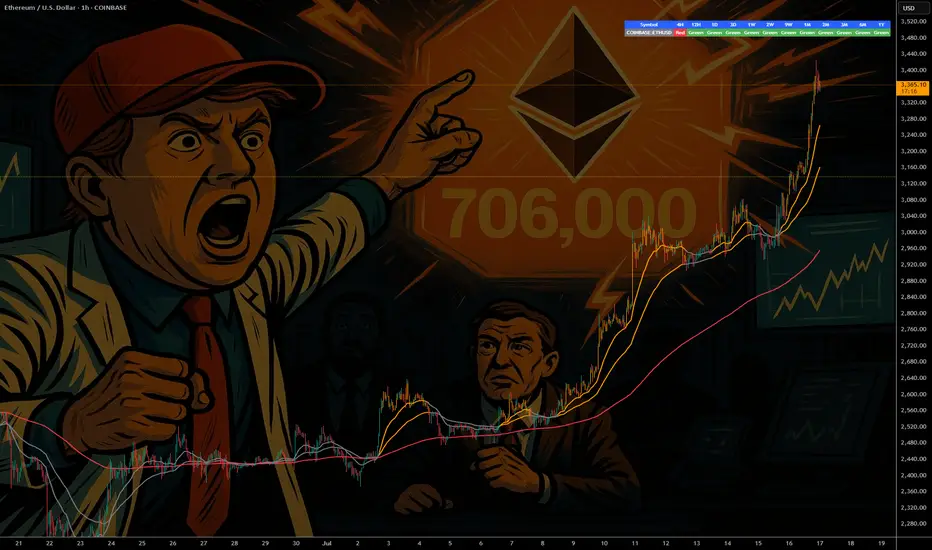
ETH - If You Know ...... You Know whats Coming
NYSE:BLK $BUIDL tokenized U.S.-Treasury fund launched on COINBASE:ETHUSD in Mar 2024—Wall Street is already settling real dollars on-chain.
NYSE:JPM JPMD stablecoin just went live on Base (an COINBASE:ETHUSD L2), piping wholesale payments from a $4 T balance-sheet straight through COINBASE:ETHUSD rails.
COINBASE:ETHUSD isn’t just riding the next crypto cycle—it’s becoming Wall Street’s settlement layer. From BlackRock’s on-chain Treasury fund to JPMorgan’s and soon Bank of America’s dollar tokens, a tidal wave of institutional stable-coin flows is lining up behind ETH. Fewer coins, more real-world volume—if you know, you know what’s coming.
NYSE:BAC CEO says they’ll issue a dollar-backed token the moment regulators nod—another tier-1 bank boarding the Ethereum train.
Stablecoin cap has blasted past $230 B , with 80 %+ of all on-chain transfers riding Ethereum (plus BSC) blocks.
Corporate settlements via stablecoins grew 25 % YoY in 2024 as multinationals replaced SWIFT with instant on-chain clearing.
Daily stablecoin throughput averages $7 B—each hop burning ETH and tightening supply.
BCG projects tokenized real-world assets to exceed $16 T by 2030 , with EVM chains as the default plumbing.
Over 500 M wallets already interact with stablecoins , a 30 % YoY surge led by emerging-market demand.
L2s like BINANCE:ARBUSDT & BINANCE:OPUSDT cut transaction fees 35 % yet still settle back to mainnet—meaning ETH captures the fee stream and the burn.
Bottom line: a tidal wave of bank-grade stablecoins + tokenized assets is lining up behind ETH; supply shrinks, demand soars—if you know, you know what’s coming.
quote] Marty Boots | 17-Year Trader — smash that , hit LIKE & SUBSCRIBE, and share your views in the comments below so we can make better trades & grow together!