SPY/QQQ Plan Your Trade Update For 8-22 : Is This The Top?This is a follow-up to my recent video to help answer questions and to share my analysis of the SPY/QQQ, Gold/Silver, and Bitcoin for all viewers.
This video also addresses the tools I use to stay on top of the swings in price movement and highlights why I believe the markets may continue to unwind from these lofty highs.
Get some.
#trading #research #investing #tradingalgos #tradingsignals #cycles #fibonacci #elliotwave #modelingsystems #stocks #bitcoin #btcusd #cryptos #spy #gold #nq #investing #trading #spytrading #spymarket #tradingmarket #stockmarket #silver
S&P 500 (SPX500)

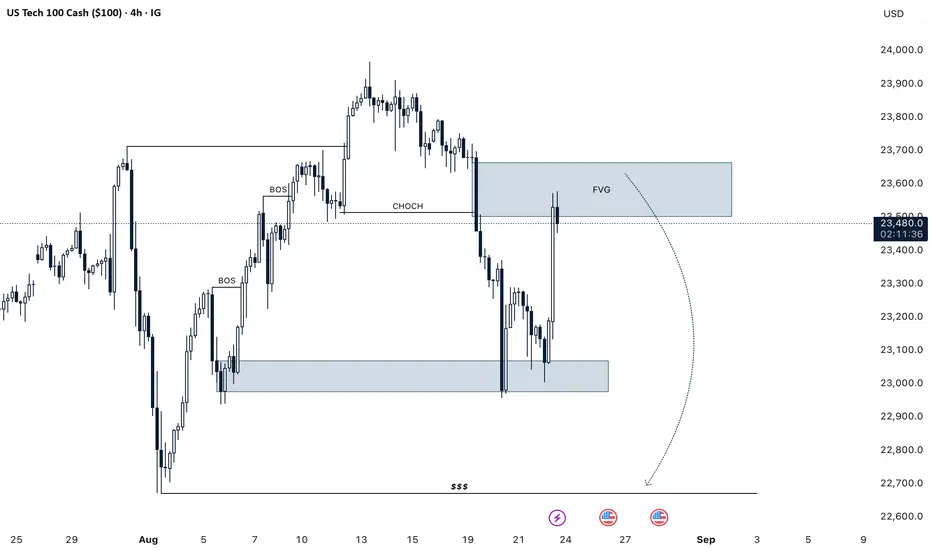
NASDAQ H4 We Are Selling Nasdaq Here Due To Market Structure Changed Bullish To Bearish NQ Gives Us Bearish Choch And Fair Value Gap Thats We Are Selling NQ Right Now Targeting Sell Sides Liquidity
Manage Your Trade According To Your Capital
And Follow Us For More Trades
SPX500 Market Outlook | Powell’s Jackson Hole Speech in FocusSPX500 – Overview
U.S. Sectors in Spotlight Ahead of Fed’s Jackson Hole Gathering
Wall Street is awaiting confirmation of a potential September interest rate cut when Fed Chair Jerome Powell speaks at the Jackson Hole symposium on Friday — a potentially pivotal event for markets, particularly for rate-sensitive sectors.
This year’s gathering comes after a week of mixed inflation data, as consumer and wholesale price reports gave conflicting signals on how well the U.S. economy is handling President Trump’s import tariffs, complicating the Fed’s policy outlook.
After cutting rates by 50 bps in September 2024 and 25 bps in both November and December, the Fed has since held steady. Rising expectations of another cut next month have buoyed homebuilders, banks, and retailers, though a hawkish surprise from Powell could weigh on these sectors.
🔎 Technical Outlook
Bearish Scenario:
As long as price trades below 6389, downside pressure remains, targeting 6366 and, if broken, extending toward 6321.
Bullish Scenario:
A confirmed 1H/4H close above 6389 would open the way toward 6406 – 6425, with a stronger push possible toward 6468.
📍 Key Levels
Pivot: 6389
Support: 6366 – 6341 – 6321
Resistance: 6406 – 6425 – 6468
⚠️ Expect heightened volatility during Powell’s Jackson Hole speech — risk management is essential.

Advance Auto Parts, Inc. $AAP ~ Old DinoS RiSe ~ Bullish!Advance Auto Parts, Inc. engages in the supply and distribution of aftermarket automotive products for both professional installers and do-it-yourself customers. It operates through the following segments: Advance Auto Parts/Carquest U.S., Carquest Canada, Worldpac, and Independents. The company was founded by Arthur Taubman in 1929 and is headquartered in Raleigh, NC.

SPX500 H4 | Bearish dropS&P500 has rejected off the sell entry at 6,407.74, which is a pullback resistance that aligns with the 38.2% Fibonacci retracement and could drop from this level to the downside.
Stop is at 6,491.06, which is a swing high resistance.
Take profit is at 6,302.91, which is a pullback support that is slightly below the 61.8% Fibonacci retracement.
High Risk Investment Warning
Trading Forex/CFDs on margin carries a high level of risk and may not be suitable for all investors. Leverage can work against you.
Stratos Markets Limited (tradu.com ):
CFDs are complex instruments and come with a high risk of losing money rapidly due to leverage. 65% of retail investor accounts lose money when trading CFDs with this provider. You should consider whether you understand how CFDs work and whether you can afford to take the high risk of losing your money.
Stratos Europe Ltd (tradu.com ):
CFDs are complex instruments and come with a high risk of losing money rapidly due to leverage. 66% of retail investor accounts lose money when trading CFDs with this provider. You should consider whether you understand how CFDs work and whether you can afford to take the high risk of losing your money.
Stratos Global LLC (tradu.com ):
Losses can exceed deposits.
Please be advised that the information presented on TradingView is provided to Tradu (‘Company’, ‘we’) by a third-party provider (‘TFA Global Pte Ltd’). Please be reminded that you are solely responsible for the trading decisions on your account. There is a very high degree of risk involved in trading. Any information and/or content is intended entirely for research, educational and informational purposes only and does not constitute investment or consultation advice or investment strategy. The information is not tailored to the investment needs of any specific person and therefore does not involve a consideration of any of the investment objectives, financial situation or needs of any viewer that may receive it. Kindly also note that past performance is not a reliable indicator of future results. Actual results may differ materially from those anticipated in forward-looking or past performance statements. We assume no liability as to the accuracy or completeness of any of the information and/or content provided herein and the Company cannot be held responsible for any omission, mistake nor for any loss or damage including without limitation to any loss of profit which may arise from reliance on any information supplied by TFA Global Pte Ltd.
The speaker(s) is neither an employee, agent nor representative of Tradu and is therefore acting independently. The opinions given are their own, constitute general market commentary, and do not constitute the opinion or advice of Tradu or any form of personal or investment advice. Tradu neither endorses nor guarantees offerings of third-party speakers, nor is Tradu responsible for the content, veracity or opinions of third-party speakers, presenters or participants.

ES Futures — Plan for Fri, Aug 22 Intraday trend on 15m/30m remains down. The 6,396–6,407 band is the pivot/decision zone. Tomorrow’s session is dominated by Powell’s Jackson Hole keynote (10:00 ET) — plan around it.
Fundamentals & Risk Clock (ET)
• 10:00 — Fed Chair Powell speaks at the Jackson Hole Economic Policy Symposium. Treat this as the day’s primary catalyst; no new entries 09:55–10:05 per risk rules.  
• Otherwise, the U.S. calendar is relatively light vs. today’s prints; markets will key off the Powell tone and subsequent positioning.  
Structure Map (carry-forward levels)
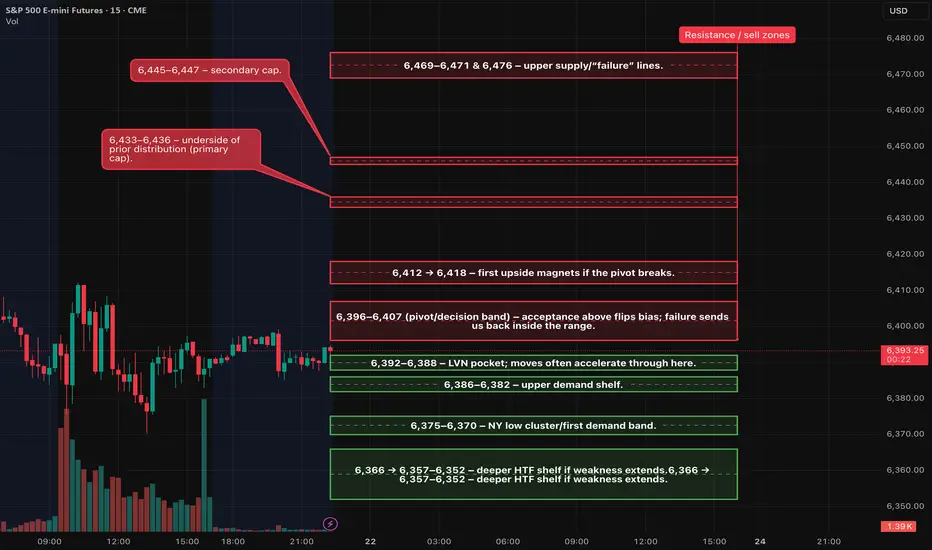
Resistance / sell zones
• 6,396–6,407 (pivot/decision band) – acceptance above flips bias; failure sends us back inside the range.
• 6,412 → 6,418 – first upside magnets if the pivot breaks.
• 6,433–6,436 – underside of prior distribution (primary cap).
• 6,445–6,447 – secondary cap.
• 6,469–6,471 & 6,476 – upper supply/“failure” lines.
Support / buy zones
• 6,392–6,388 – LVN pocket; moves often accelerate through here.
• 6,386–6,382 – upper demand shelf.
• 6,375–6,370 – NY low cluster/first demand band.
• 6,366 → 6,357–6,352 – deeper HTF shelf if weakness extends.
Preferred Setup (A++): Range-Continuation Short
Take only with confirmation; score ≥9.
• Trigger: First 5-minute close ≤ 6,390.5 after a failed probe of 6,396–6,407, and the next bar fails to reclaim 6,392–6,394.
• Entry: 6,390.5 (MOS).
• Stop: 6,396.5 (≈6 pts).
• Targets:
• TP1: 6,375.5 (+15)
• TP2: 6,366.0 (+24)
• TP3: 6,358.0 (+32)
• Management: Scale ½ at TP1; move stop → BE only after a fresh 5m lower-low or a clean close through the TP1 zone. If no extension within 2×5m bars, cut to half/scratch.
• Disqualifiers: Thick support immediately stacks under entry or a 15m acceptance back above 6,396–6,407.
Flip Setup (A++ if accepted): Acceptance Long above Pivot
Counter-trend unless 15m turns; size accordingly.
• Trigger: First 5-minute close ≥ 6,407.5 and the next bar does not reclaim < 6,405.
• Entry: 6,407.5 (MOS).
• Stop: 6,401.5 (≈6 pts).
• Targets:
• TP1: 6,418.0 (+10.5 from trigger; acceptable given clean path)
• TP2: 6,435.0 (+27.5)
• TP3: trail toward 6,446+ if momentum persists.
• Disqualifier: Quick slip back < 6,405 after trigger.
Timing & Playbook
• Primary trade windows: 09:45–11:30 ET and 13:50–15:45 ET.
• Powell (10:00 ET): Plan around the speech; entries before the print must have exceptional quality, otherwise wait for post-event structure.
• MOC module (15:40–16:10 ET): Use the imbalance as a tiebreaker: modest (<$0.5B) = range; strong (≥$1B) can drive a directional push into the cross.
S&P 500 (ES1!) : Time For A Pullback From The Highs?In this video, we will analyze the following FX market for the week of Aug 18 - 22nd:
S&P 500 (ES1!)
The S&P 500 hit ATHs again last week, but the last three trading days were narrow in range. Friday was a bearish close.
There is an untested Weekly and Monthly +FVG that price would potentially rebalance before going higher.
I believe this will be the draw on liquidity next week.
Enjoy!
May profits be upon you.
Leave any questions or comments in the comment section.
I appreciate any feedback from my viewers!
Like and/or subscribe if you want more accurate analysis.
Thank you so much!
Disclaimer:
I do not provide personal investment advice and I am not a qualified licensed investment advisor.
All information found here, including any ideas, opinions, views, predictions, forecasts, commentaries, suggestions, expressed or implied herein, are for informational, entertainment or educational purposes only and should not be construed as personal investment advice. While the information provided is believed to be accurate, it may include errors or inaccuracies.
I will not and cannot be held liable for any actions you take as a result of anything you read here.
Conduct your own due diligence, or consult a licensed financial advisor or broker before making any and all investment decisions. Any investments, trades, speculations, or decisions made on the basis of any information found on this channel, expressed or implied herein, are committed at your own risk, financial or otherwise.

Powell’s Jackson Hole speech: Key risks for SPX, DXY, and goldTraders are watching and waiting for Federal Reserve Chair Jerome Powell’s speech at the Jackson Hole Symposium.
The baseline expectation is that Powell will avoid committing to any move at the September meeting. Instead, he is likely to repeat that decisions will depend on the full set of economic data released between now and then.
If Powell were to even weakly signal a rate cut in September, the S&P 500 could rally. However, the reaction may be limited since markets are already pricing in a high probability of easing. According to CME’s FedWatch tool, traders see a 71% chance of a quarter-point cut in September.
Looking beyond September, a hint of rate cuts in October, November, or December could weaken the U.S. dollar and provide support for gold.

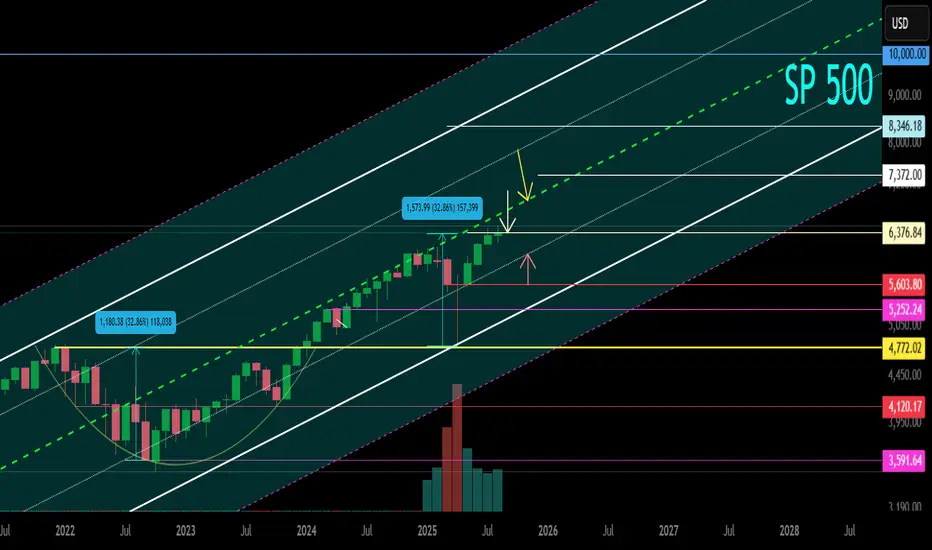
SP500 Secondary trend. Part of the channel. Reversal zone. 2025 Logarithm. Time frame 1 month (less is not necessary). The SP500 index primarily reflects the "health" of the American stock market and the economy as a whole. This is reflected in all markets by the domino effect.
Now, after a huge takeout and recovery, the price is at the maximums of the local trend that has formed, and this is also the maximum of the index as a whole for its entire 100-year existence (before displaying on the chart).
🔄 Locally, the price has run into the resistance of the median of the ascending channel (green dotted line). Now the resistance level of this zone will be formed.
🟢 A breakout of this zone upwards - an exit above the median, promises strong growth and pumping of the stock market as a whole.
🔴 And the reverse process is not a breakthrough and not a consolidation above this zone - consolidation in the range under resistance and above the dynamic support of the internal channel. An extremely negative case is a decline in the lower zone of the channel.
🧠 The chart as a whole shows the channel range itself. Including on both sides, price slippage zones (low probability), as well as key support / resistance levels of this secondary trend that exist, and those that will be formed in the future, but will be key for the development of the trend. This can be an addition to the analysis and formation of tactics and money management in other markets, including cryptocurrency.
$ES Futures: Bearish Breakdown Ahead? Short Setup Inside
## 🔻 ES Futures Bearish Setup: Shorting into Weakness (Aug 21, 2025) 🔻
### 🏦 Market Outlook
* 📉 **Bias:** Bearish sentiment dominates
* 🔎 **Tech drag** + weak momentum = downside risk
* ⚠️ Key support in focus: 6296–6298 zone
---
### 📊 Trade Idea (SHORT)
* 🎯 **Instrument:** ES Futures
* 📉 **Direction:** SHORT
* 💰 **Entry:** 6369.75 (near market)
* 🛑 **Stop Loss:** 6390.00
* 🎯 **Target:** 6300.00
* 📊 **Size:** 1 contract (\$50/pt)
* 💪 **Confidence:** 65%
* ⏰ **Timing:** Market Open
---
### ⚠️ Risk Watch
* 🌀 Low volume may cause chop
* 📉 Bounce risk near 6296–6298
* 🌍 Macro catalysts could shift flows
---
🔥 Hashtags for Reach 🔥
\#ESFutures #SP500 #FuturesTrading #DayTrading #SwingTrading #SPX #MarketOutlook #BearishSetup

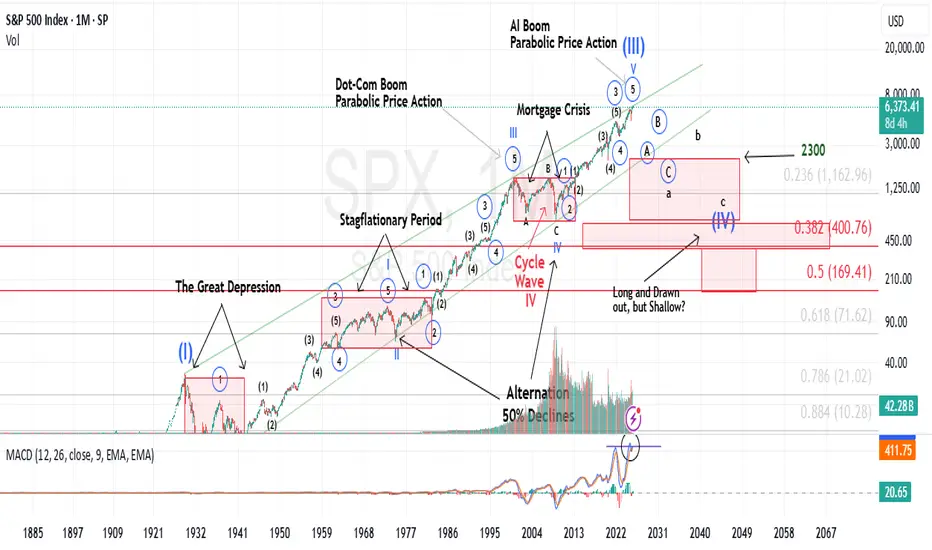
Are Longterm Interest Rates Telling Us Something?I rarely cite financial news in my market updates.
My reasoning is simple: all perspectives, bullish or bearish, are ultimately reflected in price action. That price action forms patterns, and those patterns can be analyzed to produce reasonable forecasts. After years of applying Elliott Wave theory, this approach has consistently stood the test of time.
That said, I’ll break from tradition today, as I believe the following excerpt is particularly relevant to my latest Trading View update. It comes from Barbara Kollmeyer’s article, “There’s a slow-motion crisis in bonds — and this bearish strategist thinks it will hit stocks.”
For context, I regularly track multiple market indices, futures contracts, single stocks, and notably, the yield on the 30-year U.S. Treasury Bond. For the past year, I’ve highlighted the counterintuitive rise in long-term yields that ironically began when the Fed started cutting its benchmark rate in September 2024. While brief divergences between long-term yields and Fed policy aren’t unusual, this persistent uptrend is different. The yield has been carving out a clear pattern of higher highs and higher lows, appearing now on the verge of a breakout—not just toward incremental new highs, but potentially into a runaway scenario for long-term rates.
This is why Albert Edwards’ recent comments caught my attention:
“There is a slow-motion crisis unfolding in the government bond markets that equity investors continue to ignore at their peril. The upward grind for long bond yields has been relentless, yet investors keep ignoring that to focus instead on more bullish metrics such as the latest reporting season driven by the mega-cap IT stocks, that promises a pot of gold at the end of the AI rainbow.”
His perspective resonated with me.
Having lived through the dot-com boom and bust, I recall how new technologies can fuel outsized market optimism. AI undoubtedly carries transformational potential, much like the Internet. But just as it took nearly two decades for the Internet to fully translate from speculative boom to tangible economic value, AI’s payoff will likely follow a similarly extended trajectory. It’s not an immediate catalyst.
What I am certain of is this: the cost of long-term money is rising, with implications far beyond bond charts. Higher yields directly affect mortgage rates and other long-term financing costs. More importantly, sustained upward pressure in long-term rates has the potential to weigh heavily on equities, broader markets, and asset valuations for far longer than many currently expect.
S&P dip buying opportunity supported at 6340US equities staged a sharp intraday rebound, with the S&P 500 recovering from losses of over -1% to close down just -0.24%. Tech remained under pressure (NASDAQ -0.67%, Mag-7 -1.11%), weighed by reports questioning the near-term profitability of AI adoption, though DB research stressed that productivity gains are still likely longer term. Gains in energy (+0.86%) and other cyclical sectors helped offset the tech weakness as Brent crude rose +1.6% to $66.84/bbl. Geopolitical headlines around Ukraine and potential security arrangements kept risk sentiment cautious.
Conclusion: Despite renewed tech volatility, the S&P’s resilience and sectoral rotation suggest dip-buying interest remains intact, but with near-term upside likely capped until tech stabilises.
Key Support and Resistance Levels
Resistance Level 1: 6433
Resistance Level 2: 6466
Resistance Level 3: 6500
Support Level 1: 6340
Support Level 2: 6310
Support Level 3: 6280
This communication is for informational purposes only and should not be viewed as any form of recommendation as to a particular course of action or as investment advice. It is not intended as an offer or solicitation for the purchase or sale of any financial instrument or as an official confirmation of any transaction. Opinions, estimates and assumptions expressed herein are made as of the date of this communication and are subject to change without notice. This communication has been prepared based upon information, including market prices, data and other information, believed to be reliable; however, Trade Nation does not warrant its completeness or accuracy. All market prices and market data contained in or attached to this communication are indicative and subject to change without notice.

SPX500 Market Outlook | Fed Meeting & Retail Earnings in FocusSPX500 Overview
Wall Street subdued as retail earnings and Fed meeting remain in focus
U.S. stock index futures edged lower on Wednesday, extending a tech-led pullback on Wall Street. Investors are closely monitoring earnings from major retailers such as Target and Lowe’s, seen as key indicators of consumer health, while awaiting the upcoming Federal Reserve symposium later this week.
Concerns over tariffs and their potential impact on consumer prices have weighed on sentiment, adding to the cautious market tone.
🔎 Technical Outlook
The SPX500 remains under bearish pressure after stabilizing below the pivot line at 6425.
Bearish Scenario:
As long as price trades below 6425, the trend favors the downside, targeting 6389 and 6366. A confirmed break of 6366 could accelerate the decline toward 6321.
Bullish Scenario:
A sustained 4H candle close above 6425 would shift momentum back to the upside, with resistance at 6439, followed by 6468 and 6485.
Support: 6389, 6366, 6341, 6321
Resistance: 6439, 6468, 6485

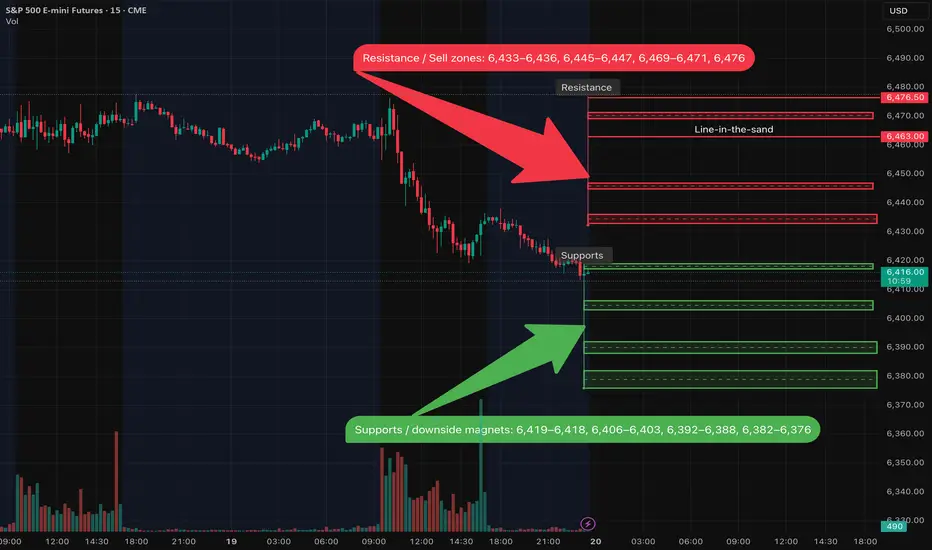
ES 08/21 — Key Levels - Short Bias - Setups - Fundamental Setups (A++ first)
1) SHORT — Retest-and-fail of supply (preferred)
• Zones: 6,433–36 or 6,445–47 (upper band 6,469–71).
• Trigger: 5-minute bearish close back below the shelf (no retest required); size to full only if a 15-minute bearish prints within the next 3×5m bars.
• Risk: entry +6–8 pts.
• TPs: +15 / +27 / +42 pts from entry (e.g., 6,445 → 6,430 / 6,418 / 6,403).
• Continuation guard: within 2×5m price must extend the low or print a lower high while failing to reclaim the shelf; otherwise cut ½ or scratch to BE.
2) SHORT — Breakdown & acceptance
• Trigger: 5m close < 6,418 and no immediate reclaim next bar.
• Risk: entry +6–8 pts.
• TPs: toward 6,406 → 6,392 → 6,382–76.
3) LONG — Only if promoted
• Trigger: 5m close & hold ≥ 6,436 (offers pull/flip; next bar holds).
• Risk: 6–8 pts (around 6,430).
• TPs: 6,451 → 6,459–60 → 6,471–72.
• Stand-down: lose 6,436 on a 5m close or see offers reload overhead.
Execution windows: 9:45–10:45 ET and 13:50–15:30 ET; avoid new risk 11:30–13:30 without momentum/confirmation.
Key levels (from HTF → LTF)
• Pivot / line-in-sand: 6,463 (short bias while ≤ this).
• Supply / sell zones: 6,433–36, 6,445–47, 6,469–71 (cap), 6,476.
• Supports / magnets: 6,419–18, 6,406–03, 6,392–88, 6,382–76, 6,370, 6,357–52.
Fundamentals — Thu, Aug 21, 2025 (ET)
• 08:30 — Weekly Initial Jobless Claims (DOL). Weekly claims are published Thursdays at 8:30 a.m. ET. 
• 08:30 — Philadelphia Fed Manufacturing Index (Aug). Next release Aug 21, 8:30 a.m. ET. 
• 10:00 — Existing Home Sales (July, NAR). NAR schedules the Jul report for Thu, Aug 21 at 10:00 a.m. ET. 
• 10:00 — Conference Board LEI (July). Thu, Aug 21, 10:00 a.m. ET.  
• 10:30 — EIA Weekly Natural Gas Storage. Standard release Thursdays 10:30 a.m. ET; next release Aug 21.  
• S&P Global Flash US PMI (Aug). Scheduled for Thursday (check S&P calendar; release times shown in UTC on their site). 
• Jackson Hole Economic Policy Symposium begins (Aug 21–23). 2025 theme: “Labor Markets in Transition.” 
How I’ll adapt intraday
• A stronger-than-expected Claims/PMI/Philly Fed that lifts yields and the USD into 6,433–36 / 6,445–47 favors setup #1 (fade the pop).
• EHS/LEI at 10:00 can whipsaw a breakdown—prefer acceptance before pressing setup #2.
• If Jackson Hole headlines skew risk-on and we accept ≥ 6,436, switch to setup #3 toward 6,451/60/71–72.
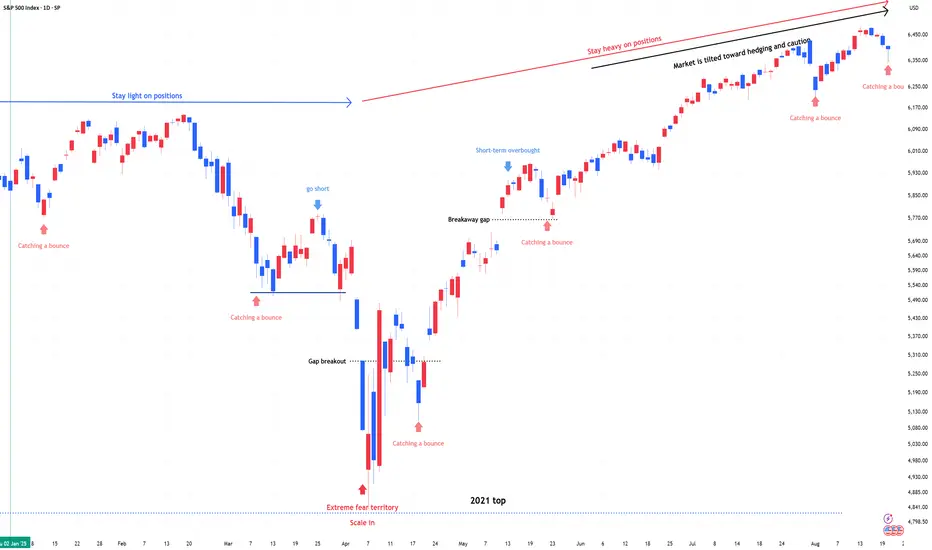
SPX & NDX , Stay heavy on positions.SPX & NDX , Stay heavy on positions. (2x leverage)
Same view as before. No change.
A signal for catching a bounce has emerged.
The bounce signal reflects a swing-to-intraday view and is not tied to the broader trend.
** This analysis is based solely on the quantification of crowd psychology.
It does not incorporate price action, trading volume, or macroeconomic indicators.
Is this the top? SPY/QQQ Plan Your Trade Update For 8-20I know it has been a while since I shared a video.
This video is designed to share the downside risks I see as a potential for the markets IF this big speculative phase unwinds like I think.
Ultimately, you guys are the ones who will be making the trading decisions. I just want you to be aware that the markets are extremely volatile right now and the data is pointing to a very clean Excess Phase Peak (EPP) pattern.
As you are all aware, the EPP pattern suggests that a breakdown in price is likely where price may attempt to target the FLAG LOW.
If that happens, be prepared for a -15% to -20% breakdown in price before the end of 2025 - possibly seeing an even bigger price collapse.
In my opinion, this breakdown is the result of a broad unwinding of excesses related to the Biden economy (free money) and a move towards more reasonable US economic policies.
Overall, this pullback is necessary for the Wave 1 of Wave 5 structure to complete. Once this pullback is complete, the bigger rally phase (Wave 3 of Wave 5) will begin. And get ready for a big rally phase with Wave 3.
So, I hope this video helps you learn how to identify and plan for some of the biggest price swings in the SPY/QQQ, and prepare for even bigger moves in Gold/Silver and Bitcoin.
Get some.
#trading #research #investing #tradingalgos #tradingsignals #cycles #fibonacci #elliotwave #modelingsystems #stocks #bitcoin #btcusd #cryptos #spy #gold #nq #investing #trading #spytrading #spymarket #tradingmarket #stockmarket #silver

S&P500 H4 | Bearish dropBased on the H4 chart analysis, we could see the price rise to the sell entry at 6,428.75, which is a pullback resstance and could drop from this level to the take profit.
Stop loss is at 6,488.82, whichis a swing high reistance.
Take profit is at 6,350.26, whichis an overlap support that lines up witht he 50% Fibonacci retracment.
High Risk Investment Warning
Trading Forex/CFDs on margin carries a high level of risk and may not be suitable for all investors. Leverage can work against you.
Stratos Markets Limited (tradu.com ):
CFDs are complex instruments and come with a high risk of losing money rapidly due to leverage. 65% of retail investor accounts lose money when trading CFDs with this provider. You should consider whether you understand how CFDs work and whether you can afford to take the high risk of losing your money.
Stratos Europe Ltd (tradu.com ):
CFDs are complex instruments and come with a high risk of losing money rapidly due to leverage. 66% of retail investor accounts lose money when trading CFDs with this provider. You should consider whether you understand how CFDs work and whether you can afford to take the high risk of losing your money.
Stratos Global LLC (tradu.com ):
Losses can exceed deposits.
Please be advised that the information presented on TradingView is provided to Tradu (‘Company’, ‘we’) by a third-party provider (‘TFA Global Pte Ltd’). Please be reminded that you are solely responsible for the trading decisions on your account. There is a very high degree of risk involved in trading. Any information and/or content is intended entirely for research, educational and informational purposes only and does not constitute investment or consultation advice or investment strategy. The information is not tailored to the investment needs of any specific person and therefore does not involve a consideration of any of the investment objectives, financial situation or needs of any viewer that may receive it. Kindly also note that past performance is not a reliable indicator of future results. Actual results may differ materially from those anticipated in forward-looking or past performance statements. We assume no liability as to the accuracy or completeness of any of the information and/or content provided herein and the Company cannot be held responsible for any omission, mistake nor for any loss or damage including without limitation to any loss of profit which may arise from reliance on any information supplied by TFA Global Pte Ltd.
The speaker(s) is neither an employee, agent nor representative of Tradu and is therefore acting independently. The opinions given are their own, constitute general market commentary, and do not constitute the opinion or advice of Tradu or any form of personal or investment advice. Tradu neither endorses nor guarantees offerings of third-party speakers, nor is Tradu responsible for the content, veracity or opinions of third-party speakers, presenters or participants.

SPY – No hocus-pocus – Now the witch is hunting the bullsHappy Hump-Day y'all!
In the last post (see linked chart), I explained what the witch sees in the future.
A possible scenario that is long overdue: the markets are letting out air.
With the candles from yesterday and the day before, we have confirmation that the S&P 500 is heading south. That has consequences that not many want to see right now.
The bulls will be overrun, panic selling will kick in and drive the markets into the ground even faster. The current profit target is still the Centerline, as marked with the red arrow.
Whoever doesn’t cash in at least 50% of their gains now will end up in the witch’s cauldron §8-)
Let’s see how this develops.
The YT Video will be up tomorrow - gotta feed the witches cat §8-)
May the broom be with you!

S&P 500 Shows Early Signs of Momentum Loss Ahead of Jackson HoleThe S&P 500 has begun to show signs of momentum loss ahead of the Jackson Hole meeting. The number of member stocks trading above their 200-day moving average has not increased, even as the index made new highs. RSI is showing a negative divergence, and the index has slipped below its short-term yellow trendline.
In addition, crypto markets sold off early Monday, and the VIX opened the week with a gap higher, moving above its short-term downtrend. These are still only early signals and not yet concrete confirmation, but traders should be cautious of potential profit-taking ahead of Jackson Hole, where Powell may push back against expectations for rapid rate cuts.

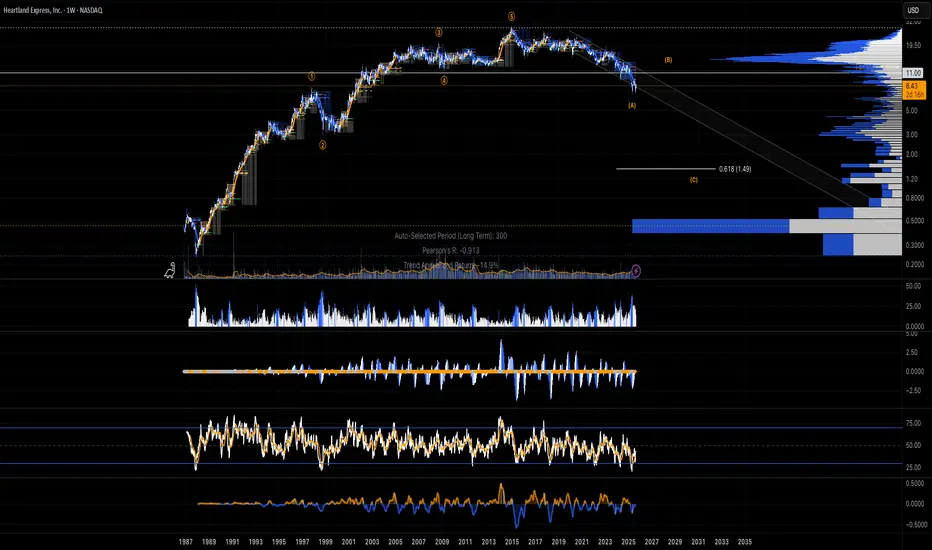
Heartland Express, Inc. $HTLD ~ B Wave ~ Then more correcting...Heartland Express, Inc. is a holding company, which engages in the provision of short-to-medium haul truckload carrier services. It offers long haul truckload and regional truckload transportation. The company was founded by Russell A. Gerdin in 1978 and is headquartered in North Liberty, IA.
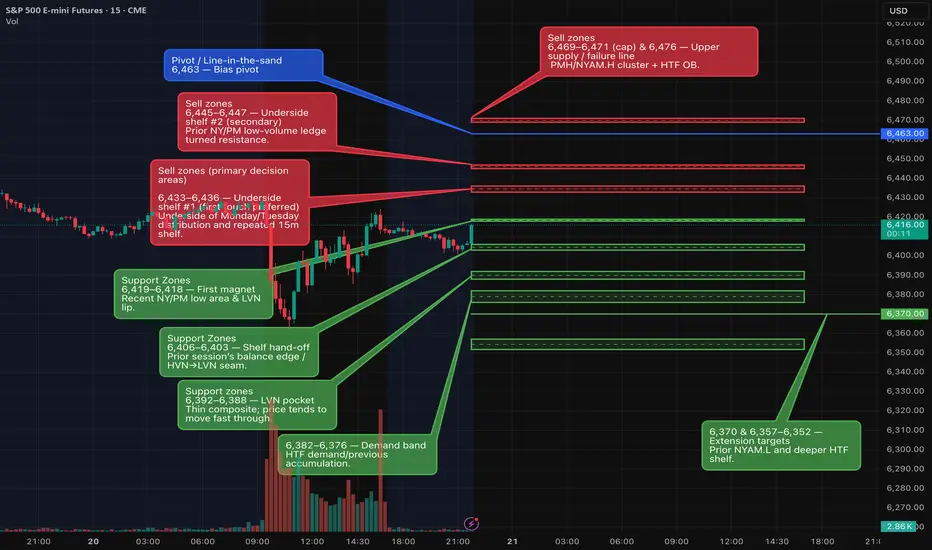
S 08/20 — Short bias below, Key Levels (watch FOMC minutes)Overview
Higher-timeframe trend has shifted lower. After failing at ~6,476, price broke the 6,446 shelf and printed a new low near 6,419 with expanding volume. As long as we remain below 6,463, I keep a short bias and will fade bounces into supply.
Key Levels
• Line-in-the-sand: 6,463
• Resistance / Sell zones: 6,433–6,436, 6,445–6,447, 6,469–6,471, 6,476
• Supports / downside magnets: 6,419–6,418, 6,406–6,403, 6,392–6,388, 6,382–6,376
Primary Plan — Bearish continuation
• Prefer selling failed retests into 6,433–6,436 or 6,445–6,447.
• Targets: first back to 6,419–6,418, then 6,406–6,403, and if momentum persists 6,392–6,388 / 6,382–6,376.
• Confirmation I want to see: intraday rejection wicks at the zone, momentum rolling over, and sellers stepping back in.
Alternative — Breakdown
• If price accepts below 6,418, I’ll look for continuation toward 6,403, then 6,392 / 6,376.
Invalidation / Neutralization
• Reclaiming 6,463 neutralizes the immediate short bias.
• Acceptance ≥ 6,471–6,476 opens squeeze risk toward 6,491 / 6,500; I’d stand aside on shorts until structure turns back down.
Event Risk (ET) — Wed 08/20
• 07:00 MBA Mortgage Applications
• 10:30 EIA Weekly Petroleum Status Report
• 13:00 U.S. 20-Year Treasury Auction
• 14:00 FOMC Minutes (Jul meeting)
Note: Expect headline-driven volatility around 14:00—I avoid initiating new positions into the release.
Posting Notes
This idea reflects levels visible on 1D/4H/1H (with 30m/15m for execution). I’ll update intraday if acceptance/rejection flips at the zones.
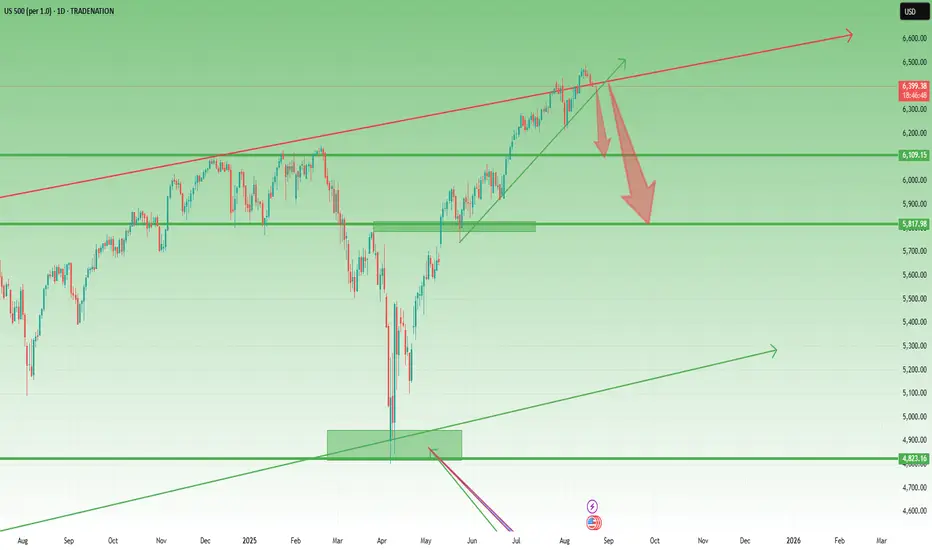
US500 – Has the Correction Started?1. What Happened Yesterday
Yesterday, US500 dropped around 1%, signaling that a meaningful correction could be starting. Unlike Nasdaq, which already broke under two key support levels, here the price is still above the trendline that began back at the end of May, when the index broke through the important 5800 resistance.
The rise since April has been huge and not fundamentally justified, making the index vulnerable to a reversal towards more sustainable levels.
________________________________________
2. Key Question
Has the correction really started, or will we first see another spike before the drop?
________________________________________
3. Why More Downside is Likely
• Trendline vulnerability: A break under 6380 could trigger acceleration to the downside.
• First bear target: 6100, the old ATH.
• Bigger picture: A move under 6000 remains likely, with 5800 as a longer-term destination.
• Risk/reward setup: Any spike higher should be seen as a selling opportunity. Around 6500 would be ideal to short.
________________________________________
4. Trading Plan
• Sell spikes, especially near 6500).
• Watch 6380 – break here could open the way towards 6100.
• Medium/long term bias: Bearish, with more room down than up.
________________________________________
5. Final Note 🚀
The market must confirm, but the strategy is clear: don’t chase the bounce, sell the strength and ride the correction.
Disclosure: I am part of TradeNation's Influencer program and receive a monthly fee for using their TradingView charts in my analyses and educational articles.
Why The Bubble Theory Makes No SenseIt seems like every other week with tech stocks making new all time highs, there is a constant chatter of claiming we're in a bubble. One of the classic signs of a bubble, is excessive leverage betting on ever higher returns.
This is a chart of securities margin loans provided by the Fed updated quarterly. As you can see since the 2008 financial crisis speculators have been very conservative with their use of leverage. It's almost like 2008 scared people so badly people more than a decade later are still behaving financially conservative.
Some of the rational for the talk of a bubble is historically high PE ratios, but this can be explained by massive reinvestments into AI infrastructure by the biggest tech companies. The more investments they make the higher the PE ratios look.
The key ingredient of a bubble is leverage and besides the small spike of it post-covid, there is no sign of excessive speculation.
Remember tech stocks are absolutely going to have a pullback likely next year or 2027, but the fear of a dot-com era bubble is just simply unfounded.
