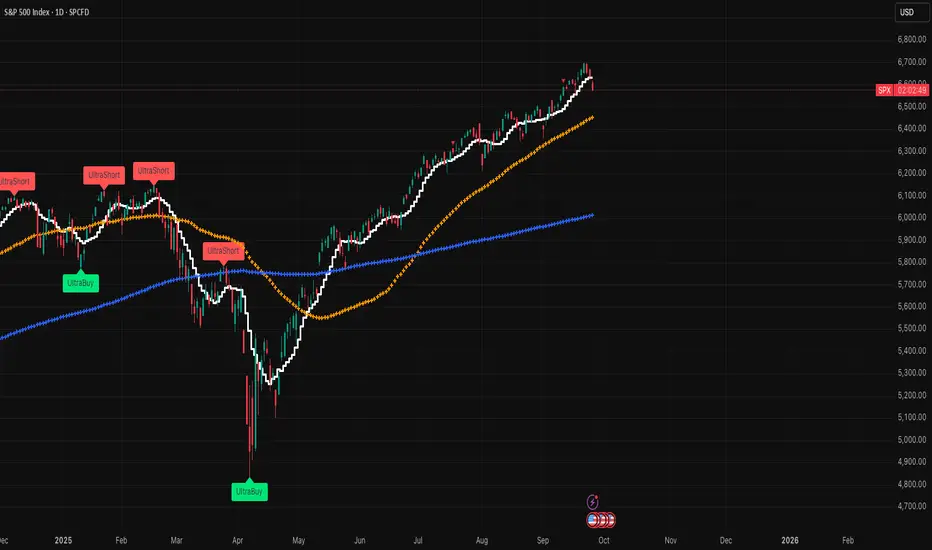
S&P 500 (ES1!): Wait For Valid Buy Setups!Welcome back to the Weekly Forex Forecast for the week of Oct. 20-24th.
In this video, we will analyze the following FX market: S&P 500 (ES1!)
The S&P500 is ranging. More neutral than bullish. But Friday's bullish close indicates potential bullish order flow going into this week.
If price can manage to trade above the Monthly Open at 6,725, than buys become valid.
I'm not interested in selling this market, unless I see a sure enough bearish BOS.
Enjoy!
May profits be upon you.
Leave any questions or comments in the comment section.
I appreciate any feedback from my viewers!
Like and/or subscribe if you want more accurate analysis.
Thank you so much!
Disclaimer:
I do not provide personal investment advice and I am not a qualified licensed investment advisor.
All information found here, including any ideas, opinions, views, predictions, forecasts, commentaries, suggestions, expressed or implied herein, are for informational, entertainment or educational purposes only and should not be construed as personal investment advice. While the information provided is believed to be accurate, it may include errors or inaccuracies.
I will not and cannot be held liable for any actions you take as a result of anything you read here.
Conduct your own due diligence, or consult a licensed financial advisor or broker before making any and all investment decisions. Any investments, trades, speculations, or decisions made on the basis of any information found on this channel, expressed or implied herein, are committed at your own risk, financial or otherwise.
Spx500analysis

S&P 500 Index Near Key Resistance – Correction Ahead?Recently, the S&P 500 ( SP:SPX ) has seen some sharp moves with high momentum due to the tariff tensions between the US and China over the past couple of weeks. These moves have also impacted other correlated markets like cryptocurrency .
In the past day, news came out that Trump is planning to meet the Chinese president on October 31st . With markets opening, the S&P 500 started to rise and is currently moving near a Resistance zone($6,734_$6,690) and close to its Resistance lines .
From an Elliott Wave perspective, it seems that the S&P 500 is completing a microwave 5 of the main wave C , and the corrective structure looks like an Regular Flat(ABC/3-3-5) .
I expect that in the coming hours, the S&P 500 index could drop at least to around $6,641(First Target) .
Second Target: $6,611
Stop Loss(SL): $6,735
Note: The $6,641 level is quite important in the context of the recent rally and could act as both support and resistance for the S&P 500.
A possible decline or fall in the S&P 500 index could also cause Bitcoin to decline (due to Bitcoin's high correlation with the S&P 500 index in recent weeks).
Please respect each other's ideas and express them politely if you agree or disagree.
S&P 500 Index Analyze (SPX500USD), 1-hour time frame.
Be sure to follow the updated ideas.
Do not forget to put a Stop loss for your positions (For every position you want to open).
Please follow your strategy and updates; this is just my Idea, and I will gladly see your ideas in this post.
Please do not forget the ✅' like '✅ button 🙏😊 & Share it with your friends; thanks, and Trade safe.

BUY SPX - S&P500- Profitable trade opportunity!Based on our deep analysis we can see that SPX (S&P500) will head to the upside. Great time to BUY - it is currently in a uptrend and is holding on to powerful support levels. The next target is the resistance level to the upside. This is a great low risk high reward trade. BUY NOW!

BUY SPX - S&P500- Amazing low risk high reward trade!Based on our deep analysis we can see that SPX - S&P500 will head to the upside. Great time to buy - it has broken major resistance levels + trends.

SPX500 | HULL MA & Fibo Confluence Setting Up the Move!🎯 SPX500: The "Polite Thief" Strategy - Stealing Profits Like a Gentleman 🎩💰
📊 Market Overview
Asset: SPX500 (S&P 500 Index CFD)
Trade Type: Swing/Day Trade Opportunity
Bias: Bullish 🐂
Strategy Style: Multi-Layer Entry (The "Thief Method")
🔍 Technical Setup
The Plan: We're eyeing a bullish confirmation with a clean retest/pullback at the 38.2% Fibonacci level, aligned beautifully with our HULL Moving Average. This confluence zone is screaming "buy the dip" louder than your portfolio manager at a market crash! 📈
🎯 Entry Strategy Options:
Option 1: The "Polite Thief" Multi-Layer Approach
Instead of going all-in like it's a Vegas buffet, we're using calculated limit orders:
📍 Layer 1: 6620
📍 Layer 2: 6640
📍 Layer 3: 6660
📍 Layer 4: 6680
Feel free to add more layers based on your account size and risk appetite!
Option 2: Market Execution
Jump in at any current price level if the setup confirms during live hours.
🛡️ Risk Management
Stop Loss: 6580
⚠️ Disclaimer: Dear Ladies & Gentlemen (Thief OG's), this is MY stop loss based on MY analysis. You're the captain of your own ship! 🚢 Set your risk parameters according to YOUR comfort level and account size. Risk management is YOUR responsibility.
💎 Profit Target
Target Zone: 6860
This level represents our "Electric Shock Wall" 🔌⚡ - a confluence of:
Strong historical resistance
Overbought territory potential
Bull trap zone (where late entries get caught)
Exit Strategy Note: I'm not your financial advisor! 💼 When you see green, secure those gains at YOUR discretion. The market doesn't care about our targets - take profit when YOU feel comfortable!
🌐 Related Pairs to Watch
Keep your eyes on these correlated instruments:
📈 AMEX:SPY (S&P 500 ETF) - Moves in lockstep with SPX500; watch for volume confirmation
📈 NASDAQ:QQQ (Nasdaq-100 ETF) - Tech-heavy index; bullish momentum here supports SPX strength
📈 AMEX:DIA (Dow Jones ETF) - Broader market sentiment indicator
📈 TVC:VIX (Volatility Index) - Inverse correlation; falling VIX = bullish for equities
💵 TVC:DXY (US Dollar Index) - Typically inverse to equities; weakening dollar supports stocks
Key Correlation: When tech leads (QQQ pumping), SPX usually follows. Watch for VIX to stay subdued below 15 for sustained bullish momentum.
📝 Key Technical Points
✅ 38.2% Fibonacci retracement acting as dynamic support
✅ HULL Moving Average confluence strengthens the setup
✅ Multi-layer entry reduces average cost and timing risk
✅ Clear risk/reward structure with defined zones
✅ Resistance zone identified for disciplined exits
⚡ The "Thief Strategy" Philosophy
We're not robbing the market - we're borrowing profits with permission! 😉 The layered entry approach allows us to build positions like a professional, not gamble like a reckless amateur. Scale in, scale out, and live to trade another day!
✨ If you find value in my analysis, a 👍 and 🚀 boost is much appreciated — it helps me share more setups with the community!
⚠️ Final Disclaimer
IMPORTANT: This "Thief Style" trading strategy is for educational and entertainment purposes only! 🎪 This is NOT financial advice. I'm sharing my personal analysis and trade ideas - what you do with your money is 100% YOUR decision. Trade at your own risk, manage your own capital, and never risk more than you can afford to lose. Past performance doesn't guarantee future results. Always do your own research! 🔍
#SPX500 #SP500 #TradingIdeas #SwingTrading #DayTrading #TechnicalAnalysis #FibonacciRetracement #SupportAndResistance #RiskManagement #TradingStrategy #StockMarket #IndexTrading #ThiefStrategy #LayeredEntry #PriceAction #MarketAnalysis #TradingCommunity #ChartAnalysis

SPX500 Long From Support!
HI,Traders !
#SPX500 made a retest
Of the wide horizontal
Support level of 6581.19
And a local rebound is
Already taking place so
We are bullish baised
And we think that a local
Bullish correction is to
Be expected !
Comment and subscribe to help us grow !

SPX500 Local Short!
HI,Traders !
#SPX500 made a nice
Bullish move up and
made a retest of
The horizontal resistance
Level of 6750.77 from where
We are already seeing a bearish
Reaction and so we will be
Expecting a further move down !
Comment and subscribe to help us grow !

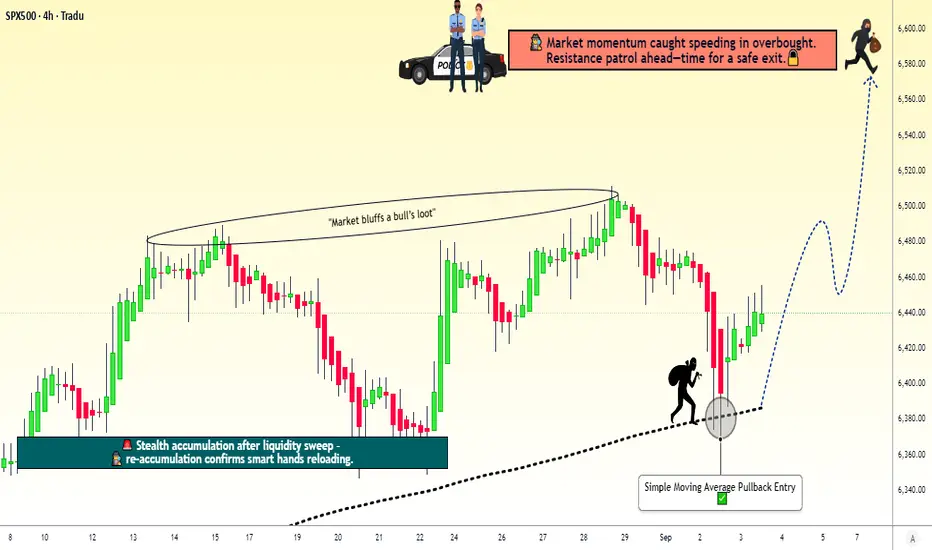
$SPX500 Swing Trade: Bullish SMA Setup!📈 S&P 500 CFD: Thief’s Bullish Pullback Plan 🤑💰
🚨 Swing/Day Trade Setup: S&P 500 Index CFDSteal profits with this 200 SMA Pullback Plan using the "Thief" layered entry strategy! 📊💸 Below is a detailed breakdown combining technicals, fundamentals, and market sentiment to help you navigate this bullish opportunity. Let’s dive in! 🐂
🎯 Trading Plan Overview
Asset: S&P 500 Index CFD ( FOREXCOM:SPX500 )
Bias: Bullish 🐂
Strategy: Pullback to 200 SMA with layered "Thief" limit orders for entries
Why This Plan?
Technicals: The S&P 500 is riding record highs with strong momentum, supported by the 200 SMA as a dynamic support level.
Fundamentals: Cooling inflation (PPI -0.1% vs. +0.3% expected), 100% Fed rate cut probability, and robust corporate earnings (+10% in 2025, +13% in 2026) fuel bullish sentiment.
Sentiment: Neutral Fear & Greed Index (51/100) with low volatility (VIX ~15.04) and AI-driven institutional flows (e.g., Oracle +30%).
📊 Thief’s Technical Setup
Entry Strategy:
Use the Thief Layered Entry approach with multiple buy limit orders to catch pullbacks:
🔔 Buy Limit 1: $6,460
🔔 Buy Limit 2: $6,480
🔔 Buy Limit 3: $6,500
🔔 Buy Limit 4: $6,520
💡 Pro Tip: Adjust layer levels based on your risk tolerance and market conditions. You can enter at any price level or add more layers for flexibility!
Entry Trigger: Pullback to the 200 SMA for optimal risk-reward.
Stop Loss (SL):
Suggested "Thief" SL: $6,440 (below key support).
⚠️ Note: Adjust your SL based on your risk management and strategy. Trade at your own risk, dear Traders!
Take Profit (TP):
Target: $6,700 (near resistance, potential overbought zone, or "police barricade" trap).
🚨 Note: Escape with profits before resistance hits! Set your TP based on your goals—don’t blindly follow mine. Take money at your own risk!
📡 Real-Time Market Data (10 Sept 2025, UTC+1)
Daily Change: +37.43 points (+0.57%)
YTD Performance: Record highs driven by AI optimism and Fed rate cut expectations.
😰😊 Fear & Greed Index
Current Sentiment: Neutral (Score: 51/100)
Breakdown:
📈 Market Momentum: Bullish (S&P 500 above 125-day MA).
🌬️ Volatility (VIX): Low (~15.04), signaling calm markets.
🛡️ Safe Haven Demand: Moderate (bonds lagging stocks).
💰 Junk Bond Demand: Slight greed (narrowing yield spreads).
⚖️ Options Activity: Balanced put/call ratio.
🏛️ Macro & Fundamental Analysis
Producer Price Index (PPI): August PPI fell -0.1% (vs. +0.3% expected), easing inflation concerns.
Fed Rate Cut: 100% probability of a 25-50 bps cut in September 2025.
Labor Market: Weaker-than-expected (911K jobs revised down through March 2025).
Corporate Earnings: Strong outlook (+10% growth in 2025, +13% in 2026).
Key Drivers:
🚀 AI investment surge (e.g., Oracle +30%, Nvidia strength).
🌍 Geopolitical risks (Poland-Russia tensions, Middle East concerns).
📉 Trade policy uncertainties (Trump tariff threats).
🐂🐻 Sentiment Analysis
Institutional Outlook: Cautiously optimistic
🏦 Deutsche Bank & Wells Fargo: S&P 500 targets at 7,000+ by 2026.
💡 Focus: AI capex and earnings resilience.
Retail Trader Mood: Mixed but leaning bullish
📈 Meme stock activity (e.g., GameStop +10%).
₿ Crypto correlation (Bitcoin at $111.9K, Solana at 7-month highs).
⚡ Why This Plan Stands Out
Technical Edge: The 200 SMA pullback is a proven strategy for swing/day traders, offering high-probability entries.
Thief Strategy: Layered limit orders maximize flexibility and reduce risk of missing the move.
Macro Support: Cooling inflation, Fed rate cuts, and AI-driven earnings create a bullish backdrop.
Sentiment Boost: Neutral sentiment with low volatility supports steady upside potential.
Risks to Watch: Geopolitical shocks, overvaluation concerns, and seasonal market weakness.
🔍 Related Pairs to Watch (in USD)
Nasdaq 100 CFD ( NASDAQ:NDX ): Tracks tech-heavy AI stocks driving S&P 500 momentum.
VIX ( TVC:VIX ): Monitor volatility spikes for potential reversals.
US 10-Year Treasury Yield ( TVC:TNX ): Impacts risk sentiment and stock valuations.
FX:USDJPY : Correlates with risk-on/risk-off market moves.
Bitcoin ( BITSTAMP:BTCUSD ): Tracks retail sentiment and risk appetite.
🚨 Key Takeaways
🏆 S&P 500 at record highs, supported by soft PPI and Fed cut expectations.
😎 Neutral sentiment with a greedy tilt if macro data improves.
🤖 AI trade dominates institutional flows, powering bullish momentum.
📅 Watch upcoming CPI data and Fed meeting for next catalysts.
✨ “If you find value in my analysis, a 👍 and 🚀 boost is much appreciated — it helps me share more setups with the community!”
#SPX500 #SwingTrading #DayTrading #ThiefStrategy #Bullish #TechnicalAnalysis #Macro #AI #FedRateCut #TradingIdeas

SPX500 Index – Ready for the Next Pullback Heist Move?🚨 SPX500 / US500 Index – The Money Heist Swing Plan 🎭💰
📊 Plan Overview
Bias: Bullish 200-SMA Pullback Plan @ 6380.00
Entry Strategy (Layering Style):
Thief strategy = multiple buy limit orders stacked like layers 🎯
6400.00 ✅
6410.00 ✅
6420.00 ✅
6440.00 ✅
(You can increase or adjust the layering based on your own style and risk tolerance.)
🛡️ Stop Loss (Thief SL)
SL: 6360.00 ⚠️
Dear Ladies & Gentlemen (Thief OG’s), adjust your SL to fit your risk style. This is just the plan’s guardrail.
🎯 Target / Exit
Target Zone: 6580.00 🚀
Note: This is the “Police Resistance” 🛑 – an overbought + trap zone. Escape with the stolen money 🎭💰 before getting caught.
Reminder: Not financial advice. You decide where to take profits.
🤔 Why This Plan?
🔹 200 SMA Pullback Logic: Price retraced into moving average = classic thief-style entry.
🔹 Layering Strategy Advantage: Building positions gradually improves average entry price & reduces risk.
🔹 Momentum & Sentiment: Neutral Fear & Greed Index (53/100) 😐 and low volatility (VIX 16.9) = stable environment for pullback entries.
🔹 Market Strength: US500 is up +16.81% YTD 🚀 with strong sector support (Alphabet +8.57%, Macy’s +19%).
🔹 Risk Factor: Economic data shows weakness (job openings & factory orders ↓), but bulls remain in control = reason for cautious layering.
🔹 Overall Outlook: Bullish score 65/100 ✅ → Mildly bullish bias fits perfectly with a buy-the-dip pullback strategy.
🔹 Trap Zone Awareness: Plan exits near resistance at 6580.00 to avoid overbought trap — thieves always escape before alarms go off 🚨.
📊 US500 INDEX CFD Real-Time Data (September 03)
Daily Change: +0.51% ↗️
Monthly Performance: +1.87% ↗️
Yearly Performance: +16.81% 🚀
All-Time High: 6,510.93 (August 2025)
😰😊 Investor Sentiment: Fear & Greed Index
Current Reading: 53/100 (Neutral) 😐
Trend: Balanced sentiment with no extreme fear or greed.
Key Indicators:
Market Momentum: S&P 500 above 125-day moving average (positive momentum) ↗️
Volatility (VIX): Low volatility (16.90), indicating stability 🟢
Options Activity: Put/Call ratio stable (no significant fear)
Junk Bond Demand: Moderate risk appetite
Safe Haven Demand: Bonds underperforming stocks (greed signal)
📈 Fundamental & Macro Score
Market Breadth: Moderate (balanced volume) ⚖️
Economic Data:
Job openings lowest since Sept (weakness) 🔻
Factory orders down -1.3% 🔻
Friday’s jobs report = critical ⚠️
Sector Performance:
Communication services (Alphabet +8.57%) 🟢
Consumer discretionary (Macy’s +19%) 🟢
Energy sector weak (Exxon Mobil -2.08%) 🔻
🐂🐻 Overall Market Outlook
Bullish Score: 65/100 (Mildly Bullish) ✅
Reasons:
Strong yearly gains (+16.81%)
Low volatility & neutral sentiment support stability
Tech & communication sectors leading momentum
Risks:
Weakening job & factory data
High valuations near ATH
💡 Key Takeaways
US500 trending upward with neutral short-term sentiment.
Friday’s jobs report = key catalyst.
Sector rotation in play: tech strong, energy weak.
Balanced fear/greed supports controlled bullish setups.
📌 Related Pairs to Watch
FOREXCOM:SPX500
CAPITALCOM:US500
TVC:DJI
NASDAQ:NDX
TVC:VIX (for risk gauge)
✨ “If you find value in my analysis, a 👍 and 🚀 boost is much appreciated — it helps me share more setups with the community!”
#SPX500 #US500 #IndexTrading #SwingTrade #LayeredEntry #SMAPullback #TradingPlan #StockMarket #SP500 #InvestorSentiment #FearGreed
WEEKLY MARKET ANALYSIS-DXY, BTC,ETH, NAS100,SPX,XAU,XAGThis weekend's analysis will cover the Dollar Index, Bitcoin, Ethereum, NAS100, SPX500, Gold and Silver.
The DXY has found a strong support on both the monthly and daily charts. DXY has officially also broken it's weekly closing resistance level and I think a shift in momentum will propel DXY up higher in the next week towards a target zone of 99 to 99.600.
Bitcoin is still in a correction and currently paused on the weekly 21 EMA, I think it's consolidating sideways and will continue selling to the intended target of $102k in the coming week.
ETH nicely came to the previous resistance and seems to find some buyers there but there is no momentum or RSI strength to support an upward move, so I am bearish on ETH and think the price will fall some more into the target zone below $3,823.
NAS100 and SPX500 are also looking quite over stretch on it's Bollinger Bands and KC channels on the weekly charts, with weekly bearish candles suggesting a pullback in the equities is very likely in the next coming week.
Gold and Silver are in a strong uptrend and the uptrend will continue but I see profit taking on the charts. I expect some sideways consolidation and a minor pullback before the bullish continuation.
I thank you for listening to my publications and I wish you a great trading week. Cheers everybody!!

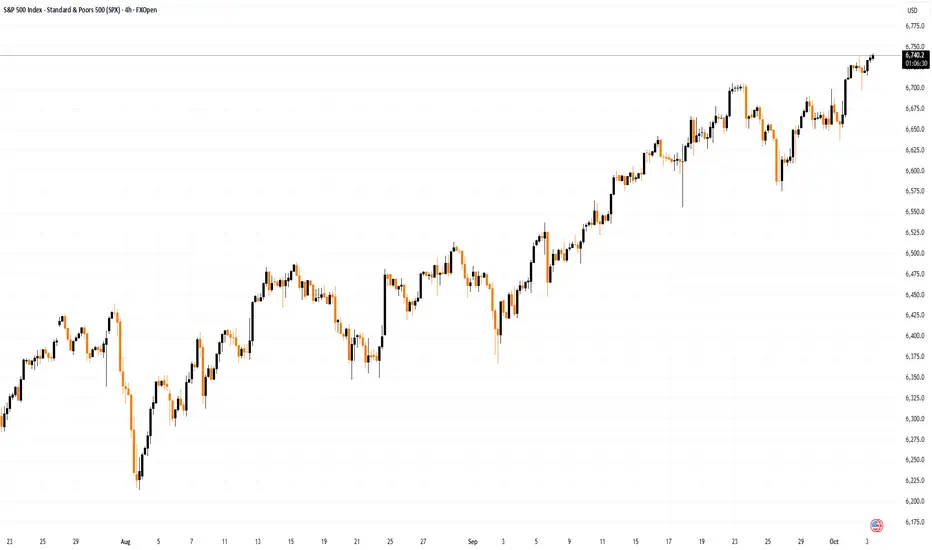
The S&P 500 index remains positive against all oddsThe S&P 500 index remains positive against all odds
We noted on 29 September that, amid the US shutdown, sentiment in the S&P 500 index market remained positive, and highlighted factors supporting further growth.
Today, the S&P 500 index reached a fresh all‑time high: on Friday morning the price rose above 6 740 points. This confirms the continued optimism among market participants. Today this is supported by news related to the creators of ChatGPT.
According to media reports, OpenAI:
→ has reached a valuation of $500 billion following a deal in which current and former employees sold shares worth around $6.6 billion;
→ is expanding cooperation with semiconductor manufacturers in South Korea, which is expected to sustain the company’s high growth rate.
Thus, OpenAI’s successes are boosting investor optimism ahead of the upcoming earnings season.
These and other positive developments might have been overshadowed by the regular Non‑Farm Employment Change report (and other US labour market data), but the Bureau of Labour Statistics is closed due to the shutdown.
Technical analysis of the S&P 500 chart
Recent data on the 4‑hour chart of the S&P 500 index underline sustained optimism, as the price develops within a previously established ascending channel, highlighted in blue.
From a bullish perspective:
→ bulls showed strength by breaking a local resistance level at 6 700, which later acted as support (indicated by an arrow);
→ local peaks allow for steeper upward trendlines to be drawn;
→ if the move from A→B is seen as the main impulse and B→C as a correction, the correction appears shallow, as the reversal upwards occurred from the 0.382 Fibonacci level, highlighting strong demand.
From a bearish perspective:
→ the price is approaching the upper boundary of the channel, where profit‑taking by long holders is typical;
→ the current peak on the e‑mini S&P 500 chart slightly exceeds the October high (A), suggesting the potential for a bearish divergence;
→ the absence of news creates an “information vacuum” that could significantly influence market sentiment if filled with negative data.
Nonetheless, optimism persists, with Tom Lee (Fundstrat) forecasting that the S&P 500 index will exceed 7 000 points by year‑end.
This article represents the opinion of the Companies operating under the FXOpen brand only. It is not to be construed as an offer, solicitation, or recommendation with respect to products and services provided by the Companies operating under the FXOpen brand, nor is it to be considered financial advice.
The S&P 500 Index Remains Positive Against the OddsThe S&P 500 Index Remains Positive Against the Odds
Today, the S&P 500 Index is trading close to a new all-time high, having opened Monday above 6,675 points. This reflects continued optimism among market participants despite factors such as:
→ The risk of a U.S. government shutdown on 1 October.
Today, President Trump will meet with Democratic and Republican leaders in Congress to try to prevent a halt to government funding. However, Reuters reports that chances of reaching an agreement are slim. At the same time, Bank of America analysts remain calm, noting that a shutdown would shave only around 0.1% off GDP per week, and historically such closures have had little impact on financial markets.
→ Jerome Powell’s hawkish stance at the September Federal Reserve meeting.
Nevertheless, most market participants expect the Fed to make another move towards cutting rates at its next meeting on 29 October. The publication of the PCE index on Friday increased this likelihood, as the figures came in line with forecasts, reducing the risk of a renewed inflation surge.
Technical Analysis of the E-mini S&P 500 Chart
On 17 September, analysing the 4-hour chart of the S&P 500 Index, we noted:
→ the price continues to fluctuate within an ascending channel, highlighted in blue;
→ the long body of the bullish candle on 11 September points to strong buyer pressure, indicating an imbalance, or, in Smart Money Concept terminology, a Fair Value Gap (FVG).
At present, the channel remains relevant, but it has expanded — bullish sentiment has shifted the key line (marked in orange) from resistance to support. At the same time, the FVG zone has confirmed its role as support.
Possible developments: the chart indicates a buyer advantage:
→ strong demand near the channel’s median (evident in the long lower shadows from Friday, marked with an arrow);
→ buying activity has been strong enough to push the price back (for now) within the ascending channel.
If buyer dominance continues, this could lead to a new all-time high, testing the upper boundary of the channel. From a bearish perspective:
→ the psychological level of 6,700 could act as resistance;
→ continued growth at Monday’s open could push the RSI indicator into overbought territory, creating potential for a correction.
However, as long as the S&P 500 Index remains above the orange support line, there is reason to believe that the bulls remain in control.
This article represents the opinion of the Companies operating under the FXOpen brand only. It is not to be construed as an offer, solicitation, or recommendation with respect to products and services provided by the Companies operating under the FXOpen brand, nor is it to be considered financial advice.

SPX500 Bearish Breakout!
HI,Traders !
#SPX500 made a bearish
Breakout of the rising support
Line and we are bearish biased
Therefore, after retesting the sell cluster area
at 6643.11 So we will be expecting a Further
bearish move down !
Comment and subscribe to help us grow !

SPX is absolute in the garbage now! Great inverse playI've been saying this for a few weeks now and all those who bought at the top are now official bag holders. There's a lot more bleeding that will happen. First, SMA9 crossed (check), next we'll see aggressive drop crossing SMA50, maybe some consolidation, and if it drops below SMA200, we're in for some interesting times. Don't stress, here's your play.....check out CBOE:UVIX , CBOE:MSTZ for inverse plays. There's still some nice upside. When they say, don't sell, you sell otherwise you'll be exit liquidity! I've seen this way too many times. Best of luck!
CAUTIOUS UPSIDE BUT BULLISH ON SPX500, NAS100 AND GOLDSPX500, NAS100 and GOLD are all reaching for higher price targets. They are all over stretched outside their normal ranges on the indicators but the divergences spotted on the charts are all not confirmed on a higher time frame suggesting that there could be an upside capitulation price action before a pullback occurs based on the divergences. Therefore cautious trading but Not opening new long positions at these level. Let's be patient and wait for the right opportunity.
On the other hand if you're looking for a short entry then place on a lot of risk management for the overshoot before the pullback.
Gold is an exception as it already done the pullback to the daily new POC zone and on 4 hours timeframe buyer have stepped up their buying activity defending the 55 EMA at $3,637.
I hope my analysis helps you form your own opinion and I thank you for listening to my publication. Cheers!!!

S&P 500 Index Holds Near Record High Ahead of Fed AnnouncementS&P 500 Index Holds Near Record High Ahead of Fed Announcement
At 21:00 GMT+3 today, the Federal Reserve will announce its interest rate decision, followed by Jerome Powell’s press conference. The rate is widely expected to be cut from 4.25%–4.50% to 4.00%–4.25%.
This will conclude a prolonged intrigue fuelled by President Trump:
→ his constant criticism of Powell for pursuing an “overly tight” policy;
→ the decision to dismiss Federal Reserve Board member Lisa Cook, which markets perceived as direct pressure on the regulator’s independence.
In anticipation of the outcome, traders are showing optimism. The S&P 500 index reached a new all-time high yesterday, climbing above 6,640 points. This morning the price pulled back slightly, which can be interpreted as a short-term correction ahead of a key event. Effectively, the market has already priced in the expected policy easing, viewing it as a catalyst for further growth.
Technical Analysis of the S&P 500 Chart
Six days ago, when analysing the 4-hour chart of the S&P 500 (US SPX 500 mini on FXOpen), we noted that:
→ the price was oscillating within an upward channel (marked in blue);
→ in September, the index has been following a steep bullish trajectory (marked in orange), with its lower line showing signs of support.
Since then, favourable inflation data helped the bulls break above the channel’s upper boundary (highlighted with an arrow).
Possible scenarios:
Bullish perspective:
→ The breakout candle above the blue channel has a long body, signalling strong buying momentum – an imbalance, also known in Smart Money Concept (SMC) as a Fair Value Gap (FVG).
→ The local level of 6,600, once resistance, has now turned into support; the next target could be the psychological level of 6,700.
→ The price is consolidating above the blue channel’s upper boundary, indicating robust demand.
Bearish perspective:
→ The upper boundary of the orange channel may act as resistance.
→ The RSI indicator, although off overbought territory, remains close to it – potentially deterring buyers from entering at elevated prices.
Taking all of this into account, the current balance could easily be disrupted once the Fed announces its rate decision – arguably the most significant event of the month in the economic calendar. Be prepared for spikes in volatility, as sharp moves in either direction are possible.
This article represents the opinion of the Companies operating under the FXOpen brand only. It is not to be construed as an offer, solicitation, or recommendation with respect to products and services provided by the Companies operating under the FXOpen brand, nor is it to be considered financial advice.

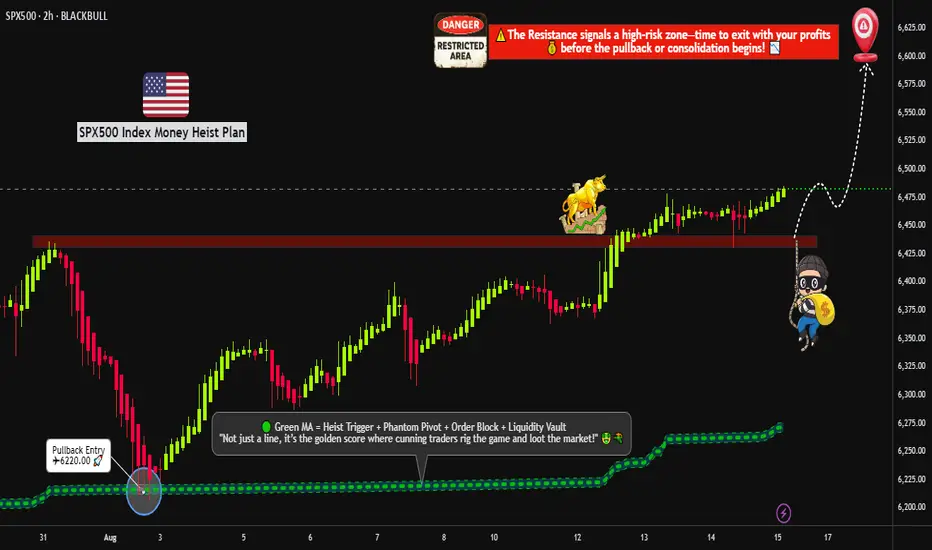
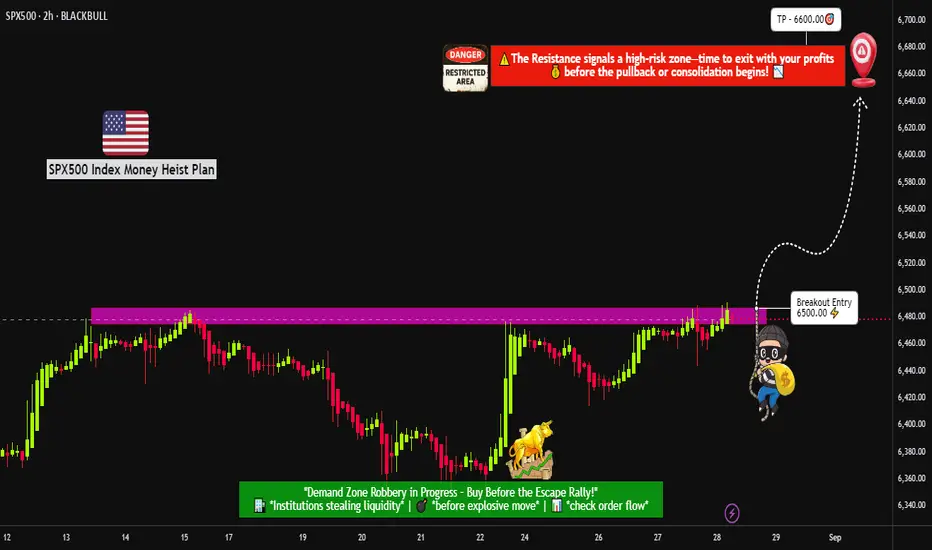
"US500 BREAKOUT – TIME TO LOAD LIMIT ORDERS FOR THE PUMP?"🔥🦹♂️ "SPX500 BANK HEIST – LAYERED BULL RAID IN PROGRESS!" 💰📈
(Thief Trader’s Multi-Limit Order Bullish Ambush – No Weak Hands Allowed)
📍 ASSET: US500 / SPX500 (S&P 500 INDEX)
🎯 HEIST PLAN: BULLISH BREAKOUT 6500.00
💣 ENTRY: ANY PRICE LEVEL (Thieves use Layered Limit Orders – adapt like a pro!)
🔫 SAMPLE LAYERS: (Scale in like a boss!)
BUY LIMIT LAYER 1: 6475.00
BUY LIMIT LAYER 2: 6460.00
BUY LIMIT LAYER 3: 6440.00
(Add more layers if needed – flexibility is key!)
🛑 STOP LOSS: 6400.00 (Thief’s Emergency Exit – adjust based on your risk!)
🎯 TARGET: 6600.00 (First profit zone – trail or take gains!)
🦹♂️ THIEF TRADER’S MASTER PLAN:
"We don’t ask for permission – we take profits."
🔹 ENTRY TACTICS:
Use multiple limit orders (LAYERED STRATEGY) – like planting timed explosives at key levels.
No panic entries – thieves strike with precision, not emotion.
DCA if needed – but keep bullets for the real move.
🔹 STOP LOSS RULES:
6400 = Danger Zone – if price breaks, abort mission & regroup.
SL too tight? You’ll get stopped out by market noise. SL too wide? You’ll bleed. Find balance.
🔹 TAKE PROFIT STRATEGY:
First TP @ 6600 – secure partial profits.
Let runners ride with trailing stop – or full exit if momentum fades.
🚨 THIEF’S GOLDEN RULES:
✅ Only LONG – no revenge shorts, no greed traps.
✅ Trade in SILENCE – avoid high-impact news (CPI, NFP, Fed).
✅ Risk management = Survival – don’t blow your account on one play.
✅ BOOST & SHARE – if this plan helps, spread the word!
📢 FINAL WARNING:
"This is not financial advice – it’s a thief’s blueprint.
Plan your escape before entry. Market heists require discipline."
💬 COMMENT "ROBBING SPX" if you’re in!
🔥 LIKE & BOOST if you ride with the Thief Trader crew!
🦹♂️ THIEF TRADER OUT.
💸 STEAL SMART. GET RICH. REPEAT.
In September, the S&P 500 Index Reached a New All-Time HighIn September, the S&P 500 Index Reached a New All-Time High
September is a month that statistically has the worst reputation for the S&P 500. However, in 2025 things may be different, as today the index hit a record high, rising above 6,520 points.
Bullish sentiment is being driven by:
→ expectations of an interest rate cut in September, which is believed will give the US economy a positive boost (and increase corporate profits);
→ yesterday’s release of the ISM Services PMI (actual = 52.0, forecast = 50.9), which pointed to industrial growth;
→ strong corporate results – for example, Broadcom (AVGO) published a solid report yesterday.
Technical Analysis of the S&P 500 Chart
Analysing the 4-hour chart of the S&P 500 on 28 August, we:
→ identified a support zone below 6,370;
→ noted several bearish signals and suggested that 6,500 could act as psychological resistance (with a potential false bullish breakout).
Indeed, since then (as shown by the blue arrows):
→ the price made a false breakout above 6,500;
→ then dropped to 6,370 to test the support zone;
→ after which it turned upwards again, forming a broad bullish engulfing pattern.
New data allows us to refine the position of the short-term channel (marked in blue), with the following perspectives:
→ Bearish view: the price is close to the upper boundary of the channel, which already showed resistance this morning (highlighted by the red arrow) – the candlestick has a long upper shadow.
→ Bullish view: yesterday’s rally demonstrated signs of imbalance in favour of buyers (as detailed in the description of the Fair Value Gap pattern), and the breakout above 6,500 looks genuine (since the price is consolidating above it).
Both viewpoints seem to be well-reasoned, but the market is unlikely to remain in balance, as today (15:30 GMT+3) the release of US labour market data is scheduled – arguably the key event of the week in the economic calendar.
Depending on the figures, the S&P 500 might:
→ attempt to break through the upper boundary;
→ or retreat towards the median of the blue channel.
Be prepared for volatility spikes.
This article represents the opinion of the Companies operating under the FXOpen brand only. It is not to be construed as an offer, solicitation, or recommendation with respect to products and services provided by the Companies operating under the FXOpen brand, nor is it to be considered financial advice.

S&P500 about to BREAK downLook at the chart, its very EVIDENT. with this overbought and bullish sentiment, i expect the markets to CORRECT further. its still extreme greedy. You can see the support lines. S&P can correct somewhere between 5-9%. Be prepared.
SP:SPX TVC:SPX CBOE:SPX SPREADEX:SPX CBOE:XSP

SPX500 Bullish Breakout!
HI,Traders !
#SPX500 is trading in a
Strong uptrend and is made a bullish
Breakout of the key
Horizontal level of 6470.89
Which is now a support
And as the breakout is
Confirmed we will be
Expecting a further bullish !
Comment and subscribe to help us grow !

SPX500 Bearish Breakout!
HI,Traders !
#SPX500 made a bearish
Breakout of the rising support
Line and we are bearish biased
So we will be expecting a
Further bearish move down !
Comment and subscribe to help us grow !

SPX Weak Bearish Bias → 6440P Caution Trade
# 🏦 SPX Weekly Options Analysis – 8/18
📉 **Market Context**
* Mixed signals across metrics → weak bearish bias
* Price below VWAP → potential short-term downside
* Volume insufficient → low conviction
* Call/Put ratio neutral → no strong directional bias
---
## 🎯 Trade Setup (Cautious Put)
* **Instrument**: SPX
* **Direction**: PUT (SHORT)
* **Strike**: 6440
* **Expiry**: 2025-08-18
* **Entry Price**: \$0.60
* **Profit Target**: \$1.20
* **Stop Loss**: \$0.30
* **Size**: 1 contract
* **Confidence**: 60%
* **Entry Timing**: Market Close
---
## 📈 Breakeven @ Expiry
👉 6439.40 (Strike – Premium)
SPX must **close < 6439.40 by market close** to profit at expiry.
---
## 🧠 Key Risks
* Mixed signals → potential whipsaw ⚡
* Market structure unclear → downside not guaranteed
* Theta decay risk → short-term option, fast time decay
---
# ⚡ SPX 6440P SHORT PLAY ⚡
🎯 In: \$0.60 → Out: \$1.20
🛑 Stop: \$0.30
📅 Exp: 8/18
📈 Bias: Weak Bearish, trade cautiously 🐻
---
📊 **TRADE DETAILS JSON**
```json
{
"instrument": "SPX",
"direction": "put",
"strike": 6440.0,
"expiry": "2025-08-18",
"confidence": 0.60,
"profit_target": 1.20,
"stop_loss": 0.30,
"size": 1,
"entry_price": 0.60,
"entry_timing": "close",
"signal_publish_time": "2025-08-18 15:02:25 UTC-04:00"
}

"US500 BREAKOUT – TIME TO LOAD LIMIT ORDERS FOR THE PUMP?"🔥🦹♂️ "SPX500 BANK HEIST – LAYERED BULL RAID IN PROGRESS!" 💰📈
(Thief Trader’s Multi-Limit Order Bullish Ambush – No Weak Hands Allowed)
📍 ASSET: US500 / SPX500 (S&P 500 INDEX)
🎯 HEIST PLAN: BULLISH BREAKOUT
💣 ENTRY: ANY PRICE LEVEL (Thieves use Layered Limit Orders – adapt like a pro!)
🔫 SAMPLE LAYERS: (Scale in like a boss!)
BUY LIMIT LAYER 1: 6475.00
BUY LIMIT LAYER 2: 6460.00
BUY LIMIT LAYER 3: 6440.00
(Add more layers if needed – flexibility is key!)
🛑 STOP LOSS: 6400.00 (Thief’s Emergency Exit – adjust based on your risk!)
🎯 TARGET: 6600.00 (First profit zone – trail or take gains!)
🦹♂️ THIEF TRADER’S MASTER PLAN:
"We don’t ask for permission – we take profits."
🔹 ENTRY TACTICS:
Use multiple limit orders (LAYERED STRATEGY) – like planting timed explosives at key levels.
No panic entries – thieves strike with precision, not emotion.
DCA if needed – but keep bullets for the real move.
🔹 STOP LOSS RULES:
6400 = Danger Zone – if price breaks, abort mission & regroup.
SL too tight? You’ll get stopped out by market noise. SL too wide? You’ll bleed. Find balance.
🔹 TAKE PROFIT STRATEGY:
First TP @ 6600 – secure partial profits.
Let runners ride with trailing stop – or full exit if momentum fades.
🚨 THIEF’S GOLDEN RULES:
✅ Only LONG – no revenge shorts, no greed traps.
✅ Trade in SILENCE – avoid high-impact news (CPI, NFP, Fed).
✅ Risk management = Survival – don’t blow your account on one play.
✅ BOOST & SHARE – if this plan helps, spread the word!
📢 FINAL WARNING:
"This is not financial advice – it’s a thief’s blueprint.
Plan your escape before entry. Market heists require discipline."
💬 COMMENT "ROBBING SPX" if you’re in!
🔥 LIKE & BOOST if you ride with the Thief Trader crew!
🦹♂️ THIEF TRADER OUT.
💸 STEAL SMART. GET RICH. REPEAT.