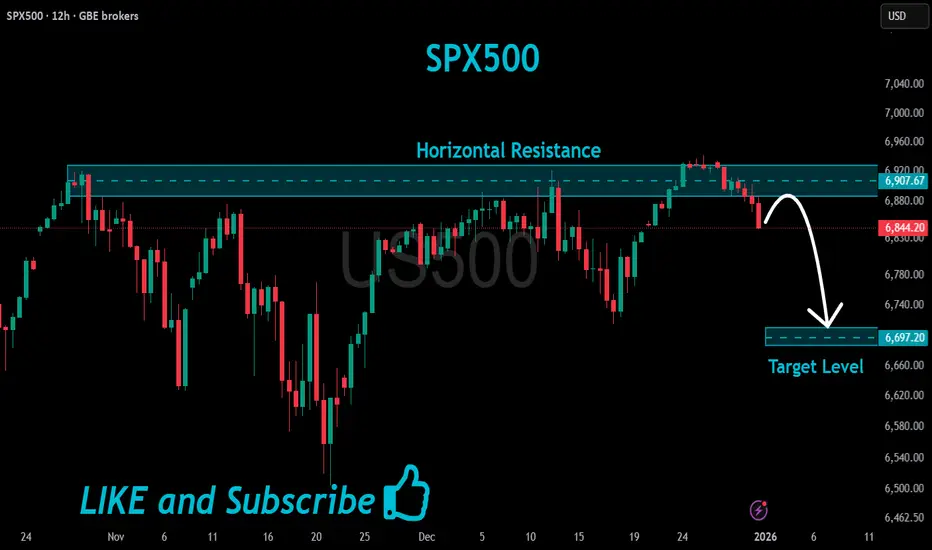
US500 Will Go Down!
HI,Traders !
#US500 has made a retest
Of the horizontal resistance
Of 6907.67 and we are already
Seeing a bearish reaction so
We are bearish biased and
Therefore a local bearish
Pullback is to be expected !
Comment and subscribe to help us grow !
Spx500idea
S&P 500 Hits ATH — Fake Breakout & Start of a Major Correction?The S&P 500 Index ( OANDA:SPX500USD ), as I previously expected , has begun to rise and even reached a New All-Time High($6,823).
It appears that the S&P 500 Index has lost its uptrend line and is currently moving just above the resistance zone($6,930_$6,892). The key point here is that this break above the resistance zone($6,930_$6,892) hasn’t occurred with high volume, and there’s also a noticeable Regular Divergence (RD-).
From an Elliott Wave perspective, it seems that the S&P 500 Index has completed main wave 5 at the new All-Time High(ATH), indicating a potential fake breakout above the resistance level.
I expect that the S&P 500 Index may begin to decline and could drop at least to around $6,879, with the next target potentially filling a Runaway Gap($6,857.80_$6,850.80).
What are your thoughts on the S&P 500 Index? How do you see the U.S. stock market unfolding in 2026? I’d love to hear your opinion!
First Target: $6,879
Second Target: Runaway Gap($6,857.80_$6,850.80)
Stop Loss(SL): $6,952
Note: A decline in the S&P 500 index could also affect Bitcoin( BINANCE:BTCUSDT )(due to Bitcoin's correlation with the S&P 500 index).
💡 Please respect each other's opinions and express agreement or disagreement politely.
📌S&P 500 Index Analyze (SPX500USD), 1-hour time frame.
🛑 Always set a Stop Loss(SL) for every position you open.
✅ This is just my idea; I’d love to see your thoughts too!
🔥 If you find it helpful, please BOOST this post and share it with your friends.

S&P 500 index at PRZ — Next Bullish Rally!!!In general, I place significant importance on the S&P 500 index( SP:SPX ), especially over the past month, because of its strong correlation with the crypto market, particularly Bitcoin( BINANCE:BTCUSDT ). When sharp movements occur in the S&P 500 index, we often see a mirrored effect in the crypto market and Bitcoin’s chart.
Currently, the S&P 500 index is moving near the support zone($6,776_$6,712) and the Potential Reversal Zone(PRZ) , and it appears to have successfully broken the upper line of the descending channel, which is a positive sign for a continued bullish trend in the coming days.
From an Elliott Wave perspective, it seems that the S&P 500 has completed a zigzag correction(ABC/5-3-5) within the descending channel, and we can expect an upward wave towards the resistance zone($6,853_$6,823).
I expect that the S&P 500 will begin to rise again from the Potential Reversal Zone(PRZ) and could climb at least up to $6,816. If it breaks resistance zone($6,853_$6,823), we can expect even more gains, which can also positively impact the broader markets.
What’s your outlook on the S&P 500 index and the U.S. stock market?
First Target: $6,816
Second Target: $6,834
Stop Loss(SL): $6,739(Worst)
Note: During U.S. trading hours, market volatility and emotions tend to increase. Please make sure to apply strict risk and capital management.
💡 Please respect each other's opinions and express agreement or disagreement politely.
📌S&P 500 Index Analyze (SPX500USD), 1-hour time frame.
🛑 Always set a Stop Loss(SL) for every position you open.
✅ This is just my idea; I’d love to see your thoughts too!
🔥 If you find it helpful, please BOOST this post and share it with your friends.

S&P 500 Breakdown Alert — Rising Wedge Reversal in Play!Today I want to share an S&P 500 index( SP:SPX ) analysis, as this index plays a major role in guiding correlated markets—especially crypto, and particularly Bitcoin( BINANCE:BTCUSDT ).
The S&P 500 index entered the Potential Reversal Zone(PRZ) and resistance zone($6,902_$6,875), where it began to fall.
The S&P 500 index also failed to form new Higher Highs(HH) and Higher Lows(HL), which signals weakening bullish momentum over the past 7 trading sessions.
From a classical technical-analysis perspective, it appears that the S&P 500 index has broken below the lower line of its rising wedge pattern, which is considered a bearish reversal pattern. The index is currently in the process of completing a pullback/retest of the broken structure.
My expectation is that the S&P 500 index may decline at least toward $6,823, and if important support lines break, we could see a deeper correction toward the measured move (target) of the rising-wedge pattern.
What’s your outlook on the S&P 500 index and the U.S. stock market?
First Target: $6,823
Second Target: $6,803
Stop Los(SL): $6,889(Worst)
------------------------------------------------
We should also keep in mind that several important US economic indicators will be released this week, which could significantly impact market direction. So be extra cautious with your positions, especially during data releases:
JOLTS Job Openings➡️09 December
Federal Funds Rate➡️10 December
FOMC Statement➡️10 December
FOMC Press Conference➡️10 December
Unemployment Claims➡️11 December
------------------------------------------------
💡 Please respect each other's opinions and express agreement or disagreement politely.
📌S&P 500 Index Analyze (SPX500USD), 1-hour time frame.
🛑 Always set a Stop Loss(SL) for every position you open.
✅ This is just my idea; I’d love to see your thoughts too!
🔥 If you find it helpful, please BOOST this post and share it with your friends.

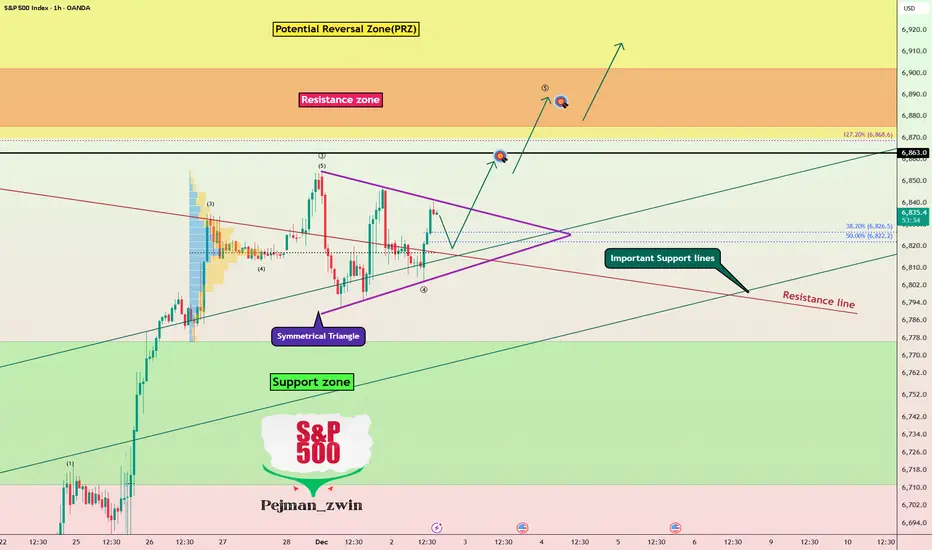
S&P 500 index Bull Run Continues — Symmetrical Triangle BreakoutThe S&P 500 index( SP:SPX ) has shown solid bullish momentum over the last 7 trading days, gaining more than +5% during this period.
The S&P 500 has once again moved back above Important Support lines, and it now appears to be breaking through a resistance line as well.
From a classical technical analysis perspective, the S&P 500 seems to be moving inside a symmetrical triangle pattern.
From an Elliott Wave standpoint, the S&P 500 looks to be completing Wave 4. A confirmed breakout above the upper line of the symmetrical triangle could validate the end of Wave 4.
I expect the S&P 500 to continue its upward movement and extend toward the Potential Reversal Zone(PRZ) and the Resistance zone ($6,902_$6,875).
What’s your view on the S&P 500 index and the broader U.S. stock market?
First Target: $6,859
Second Target: $6,887
Stop Los(SL): $6,774(Worst)
💡 Please respect each other's opinions and express agreement or disagreement politely.
📌S&P 500 Index Analyze (SPX500USD), 1-hour time frame.
🛑 Always set a Stop Loss(SL) for every position you open.
✅ This is just my idea; I’d love to see your thoughts too!
🔥 If you find it helpful, please BOOST this post and share it with your friends.
S&P 500 (ES1!): Bullish! Look For Valid Buys!Welcome back to the Weekly Forex Forecast or the week of Dec. 1-5th.
In this video, we will analyze the following FX market: S&P 500 (ES1!)
The S&P500 rallied last week, closing strong! Look for follow through going into this week.
Go with the overall bullish trend until there is a bearish market structure break.
Enjoy!
May profits be upon you.
Leave any questions or comments in the comment section.
I appreciate any feedback from my viewers!
Like and/or subscribe if you want more accurate analysis.
Thank you so much.
Disclaimer:
I do not provide personal investment advice and I am not a qualified licensed investment advisor.
All information found here, including any ideas, opinions, views, predictions, forecasts, commentaries, suggestions, expressed or implied herein, are for informational, entertainment or educational purposes only and should not be construed as personal investment advice. While the information provided is believed to be accurate, it may include errors or inaccuracies.
I will not and cannot be held liable for any actions you take as a result of anything you read here.
Conduct your own due diligence, or consult a licensed financial advisor or broker before making any and all investment decisions. Any investments, trades, speculations, or decisions made on the basis of any information found on this channel, expressed or implied herein, are committed at your own risk, financial or otherwise.

S&P 500 Roadmap: Correction Rally Ending—Another Drop Is ComingAs I expected in the previous idea , the S&P 500 index( SP:SPX ) moved toward the broken Support lines and completed its pullback, reaching its targets.
Given that the S&P 500 index nowadays shows a significant correlation with the cryptocurrency market and Bitcoin( BINANCE:BTCUSDT ), it’s wise to pay even more attention to this index, as it can help us gauge the crypto market trends.
The S&P 500 is approaching a Resistance zone($6,675_$6,637), and considering the momentum of last weekend’s decline, it appears that this recent upward movement is merely a correction. Therefore, we should expect another decline in the S&P 500.
Since the U.S. dollar index( TVC:DXY ) is also likely to maintain an upward trend, the rise in the dollar can lead to more capital flowing into safer assets, potentially impacting the S&P 500 negatively.
The S&P 500 is also influenced by the US 10-Year Government Bond Yield( TVC:US10 ). If the US 10-Year Government Bond Yield trends upwards , then riskier assets like cryptocurrencies might go down more, and this, in turn, could also impact the S&P 500.
Considering all the above, I expect that the S&P 500 will at least test its Support zone($6,580_$6,490) again and, if that Support zone($6,580_$6,490) is broken, we could anticipate further declines in the U.S. stock market and the S&P 500.
First Target: $6,526
Second Target: $6,413
Stop Los(SL): $6,731
💡 Please respect each other's opinions and express agreement or disagreement politely.
📌S&P 500 Index Analyze (SPX500USD), 4-hour time frame.
🛑 Always set a Stop Loss(SL) for every position you open.
✅ This is just my idea; I’d love to see your thoughts too!
🔥 If you find it helpful, please BOOST this post and share it with your friends.

SPX Idea 23.11.2025I also have several scenarios for SPX, unfortunately for this one, it's not possible otherwise. I would consider a potential short first when the SFP is above the weight at the price level of 6883 and then above the new ATH. I would open a long position at the level around Vwap 6453, where the daily level is also nearby, and then at the level of 6200, where the Vwap and weekly levels are located for context, and then a little lower, the Fibo level of 0.382.

SPX500 Will Go Down!
HI,Traders !
#SPX500 made a retest
Of the horizontal resistance
Level of 6678.85 from where
We are already seeing a
Bearish reaction so we are
Locally bearish biased and
We will be expecting a
Further local move down !
Comment and subscribe to help us grow !

SPX500 Breakdown Warning: Major Supports— Bigger Crash Ahead?The S&P 500 index ( SP:SPX ) has become increasingly significant recently, and it has a notable impact on cryptocurrency markets, especially Bitcoin ( BINANCE:BTCUSDT ). Therefore, analyzing the S&P 500 not only benefits its own market but also enhances our understanding of related markets.
Fundamental Analysis:
Volume confirms distribution, while the ongoing U.S. government shutdown delays critical data (CPI, PPI), fueling uncertainty and risk-off sentiment. Fed’s hawkish pause on rate cuts and tech sector rotation (TSLA -6%( NASDAQ:TSLA ), NVDA -3.5%( NASDAQ:NVDA )) reinforce bearish momentum. Also, YTD performance now -3.2% in November — on pace for the worst monthly drop since 2008 (-7.5%
Technical Analysis:
From a technical perspective, the S&P 500 index is breaking the Support zone($6,773_$6,710) and moving near the Support lines and 50_SMA(Daily) . Given recent data, there’s a possibility that these supports may break.
Additionally, according to Elliott Wave Theory , we can expect more corrective waves ahead.
I expect the SPX500 index to decline to $6,633 after the support cluster is broken in the first step.
First Target: $6,633
Second Target: $6,583
Stop Los(SL): $6,815
Please respect each other's ideas and express them politely if you agree or disagree.
S&P 500 Index Analyze (SPX500USD), 4-hour time frame.
Be sure to follow the updated ideas.
Do not forget to put a Stop loss for your positions (For every position you want to open).
Please follow your strategy and updates; this is just my Idea, and I will gladly see your ideas in this post.
Please do not forget the ✅' like '✅ button 🙏😊 & Share it with your friends; thanks, and Trade safe.

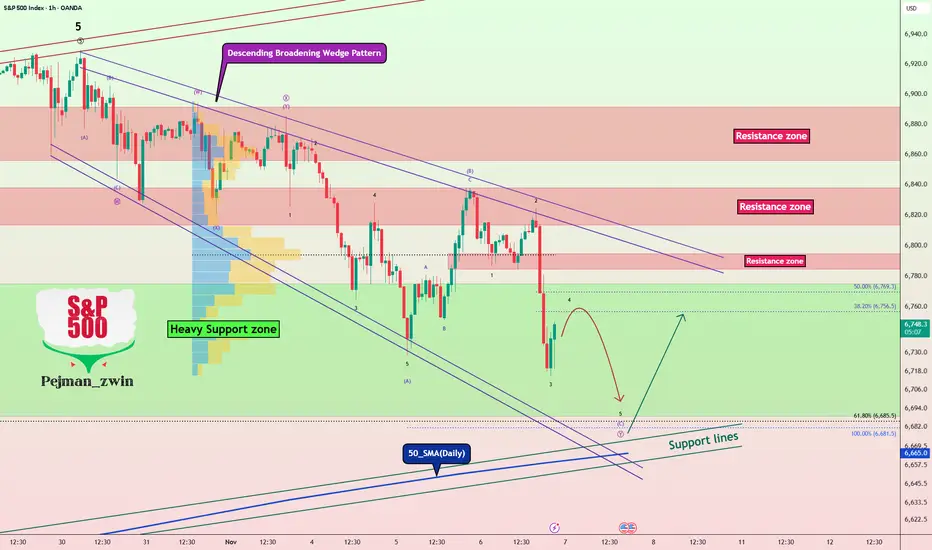
S&P 500 at Make-or-Break Level – Bulls’ Last Chance!As I expected in the previous idea , the S&P 500 index ( SP:SPX ) has reached its target.
Given that the S&P 500 index has a strong correlation with other financial markets, especially Bitcoin ( BINANCE:BTCUSDT )—sometimes even tracking them candle-by-candle—it's a good idea to pay extra attention to the S&P 500 index these days.
Currently, the S&P 500 index is moving in a Heavy Support zone($6,775_$6,689) , although it entered this zone with a lot of downside momentum.
From a classic technical analysis perspective, there's still a chance that the descending broadening wedge pattern will hold. As long as this pattern isn't invalidated, we can still hope for at least a short-term bullish move.
From an Elliott Wave perspective , it seems like the S&P 500 index is completing the microwave 4 of the microwave C of the main wave Y within the descending broadening wedge.
I expect that after the next small dip, the S&P 500 index will start rising again from near the lower boundary of the wedge, the 50_SMA(Daily) , and Support lines .
Note: If the S&P 500 index falls below about $6,650, we should expect further downside. So let's keep an eye on that level.
Please respect each other's ideas and express them politely if you agree or disagree.
S&P 500 Index Analyze (SPX500USD), 1-hour time frame.
Be sure to follow the updated ideas.
Do not forget to put a Stop loss for your positions (For every position you want to open).
Please follow your strategy and updates; this is just my Idea, and I will gladly see your ideas in this post.
Please do not forget the ✅' like '✅ button 🙏😊 & Share it with your friends; thanks, and Trade safe.
S&P 500 at Critical Support – Last Line of Defense?Since the S&P 500 index( SP:SPX ) is one of the key indicators in the financial markets, and it’s been highly correlated with parallel markets recently, it's always a good idea to keep an eye on its analysis.
Now, for example, Bitcoin ( BINANCE:BTCUSDT ) started to decline as the S&P 500 index dropped, and right now the S&P 500 index is at a pretty critical Support zone($6,774_$6,689) and Support lines. It's essentially moving right around its last line of hope.
From an Elliott Wave theory perspective, in this current zone, the S&P 500 index could be completing the Triple Three Correction(WXYXZ)=main wave 4.
Looking ahead, we might expect the S&P 500 index to climb up toward its Resistance zone($6,894_$6,859). And given the current positioning, the risk-to-reward ratio looks quite favorable—as long as you keep a reasonable stop loss in place and practice good risk management.
Note: if these Support lines break downward, we could see further declines in the S&P 500 index and in those correlated markets as well. So it's definitely something to monitor closely.
Please respect each other's ideas and express them politely if you agree or disagree.
S&P 500 Index Analyze (SPX500USD), 1-hour time frame.
Be sure to follow the updated ideas.
Do not forget to put a Stop loss for your positions (For every position you want to open).
Please follow your strategy and updates; this is just my Idea, and I will gladly see your ideas in this post.
Please do not forget the ✅' like '✅ button 🙏😊 & Share it with your friends; thanks, and Trade safe.

S&P 500 Bulls Back in Control – New All-Time High Ahead?As I expected in my previous idea , the S&P 500 index( SP:SPX ) pulled back from its Resistance lines and hit its target.
Right now, the S&P 500 index is in the process of breaking through a Resistance zone($6,894_$6,859). Just a few hours ago, it successfully broke above the upper line of a descending channel , which is a positive sign for a renewed upward move .
From an Elliott Wave perspective, it seems that the S&P 500 index has completed its main wave four, and after breaking this Resistance zone($6,894_$6,859) , we can anticipate the start of a main wave 5 .
I expect that once the S&P 500 index breaks through this Resistance zone($6,894_$6,859) , it will likely climb at least up to the next Resistance lines and the Potential Reversal Zone (PRZ) .
Note: The cryptocurrency market, and especially Bitcoin( BINANCE:BTCUSDT ), has been highly correlated with the S&P 500 index these weeks.
Please respect each other's ideas and express them politely if you agree or disagree.
S&P 500 Index Analyze (SPX500USD), 1-hour time frame.
Be sure to follow the updated ideas.
Do not forget to put a Stop loss for your positions (For every position you want to open).
Please follow your strategy and updates; this is just my Idea, and I will gladly see your ideas in this post.
Please do not forget the ✅' like '✅ button 🙏😊 & Share it with your friends; thanks, and Trade safe.

S&P 500 (ES1!): Bullish! Buy This Dip!Welcome back to the Weekly Forex Forecast for the week of Nov. 3 - 7th.
In this video, we will analyze the following FX market: S&P 500 (ES1!)
The S&P500 is bullish, and buys are valid.
Price is currently in a +FVG, so looking for sells is prohibited!
If the +FVG fails, only then will buys become invalid.
Enjoy!
May profits be upon you.
Leave any questions or comments in the comment section.
I appreciate any feedback from my viewers!
Like and/or subscribe if you want more accurate analysis.
Thank you so much!
Disclaimer:
I do not provide personal investment advice and I am not a qualified licensed investment advisor.
All information found here, including any ideas, opinions, views, predictions, forecasts, commentaries, suggestions, expressed or implied herein, are for informational, entertainment or educational purposes only and should not be construed as personal investment advice. While the information provided is believed to be accurate, it may include errors or inaccuracies.
I will not and cannot be held liable for any actions you take as a result of anything you read here.
Conduct your own due diligence, or consult a licensed financial advisor or broker before making any and all investment decisions. Any investments, trades, speculations, or decisions made on the basis of any information found on this channel, expressed or implied herein, are committed at your own risk, financial or otherwise.

S&P 500 Index Showing Weakness – Correction Ahead?Over the past seven days, the S&P 500 index( SP:SPX ) has been on a bullish run, frequently hitting new all-time highs. However, in the last two or three weeks, it's been influenced by the ongoing tariff tensions between the U.S. and China .
Let's look at the latest news about the S&P 500 index :
The IMF has flagged that market valuations might be a bit high, hinting at possible corrections. Plus, there's been a fresh look at how well China’s sticking to the 2020 trade deal, and on top of that, a new trade agreement in Southeast Asia is in the mix. So that’s the quick rundown!
Right now, if we look at the S&P 500 on a 1-hour timeframe, the index is near its Resistance lines and has lost its uptrend line , which is a sign of weakening momentum .
We also saw a Shooting Star Candlestick pattern form in the last few hours with good volume, adding credibility to the potential for a pullback .
From an Elliott Wave standpoint, it seems the S&P 500 has completed its wave 3, and we might see a wave 4 correction in the coming hours or days.
There's a noticeable Negative Regular Divergence(RD-) between the recent tops , and even on the daily timeframe, there's a divergence signaling potential weakness.
I expect the S&P 500 could drop at least to its Support line , around the $6,857 .
Note: The cryptocurrency market, and especially Bitcoin , has been highly correlated with the S&P 500 index these weeks, and a possible correction in this index could lead to a correction in this market.
Please respect each other's ideas and express them politely if you agree or disagree.
S&P 500 Index Analyze (SPX500USD), 1-hour time frame.
Be sure to follow the updated ideas.
Do not forget to put a Stop loss for your positions (For every position you want to open).
Please follow your strategy and updates; this is just my Idea, and I will gladly see your ideas in this post.
Please do not forget the ✅' like'✅ button 🙏😊 & Share it with your friends; thanks, and Trade safe.

SPX500 Bullish Breakout!
HI,Traders !
#SPX500 is going up now
And the price broke the
Key horizontal level
Around 6695.82 and
The breakout is confimred
So we are bullish biased
And we will be expecting
A further bullish move up !
Comment and subscribe to help us grow !

BUY SPX - S&P500- Amazing low risk high reward trade!Based on our deep analysis we can see that SPX - S&P500 will head to the upside. Great time to buy - it has broken major resistance levels + trends.

SPX500 Long From Support!
HI,Traders !
#SPX500 made a retest
Of the wide horizontal
Support level of 6581.19
And a local rebound is
Already taking place so
We are bullish baised
And we think that a local
Bullish correction is to
Be expected !
Comment and subscribe to help us grow !

SPX500 Local Short!
HI,Traders !
#SPX500 made a nice
Bullish move up and
made a retest of
The horizontal resistance
Level of 6750.77 from where
We are already seeing a bearish
Reaction and so we will be
Expecting a further move down !
Comment and subscribe to help us grow !

SPX500 Bearish Breakout!
HI,Traders !
#SPX500 made a bearish
Breakout of the rising support
Line and we are bearish biased
Therefore, after retesting the sell cluster area
at 6643.11 So we will be expecting a Further
bearish move down !
Comment and subscribe to help us grow !

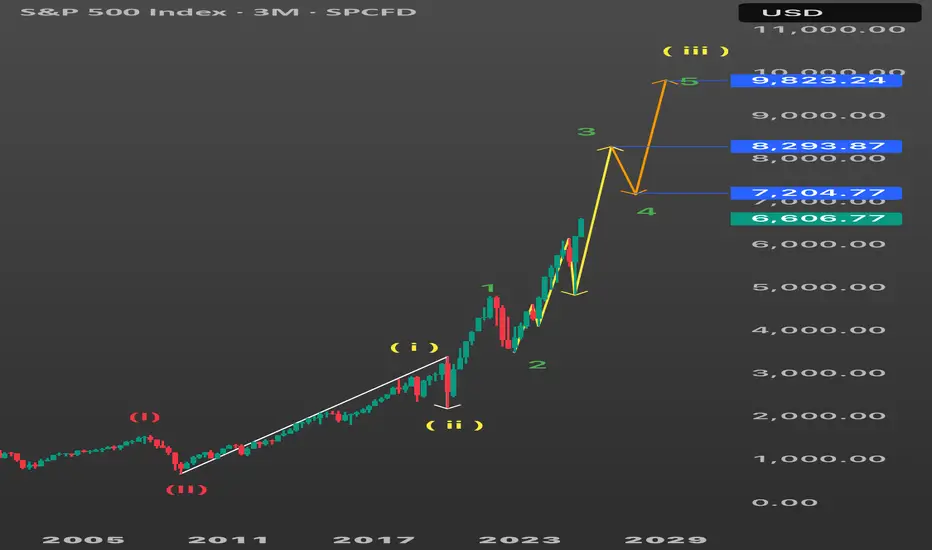
SPX Elliott Count. (W3 of 3). S&P 500: Elliott Wave.
Targets:
8,293 then 7,204 finally 9,823.
SPX is currently in sub-wave 5 in W3 of W3. From this point we should see an aggressive push to 8,293 following a pullback then continuation.
S&P 500 (ES1!): Short Term Sells For Longer Term Buys TargetsWelcome back to the Weekly Forex Forecast for the week of Sept 1 - 5th.
In this video, we will analyze the following FX market: S&P 500 (ES1!)
The S&P500 has been strong, but gave a bearish close on Friday. Looking at the Daily, it is easy to see price is retracing lower, perhaps to the +FVG, which is a great place to look for longs once contacted.
Short term sells are permissible, but be mindful the HTFs are bullish.
Enjoy!
May profits be upon you.
Leave any questions or comments in the comment section.
I appreciate any feedback from my viewers!
Like and/or subscribe if you want more accurate analysis.
Thank you so much!
Disclaimer:
I do not provide personal investment advice and I am not a qualified licensed investment advisor.
All information found here, including any ideas, opinions, views, predictions, forecasts, commentaries, suggestions, expressed or implied herein, are for informational, entertainment or educational purposes only and should not be construed as personal investment advice. While the information provided is believed to be accurate, it may include errors or inaccuracies.
I will not and cannot be held liable for any actions you take as a result of anything you read here.
Conduct your own due diligence, or consult a licensed financial advisor or broker before making any and all investment decisions. Any investments, trades, speculations, or decisions made on the basis of any information found on this channel, expressed or implied herein, are committed at your own risk, financial or otherwise.

SPX500 Bullish Breakout!
HI,Traders !
#SPX500 is trading in a
Strong uptrend and is made a bullish
Breakout of the key
Horizontal level of 6470.89
Which is now a support
And as the breakout is
Confirmed we will be
Expecting a further bullish !
Comment and subscribe to help us grow !
