S&P 500: Retest Done — Next Push to New ATH?The S&P 500 index ( SP:SPX ) completed its downward movement as I expected in the previous idea (full target) .
Currently, the S&P 500 index has managed to break the resistance zone($6,956-$6,918) and is completing a pullback to this zone.
In terms of Elliott wave theory, it seems that the S&P 500 index has managed to complete the main wave 4 and is currently completing the main wave 5.
I expect the S&P 500 index to succeed in forming a new All-Time High(ATH) after breaking the resistance lines.
First Target: $7,031
Second Target: Resistance lines
Stop Loss(SL): $6,896
Points may shift as the market evolves
Note: This week, important indexes will be released from the US, which could have a significant impact on the S&P 500 index trend.
💡 Please respect each other's opinions and express agreement or disagreement politely.
📌 S&P 500 Index Analyze (SPX500USD), 4-hour time frame.
🛑 Always set a Stop Loss(SL) for every position you open.
✅ This is just my idea; I’d love to see your thoughts too!
🔥 If you find it helpful, please BOOST this post and share it with your friends.
Spx500index

S&P 500In my view, the price is forming a bullish head‑and‑shoulders pattern. From here, it may see a slight correction to complete the second wave and form the right shoulder. After that, a breakout of the pattern could push the price above 7000.

S&P 500 Breakdown Retest — Bears in Control, Bigger Drop Ahead?Today, I want to share a short setup on the S&P 500( SP:SPX ). Given that the crypto market—especially Bitcoin( BINANCE:BTCUSDT )—has recently regained strong correlation with the S&P, this analysis may be important for the crypto community too.
The S&P 500, over the past 20 days, has shown upward moves with low volume, while downward moves have had stronger momentum and volume. This indicates bears (sellers) have more control. The reasons include Federal Reserve policy shifts and escalating Middle East tensions. Historically, such tensions have led to S&P declines.
From a technical perspective, on the 4-hour timeframe, the S&P 500 has broken its support zone($6,956-$6,925) and is pulling back to it.
From an Elliott Wave perspective, it seems the S&P 500 is completing its main wave 4, which likely has a Double Three Correction(WXY) structure.
I expect the S&P 500 to decline toward the support lines. If broken, we could see the index drop further to at least $6,853.
Note: If Middle East tensions escalate further, as news suggests, the index could drop suddenly. Conversely, any agreement (e.g., between Iran and the U.S.) could support a recovery. Stay tuned to the news flow.
Note: A decline in the S&P 500 to at least 6,850 could also lead to the loss of Bitcoin’s heavy support zone($78,260-$70,080).
First Target: Support lines
Second Target: $6,853
Stop Loss(SL): $6,979(Worst)
Points may shift as the market evolves
Can gold resume its bullish trend, or should we expect deeper corrections?
💡 Please respect each other's opinions and express agreement or disagreement politely.
📌 S&P 500 Index Analyze (SPX500USD), 4-hour time frame.
🛑 Always set a Stop Loss(SL) for every position you open.
✅ This is just my idea; I’d love to see your thoughts too!
🔥 If you find it helpful, please BOOST this post and share it with your friends.

S&P 500 Completes Wave 5 via Ending Diagonal — Correction Ahead?The S&P 500( FX:SPX500 ) is a crucial index in the financial markets, and understanding its trends can greatly help in analyzing other markets, such as cryptocurrencies, especially Bitcoin( BINANCE:BTCUSDT ).
The S&P 500 is currently near its resistance lines, and from a classic technical analysis perspective, it has formed a rising wedge pattern.
From the Elliott Wave perspective, it seems that the main wave 5 in the S&P 500 index has been completed via an ending diagonal.
Considering the ongoing tensions in the Middle East and the U.S. moving its forces to the region, there’s a possibility that these tensions may escalate in the coming days. Therefore, given that the S&P 500 is currently near its all-time highs, and based on our technical analysis, going long might be risky, and I currently favor short positions for the S&P 500.
I expect that after breaking the support zone($6,930_$6,892), the S&P 500 index could drop to around $6,863.
Furthermore, since Bitcoin has a correlation with the S&P 500, a decline in the S&P 500 could also lead to a drop in Bitcoin .
First Target: $6,923
Second Target: $6,863
Stop Loss(SL): $7,009
Points may shift as the market evolves
💡 Please respect each other's opinions and express agreement or disagreement politely.
📌S&P 500 Index Analyze (SPX500USD), 4-hour time frame.
🛑 Always set a Stop Loss(SL) for every position you open.
✅ This is just my idea; I’d love to see your thoughts too!
🔥 If you find it helpful, please BOOST this post and share it with your friends.
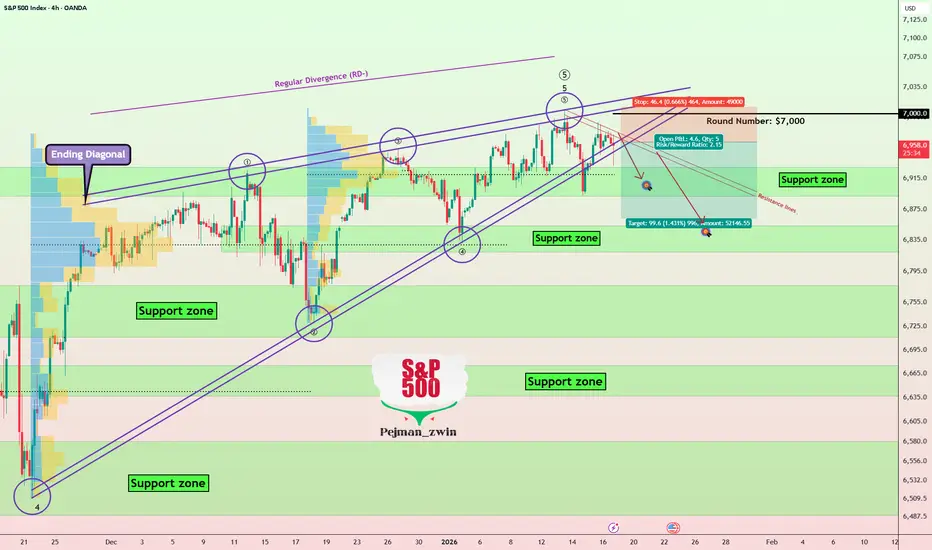
S&P 500 Hits ATH — Fake Breakout & Start of a Major Correction?The S&P 500 Index ( OANDA:SPX500USD ), as I previously expected , has begun to rise and even reached a New All-Time High($6,823).
It appears that the S&P 500 Index has lost its uptrend line and is currently moving just above the resistance zone($6,930_$6,892). The key point here is that this break above the resistance zone($6,930_$6,892) hasn’t occurred with high volume, and there’s also a noticeable Regular Divergence (RD-).
From an Elliott Wave perspective, it seems that the S&P 500 Index has completed main wave 5 at the new All-Time High(ATH), indicating a potential fake breakout above the resistance level.
I expect that the S&P 500 Index may begin to decline and could drop at least to around $6,879, with the next target potentially filling a Runaway Gap($6,857.80_$6,850.80).
What are your thoughts on the S&P 500 Index? How do you see the U.S. stock market unfolding in 2026? I’d love to hear your opinion!
First Target: $6,879
Second Target: Runaway Gap($6,857.80_$6,850.80)
Stop Loss(SL): $6,952
Note: A decline in the S&P 500 index could also affect Bitcoin( BINANCE:BTCUSDT )(due to Bitcoin's correlation with the S&P 500 index).
💡 Please respect each other's opinions and express agreement or disagreement politely.
📌S&P 500 Index Analyze (SPX500USD), 1-hour time frame.
🛑 Always set a Stop Loss(SL) for every position you open.
✅ This is just my idea; I’d love to see your thoughts too!
🔥 If you find it helpful, please BOOST this post and share it with your friends.

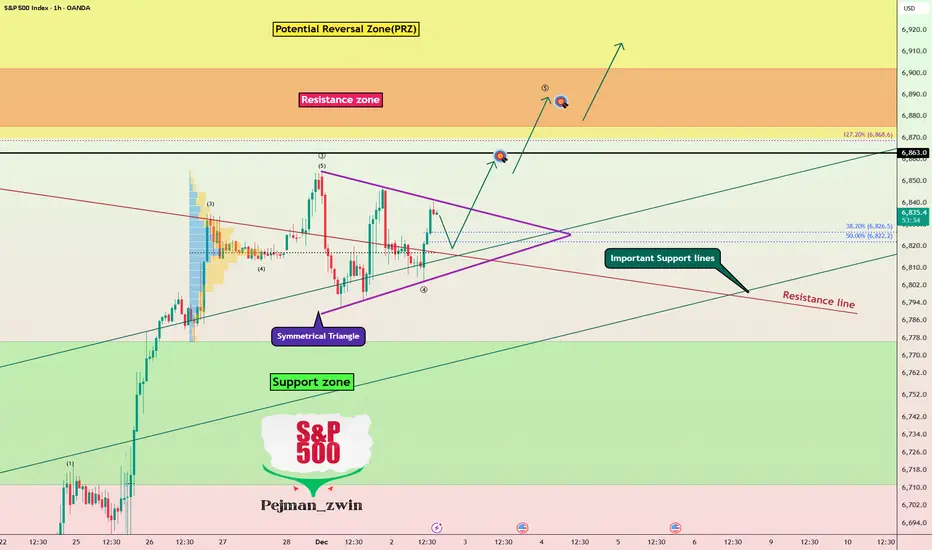
S&P 500 index at PRZ — Next Bullish Rally!!!In general, I place significant importance on the S&P 500 index( SP:SPX ), especially over the past month, because of its strong correlation with the crypto market, particularly Bitcoin( BINANCE:BTCUSDT ). When sharp movements occur in the S&P 500 index, we often see a mirrored effect in the crypto market and Bitcoin’s chart.
Currently, the S&P 500 index is moving near the support zone($6,776_$6,712) and the Potential Reversal Zone(PRZ) , and it appears to have successfully broken the upper line of the descending channel, which is a positive sign for a continued bullish trend in the coming days.
From an Elliott Wave perspective, it seems that the S&P 500 has completed a zigzag correction(ABC/5-3-5) within the descending channel, and we can expect an upward wave towards the resistance zone($6,853_$6,823).
I expect that the S&P 500 will begin to rise again from the Potential Reversal Zone(PRZ) and could climb at least up to $6,816. If it breaks resistance zone($6,853_$6,823), we can expect even more gains, which can also positively impact the broader markets.
What’s your outlook on the S&P 500 index and the U.S. stock market?
First Target: $6,816
Second Target: $6,834
Stop Loss(SL): $6,739(Worst)
Note: During U.S. trading hours, market volatility and emotions tend to increase. Please make sure to apply strict risk and capital management.
💡 Please respect each other's opinions and express agreement or disagreement politely.
📌S&P 500 Index Analyze (SPX500USD), 1-hour time frame.
🛑 Always set a Stop Loss(SL) for every position you open.
✅ This is just my idea; I’d love to see your thoughts too!
🔥 If you find it helpful, please BOOST this post and share it with your friends.

S&P 500 Breakdown Alert — Rising Wedge Reversal in Play!Today I want to share an S&P 500 index( SP:SPX ) analysis, as this index plays a major role in guiding correlated markets—especially crypto, and particularly Bitcoin( BINANCE:BTCUSDT ).
The S&P 500 index entered the Potential Reversal Zone(PRZ) and resistance zone($6,902_$6,875), where it began to fall.
The S&P 500 index also failed to form new Higher Highs(HH) and Higher Lows(HL), which signals weakening bullish momentum over the past 7 trading sessions.
From a classical technical-analysis perspective, it appears that the S&P 500 index has broken below the lower line of its rising wedge pattern, which is considered a bearish reversal pattern. The index is currently in the process of completing a pullback/retest of the broken structure.
My expectation is that the S&P 500 index may decline at least toward $6,823, and if important support lines break, we could see a deeper correction toward the measured move (target) of the rising-wedge pattern.
What’s your outlook on the S&P 500 index and the U.S. stock market?
First Target: $6,823
Second Target: $6,803
Stop Los(SL): $6,889(Worst)
------------------------------------------------
We should also keep in mind that several important US economic indicators will be released this week, which could significantly impact market direction. So be extra cautious with your positions, especially during data releases:
JOLTS Job Openings➡️09 December
Federal Funds Rate➡️10 December
FOMC Statement➡️10 December
FOMC Press Conference➡️10 December
Unemployment Claims➡️11 December
------------------------------------------------
💡 Please respect each other's opinions and express agreement or disagreement politely.
📌S&P 500 Index Analyze (SPX500USD), 1-hour time frame.
🛑 Always set a Stop Loss(SL) for every position you open.
✅ This is just my idea; I’d love to see your thoughts too!
🔥 If you find it helpful, please BOOST this post and share it with your friends.

SPX500 Bullish Plan in Motion with SMA + Kijun Confirmation🚀 US500/SPX500 INDEX MARKET SWING TRADE MASTERCLASS 🎯
📊 ASSET: S&P 500 Index (US500 | SPX500)
Timeframe: 4H-Daily | Strategy Type: Swing Trade | Market Context: Bullish Pullback Confirmation
🎲 TRADE SETUP: THE "THIEF PROTOCOL" STRATEGY ⚡
✅ TECHNICAL CONFIRMATION
🔹 Primary Signal: Simple Moving Average (SMA) Pullback Retest
🔹 Secondary Confirmation: Kijun-sen (Ichimoku MA) Retest
🔹 Market Structure: Higher Lows Formation + Bullish Consolidation
🔹 Bias: LONG with Layered Entry Methodology
💰 ENTRY STRATEGY: MULTI-LAYER LIMIT ORDER APPROACH
The "Thief Layering Method" - Stack multiple buy limit orders for optimal risk distribution:
🟢 Layer 1 Entry: $6,750.00 - Initial Probe Entry (30% Position Allocation)
🟢 Layer 2 Entry: $6,800.00 - Aggressive Add (35% Position Allocation)
🟢 Layer 3 Entry: $6,850.00 - Final Confirmation Entry (35% Position Allocation)
Entry Flexibility: Adjust layers based on your account size & risk tolerance. Spread entries across pullback zones for superior fill pricing.
🛑 STOP LOSS MANAGEMENT
Recommended SL Level: $6,720.00 - Placed below the support trendline + SMA confluence
⚠️ IMPORTANT DISCLAIMER: Dear Traders! This is YOUR trading journey. We strongly recommend adjusting stop loss based on YOUR risk management rules. Account sizing is crucial - never risk more than 2-3% per trade. Your SL placement = YOUR decision, YOUR responsibility. Use proper position sizing ALWAYS.
🎯 PROFIT TARGET ZONES
Primary Target: $7,050.00 ⚡
📊 Technical Reasoning: This level represents strong resistance confluence zone, historical supply level in overbought territory, and creates a risk/reward sweet spot of 1:3+ return potential. Alert: Trap zone exists here - smart money reversal area confirmed.
Exit Strategy Recommendation: Close 50% of position at $7,000-7,020 to lock partial profits. Hold remaining 50% with trailing stop or until $7,050 for maximum upside capture. Lock profits incrementally to secure gains.
⚠️ CRITICAL REMINDER: Your profit target = YOUR choice! This TP represents technical confluence, but market conditions evolve. Trade YOUR plan, manage YOUR risk, protect YOUR capital.
🌍 CORRELATED PAIRS TO WATCH 🔗
📈 PRIMARY CORRELATIONS
1️⃣ QQQ (Nasdaq-100 ETF) - 0.99 Correlation 💻
This is the tech-heavy composition that typically leads SPX rallies. Current focus remains on AI/Mag7 momentum and overall growth stock sentiment. Key watch: QQQ strength = SPX bullish confirmation signal. When QQQ breaks out, SPX follows closely.
2️⃣ IWM (Russell 2000 ETF) - 0.95 Correlation 📍
Small-cap composition with high tariff sensitivity. Current status shows small-cap underperformance zones vulnerable to trade policy shifts. Trading tip: IWM weakness = Sector rotation risk, so watch for divergence from SPX strength.
3️⃣ DXY (US Dollar Index) - Inverse/Mixed Correlation 💵
Recent positive correlation emerging in 2025 market dynamics. Current dynamic shows dollar strength now sometimes supports equities due to policy-driven factors. Risk factor alert: DXY spike above 108 = potential SPX headwind to monitor.
📊 SECONDARY WATCH PAIRS
SPY (S&P 500 ETF) - Mirror of SPX, use for volume confirmation and institutional positioning.
DIA (Dow Jones ETF) - Large-cap value barometer, less tech-sensitive than QQQ, shows rotation signals.
VIX (Volatility Index) - Above 25 = caution mode, below 15 = complacency warning.
📱 KEY CORRELATION INSIGHTS FOR THIS TRADE
🔴 RED FLAGS - Watch These Closely:
VIX spiking above 30 signals potential fear spike. DXY breaking above 108 creates dollar strength pressure. QQQ failing to confirm breakout indicates tech weakness divergence. IWM hitting new lows signals broad market weakness.
🟢 GREEN LIGHTS - Trade Confirmation:
QQQ and SPX moving in sync above SMA is bullish. IWM holding key support levels confirms breadth. DXY consolidating means no headwind pressure building. VIX below 20 indicates low fear environment.
🎯 TRADE PSYCHOLOGY & EXECUTION TIPS
✅ Pre-Trade Checklist:
Confirm SMA pullback on 4H chart before entry. Verify Kijun retest on Ichimoku indicator. Check QQQ alignment for correlation confirmation. Monitor DXY to avoid strong dollar days. Set alerts at all 3 entry layers for execution readiness.
✅ During Trade Management:
Take partial profit at 50% move up to secure gains. Move SL to breakeven after hitting first target. Trail stop every 50-pip move in your favor. Document your execution for journal review and performance tracking.
🔥 TRADE EXECUTION SUMMARY
Signal Type: Bullish Pullback Retest ✅ Confirmed
Entry Method: 3-Layer Limit Orders 🎯 Optimized for Best Fill Pricing
SL Level: $6,720.00 🛑 Defined and Placed Below Support
TP Level: $7,050.00 🎯 Defined at Resistance Confluence
Risk/Reward Ratio: 1:3+ 💰 Favorable Trade Structure
Best Tradeable Window: Next 48-72 Hours ⏰ Active Setup Zone
Good Luck, Traders! 🚀 Trade Smart. Trade Safe. Trade Often.
Remember: Your SL = Your Protection | Your TP = Your Goal | Your Risk = Your Responsibility
#SPX500 #SwingTrade #TechnicalAnalysis #TradingIdea #S&P500 #MarketAnalysis #TradeSetup #RiskManagement

S&P 500 index Bull Run Continues — Symmetrical Triangle BreakoutThe S&P 500 index( SP:SPX ) has shown solid bullish momentum over the last 7 trading days, gaining more than +5% during this period.
The S&P 500 has once again moved back above Important Support lines, and it now appears to be breaking through a resistance line as well.
From a classical technical analysis perspective, the S&P 500 seems to be moving inside a symmetrical triangle pattern.
From an Elliott Wave standpoint, the S&P 500 looks to be completing Wave 4. A confirmed breakout above the upper line of the symmetrical triangle could validate the end of Wave 4.
I expect the S&P 500 to continue its upward movement and extend toward the Potential Reversal Zone(PRZ) and the Resistance zone ($6,902_$6,875).
What’s your view on the S&P 500 index and the broader U.S. stock market?
First Target: $6,859
Second Target: $6,887
Stop Los(SL): $6,774(Worst)
💡 Please respect each other's opinions and express agreement or disagreement politely.
📌S&P 500 Index Analyze (SPX500USD), 1-hour time frame.
🛑 Always set a Stop Loss(SL) for every position you open.
✅ This is just my idea; I’d love to see your thoughts too!
🔥 If you find it helpful, please BOOST this post and share it with your friends.
S&P 500 Roadmap: Correction Rally Ending—Another Drop Is ComingAs I expected in the previous idea , the S&P 500 index( SP:SPX ) moved toward the broken Support lines and completed its pullback, reaching its targets.
Given that the S&P 500 index nowadays shows a significant correlation with the cryptocurrency market and Bitcoin( BINANCE:BTCUSDT ), it’s wise to pay even more attention to this index, as it can help us gauge the crypto market trends.
The S&P 500 is approaching a Resistance zone($6,675_$6,637), and considering the momentum of last weekend’s decline, it appears that this recent upward movement is merely a correction. Therefore, we should expect another decline in the S&P 500.
Since the U.S. dollar index( TVC:DXY ) is also likely to maintain an upward trend, the rise in the dollar can lead to more capital flowing into safer assets, potentially impacting the S&P 500 negatively.
The S&P 500 is also influenced by the US 10-Year Government Bond Yield( TVC:US10 ). If the US 10-Year Government Bond Yield trends upwards , then riskier assets like cryptocurrencies might go down more, and this, in turn, could also impact the S&P 500.
Considering all the above, I expect that the S&P 500 will at least test its Support zone($6,580_$6,490) again and, if that Support zone($6,580_$6,490) is broken, we could anticipate further declines in the U.S. stock market and the S&P 500.
First Target: $6,526
Second Target: $6,413
Stop Los(SL): $6,731
💡 Please respect each other's opinions and express agreement or disagreement politely.
📌S&P 500 Index Analyze (SPX500USD), 4-hour time frame.
🛑 Always set a Stop Loss(SL) for every position you open.
✅ This is just my idea; I’d love to see your thoughts too!
🔥 If you find it helpful, please BOOST this post and share it with your friends.

S&P 500 at Critical Support – Last Line of Defense?Since the S&P 500 index( SP:SPX ) is one of the key indicators in the financial markets, and it’s been highly correlated with parallel markets recently, it's always a good idea to keep an eye on its analysis.
Now, for example, Bitcoin ( BINANCE:BTCUSDT ) started to decline as the S&P 500 index dropped, and right now the S&P 500 index is at a pretty critical Support zone($6,774_$6,689) and Support lines. It's essentially moving right around its last line of hope.
From an Elliott Wave theory perspective, in this current zone, the S&P 500 index could be completing the Triple Three Correction(WXYXZ)=main wave 4.
Looking ahead, we might expect the S&P 500 index to climb up toward its Resistance zone($6,894_$6,859). And given the current positioning, the risk-to-reward ratio looks quite favorable—as long as you keep a reasonable stop loss in place and practice good risk management.
Note: if these Support lines break downward, we could see further declines in the S&P 500 index and in those correlated markets as well. So it's definitely something to monitor closely.
Please respect each other's ideas and express them politely if you agree or disagree.
S&P 500 Index Analyze (SPX500USD), 1-hour time frame.
Be sure to follow the updated ideas.
Do not forget to put a Stop loss for your positions (For every position you want to open).
Please follow your strategy and updates; this is just my Idea, and I will gladly see your ideas in this post.
Please do not forget the ✅' like '✅ button 🙏😊 & Share it with your friends; thanks, and Trade safe.

SPX500 Long From Support!
HI,Traders !
#SPX500 made a retest
Of the wide horizontal
Support level of 6581.19
And a local rebound is
Already taking place so
We are bullish baised
And we think that a local
Bullish correction is to
Be expected !
Comment and subscribe to help us grow !

SPX500 Local Short!
HI,Traders !
#SPX500 made a nice
Bullish move up and
made a retest of
The horizontal resistance
Level of 6750.77 from where
We are already seeing a bearish
Reaction and so we will be
Expecting a further move down !
Comment and subscribe to help us grow !

SPX500 Bearish Breakout!
HI,Traders !
#SPX500 made a bearish
Breakout of the rising support
Line and we are bearish biased
Therefore, after retesting the sell cluster area
at 6643.11 So we will be expecting a Further
bearish move down !
Comment and subscribe to help us grow !

S&P 500 Index Holds Near Record High Ahead of Fed AnnouncementS&P 500 Index Holds Near Record High Ahead of Fed Announcement
At 21:00 GMT+3 today, the Federal Reserve will announce its interest rate decision, followed by Jerome Powell’s press conference. The rate is widely expected to be cut from 4.25%–4.50% to 4.00%–4.25%.
This will conclude a prolonged intrigue fuelled by President Trump:
→ his constant criticism of Powell for pursuing an “overly tight” policy;
→ the decision to dismiss Federal Reserve Board member Lisa Cook, which markets perceived as direct pressure on the regulator’s independence.
In anticipation of the outcome, traders are showing optimism. The S&P 500 index reached a new all-time high yesterday, climbing above 6,640 points. This morning the price pulled back slightly, which can be interpreted as a short-term correction ahead of a key event. Effectively, the market has already priced in the expected policy easing, viewing it as a catalyst for further growth.
Technical Analysis of the S&P 500 Chart
Six days ago, when analysing the 4-hour chart of the S&P 500 (US SPX 500 mini on FXOpen), we noted that:
→ the price was oscillating within an upward channel (marked in blue);
→ in September, the index has been following a steep bullish trajectory (marked in orange), with its lower line showing signs of support.
Since then, favourable inflation data helped the bulls break above the channel’s upper boundary (highlighted with an arrow).
Possible scenarios:
Bullish perspective:
→ The breakout candle above the blue channel has a long body, signalling strong buying momentum – an imbalance, also known in Smart Money Concept (SMC) as a Fair Value Gap (FVG).
→ The local level of 6,600, once resistance, has now turned into support; the next target could be the psychological level of 6,700.
→ The price is consolidating above the blue channel’s upper boundary, indicating robust demand.
Bearish perspective:
→ The upper boundary of the orange channel may act as resistance.
→ The RSI indicator, although off overbought territory, remains close to it – potentially deterring buyers from entering at elevated prices.
Taking all of this into account, the current balance could easily be disrupted once the Fed announces its rate decision – arguably the most significant event of the month in the economic calendar. Be prepared for spikes in volatility, as sharp moves in either direction are possible.
This article represents the opinion of the Companies operating under the FXOpen brand only. It is not to be construed as an offer, solicitation, or recommendation with respect to products and services provided by the Companies operating under the FXOpen brand, nor is it to be considered financial advice.

SPX500 Bullish Breakout!
HI,Traders !
#SPX500 is trading in a
Strong uptrend and is made a bullish
Breakout of the key
Horizontal level of 6470.89
Which is now a support
And as the breakout is
Confirmed we will be
Expecting a further bullish !
Comment and subscribe to help us grow !

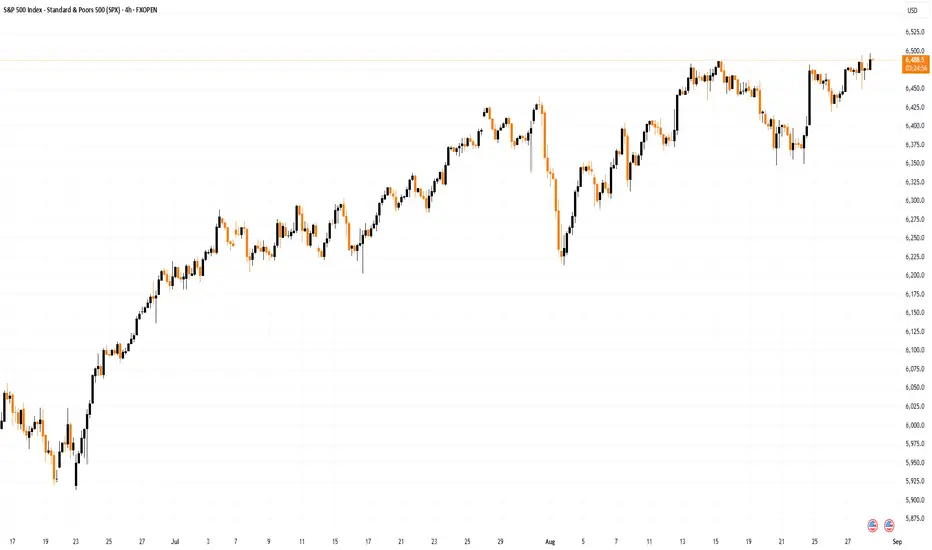
S&P 500 Index Reaches Another All-Time HighS&P 500 Index Reaches Another All-Time High
On 13 August, we wrote about the S&P 500 reaching an all-time high following the release of the CPI report. At that time, we suggested that the price might move towards the upper boundary of the ascending channel (highlighted in blue on the chart).
Since then:
→ the price has set a new record, forming peak 0 near the upper boundary of the channel;
→ it then fell back towards the lower boundary, where block A was formed;
→ and subsequently rose again to a fresh all-time high (F), coming close to the 6500 level.
The resilience of the blue channel underlines the prevailing bullish sentiment, which is supported by expectations of a Fed rate cut in September – an event seen as positive for the economy and potentially boosting corporate earnings. This optimism is so far outweighing the fact that Nvidia’s shares slipped slightly yesterday after the company’s earnings release (despite results exceeding investor expectations).
But is the outlook entirely cloudless?
S&P 500 Chart Technical Analysis
Looking at the 4-hour chart of the S&P 500, there are grounds to make slight adjustments to the slope and width of the ascending channel to better reflect the latest data.
At first glance, the picture appears bullish:
→ long lower shadows around block A point to strong buying interest;
→ downward pullbacks (B→C following impulse A→B, and D→E following impulse C→D) halted near the classic 50% Fibonacci retracement;
→ higher lows in late August give reason to consider the formation of a cup and handle pattern.
However, the bears also have their counterarguments:
→ the 6,500 level could act as psychological resistance (with the risk of a false bullish breakout);
→ the upper boundary of the channel may provide resistance;
→ the marked extremes resemble a bearish rising wedge pattern.
Progress in establishing new highs is becoming weaker each time – it seems that the S&P 500 bull market is running out of steam. This raises concerns about a correction – and with September’s long-standing reputation as the most unfavourable month for markets, a noticeable pullback could happen.
This article represents the opinion of the Companies operating under the FXOpen brand only. It is not to be construed as an offer, solicitation, or recommendation with respect to products and services provided by the Companies operating under the FXOpen brand, nor is it to be considered financial advice.
SPX Weak Bearish Bias → 6440P Caution Trade
# 🏦 SPX Weekly Options Analysis – 8/18
📉 **Market Context**
* Mixed signals across metrics → weak bearish bias
* Price below VWAP → potential short-term downside
* Volume insufficient → low conviction
* Call/Put ratio neutral → no strong directional bias
---
## 🎯 Trade Setup (Cautious Put)
* **Instrument**: SPX
* **Direction**: PUT (SHORT)
* **Strike**: 6440
* **Expiry**: 2025-08-18
* **Entry Price**: \$0.60
* **Profit Target**: \$1.20
* **Stop Loss**: \$0.30
* **Size**: 1 contract
* **Confidence**: 60%
* **Entry Timing**: Market Close
---
## 📈 Breakeven @ Expiry
👉 6439.40 (Strike – Premium)
SPX must **close < 6439.40 by market close** to profit at expiry.
---
## 🧠 Key Risks
* Mixed signals → potential whipsaw ⚡
* Market structure unclear → downside not guaranteed
* Theta decay risk → short-term option, fast time decay
---
# ⚡ SPX 6440P SHORT PLAY ⚡
🎯 In: \$0.60 → Out: \$1.20
🛑 Stop: \$0.30
📅 Exp: 8/18
📈 Bias: Weak Bearish, trade cautiously 🐻
---
📊 **TRADE DETAILS JSON**
```json
{
"instrument": "SPX",
"direction": "put",
"strike": 6440.0,
"expiry": "2025-08-18",
"confidence": 0.60,
"profit_target": 1.20,
"stop_loss": 0.30,
"size": 1,
"entry_price": 0.60,
"entry_timing": "close",
"signal_publish_time": "2025-08-18 15:02:25 UTC-04:00"
}

SPX500 Swing Short!
HI,Traders !
#SPX500 keeps growing
And is locally overbought
So after the price hit a very
Strong resistance level
Around 6422.93 we will be
Expecting a pullback and
A local bearish correction !
Comment and subscribe to help us grow !

SPX500 Will Go UP!
HI,Traders !
#SPX500 made a retest
Of the horizontal support
Level of 6277.78 and we
Are already seeing a
Bullish rebound so we are
Locally bullish biased and
We will be expecting a
Further bullish move up !
Comment and subscribe to help us grow !

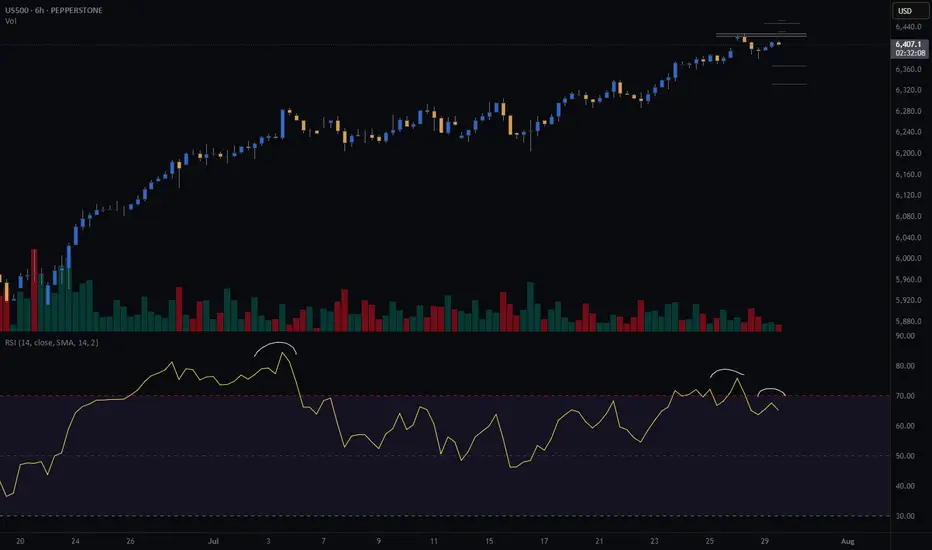
S&P500 (CASH500) SHORT - Double top H6Risk/reward = 3.7
Entry price = 6432.6
Stop loss price = 6 454.1
Take profit level 1 (50%) = 6367.7
Take profit level 2 (50%) = 6332.6
Still need confirmation from some variables before entering the trade
SPX500 Bearish Bias!
HI,Traders !
#SPX500 broke both the
Rising and horizontal
Support line which are
Now resistance areas
And the breakout is
Confirmed so we are
Bearish biased and we
Will be expecting a
Further bearish move down !
Comment and subscribe to help us grow !

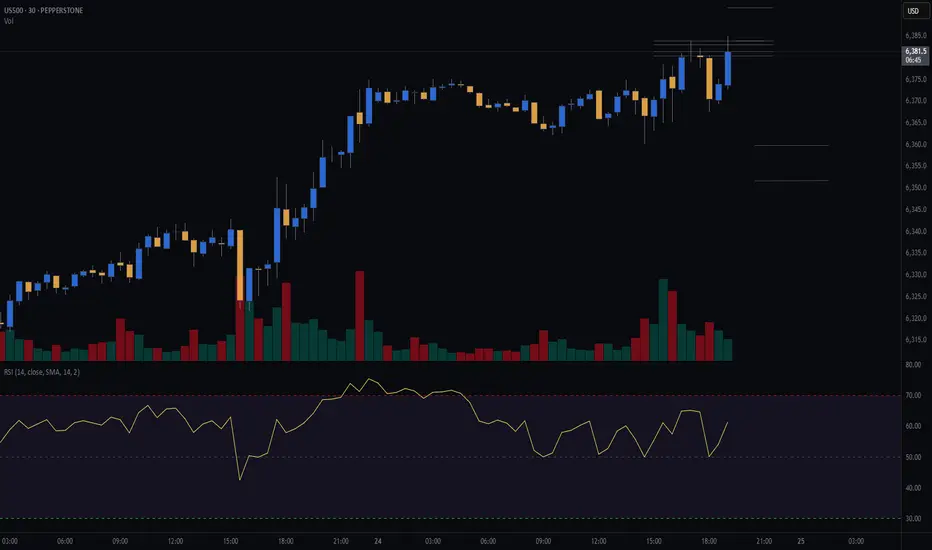
S&P (CASH500) SHORT - Double top 30minRisk/reward = 2.7
Entry price = 6384
Stop loss price = 6393.8
Take profit level 1 (50%) = 6359.8
Take profit level 2 (50%) = 6351.8
Will get confirmation of remaining variables at close of this 30min candle at 19.30.