S&P 500 Breakdown Retest — Bears in Control, Bigger Drop Ahead?Today, I want to share a short setup on the S&P 500( SP:SPX ). Given that the crypto market—especially Bitcoin( BINANCE:BTCUSDT )—has recently regained strong correlation with the S&P, this analysis may be important for the crypto community too.
The S&P 500, over the past 20 days, has shown upward moves with low volume, while downward moves have had stronger momentum and volume. This indicates bears (sellers) have more control. The reasons include Federal Reserve policy shifts and escalating Middle East tensions. Historically, such tensions have led to S&P declines.
From a technical perspective, on the 4-hour timeframe, the S&P 500 has broken its support zone($6,956-$6,925) and is pulling back to it.
From an Elliott Wave perspective, it seems the S&P 500 is completing its main wave 4, which likely has a Double Three Correction(WXY) structure.
I expect the S&P 500 to decline toward the support lines. If broken, we could see the index drop further to at least $6,853.
Note: If Middle East tensions escalate further, as news suggests, the index could drop suddenly. Conversely, any agreement (e.g., between Iran and the U.S.) could support a recovery. Stay tuned to the news flow.
Note: A decline in the S&P 500 to at least 6,850 could also lead to the loss of Bitcoin’s heavy support zone($78,260-$70,080).
First Target: Support lines
Second Target: $6,853
Stop Loss(SL): $6,979(Worst)
Points may shift as the market evolves
Can gold resume its bullish trend, or should we expect deeper corrections?
💡 Please respect each other's opinions and express agreement or disagreement politely.
📌 S&P 500 Index Analyze (SPX500USD), 4-hour time frame.
🛑 Always set a Stop Loss(SL) for every position you open.
✅ This is just my idea; I’d love to see your thoughts too!
🔥 If you find it helpful, please BOOST this post and share it with your friends.
Spx500short

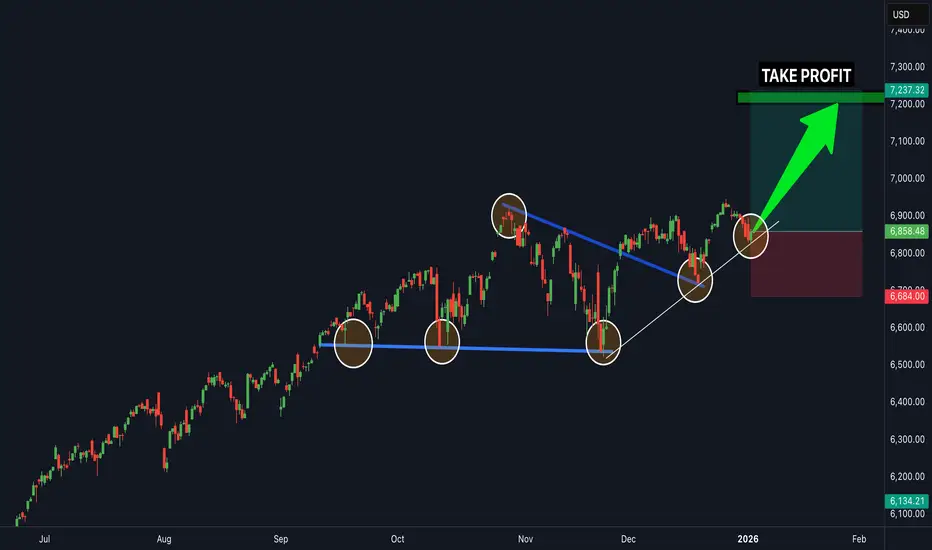
SPX.. buy nowSPX 500 is in a clear upwards channel and has broken the last bit of resistance (white trendline line shown) - this is a clear confirmation that the next target will be the next resistance zone to the upside shown above (this is a great buy trade opportunity) - buy SPX 500 now...
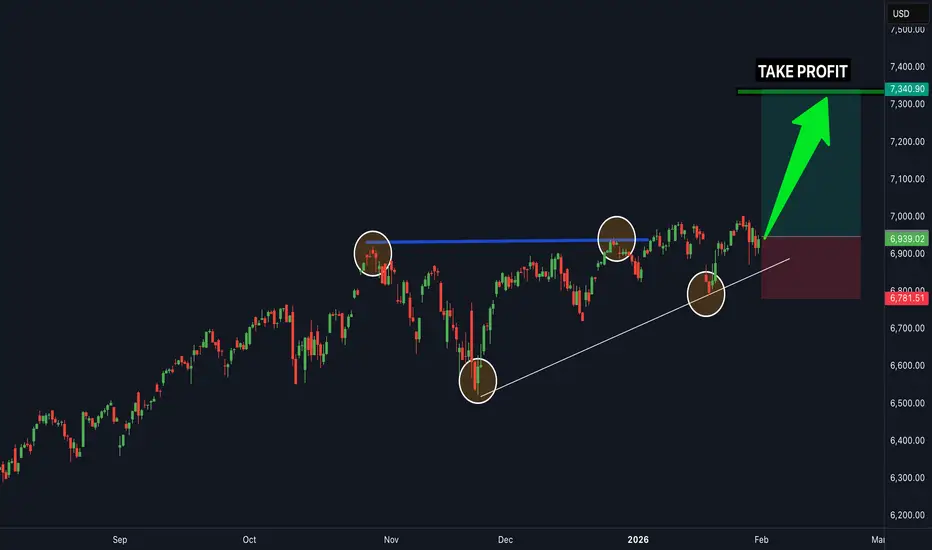
SPX.. time to buy nowSPX 500 is in a clear upwards channel and has broken the last bit of resistance (white trendline line shown) - this is a clear confirmation that the next target will be the next resistance zone to the upside shown above (this is a great buy trade opportunity) - time to buy SPX 500 now...
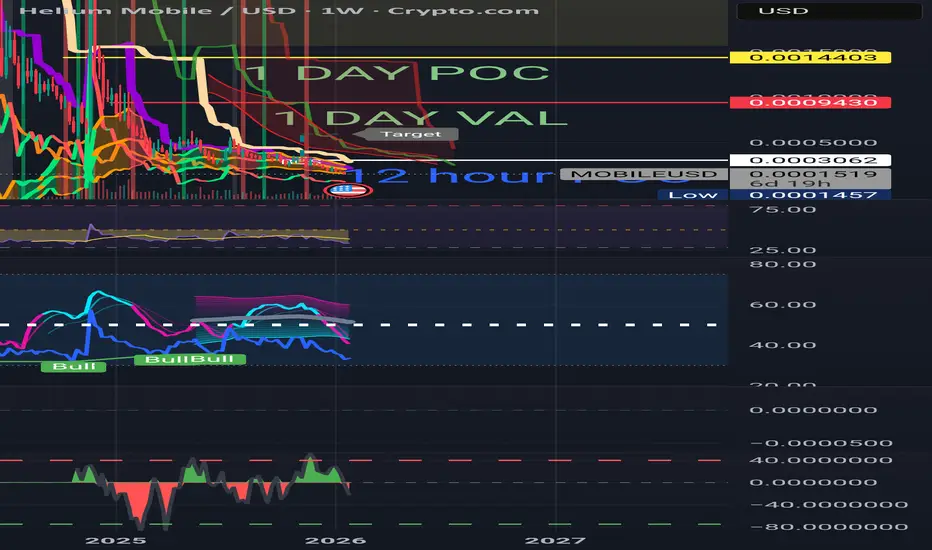
Mobile is ready againBad news & then no news for a while.....
Volume profiles on multiple time frames show some fire is coming IMO...
I lean towards the "revolution of crypto"... Look for 10 cents???
O yeah, they also did a delist and made many panic sell before & after that. Reminds me of buying a F ton of XRP below. I made money of the pump before the coinbase delisting also.
Something has me seeing massive potential beyond most our expectations or it's just another shit coin.
Good luck & REMEMBER NOTHIMGNG I SAY IS FINANCIAL ADVICE
Long SHTrading Fam,
Gonna put my money where my mouth is here. Expecting an imminent pullback in the stock market. I'll use the ProShares Short ETF for this trade. We'll do a 1:2 rrr for this trade. Shooting for that orange 350-day SMA (currently at around $39) and I'll set my SL at $34.
✌️Stew

SPX500 Bearish Breakout!
HI,Traders !
#SPX00 made a bearish
Breakout and the breakout
Is confirmed so we are
Bearish biased and we
Will be expecting a further
Bearish move down !
Comment and subscribe to help us grow !

S&P 500 | SPX | When should fear really exist for the investor?In recognition of surpassing 500 followers, I thought I would take a moment to write about when I plan to fully exit equities, stockpile cash, and continue to acquire into 20-year treasury bonds (which I have started with TLT ). This post is not encouraging others to do as I do. Instead, it's an attempt to answer a common question I am asked: "When do you think this rally will be over?"
The answer is: "I do not know. But, using technical analysis, I can estimate a personal 'fear' indicator."
My 'Fear' Indicator
I use technical analysis to make informed decisions about entries and exits. It reduces emotional trading, chasing, and FOMO. My technical analysis does not conform to the "standard" 50-, 100-, 200-simple moving averages (SMA). In fact, back testing these standard SMAs show they are (arguably) traps for retail traders. The system wants your money, so why on earth would they share their secrets with such basic numbers as 50, 100, etc.?
Instead, the "devil" is in the details. What I will call my "historical SMA". That's as much as I will share because... well... I want your money too ;)
I view my historical SMA as primary support. It's the white line on the chart. Around that area is a range of values that the price can bounce around in (or slightly out) without causing panic or fear that support has been lost. From the historical SMA, other bands can be extended out to estimate additional support or resistance. If you follow me, you've seen I often trade using a "crash" and "major crash" SMA. These zones often indicate bottom areas for price reversal (i.e. algorithmic trading kicks in and pre-programmed computers quickly accumulate shares). Personally, it's a great indicator by taking out guesswork and letting time work for you instead of against you. It's not perfect, but the odds of success have been extremely high.
So, what's the opposite of my crash or major crash SMA? The "fear" SMA. I call it that because it's when people should ***really*** be fearful of their market exposure (unlike the crash and major crash SMAs which are opportunities). It's currently on the chart as purple lines near 7,600 and 7,800 (and rising). This band is where I am moving out of equities completely and going cash and NASDAQ:TLT . The throttle is maxed and headed for a wall, as they say. Does that mean once price hits that zone the market has topped and it's only down from there? Absolutely not. It may ride that level or jump higher for a few months, year, etc. But it's a fool's game at that point. Time will not be on investor's side. FOMO will be real for those who exit, but this is why technical analysis is important. It uses data for informed decision-making. Not emotions. Profits made from reaching the purple bar will be great. More is just glutinous.
Important Note
Obviously, the conditions above are predicated on no major wars, pandemics, global catastrophes, etc. I view any further dips in the market, not due to said conditions, as opportunities. But, as always, stay cautious, trade using your own strategies, and protect yourself and your money at all times.

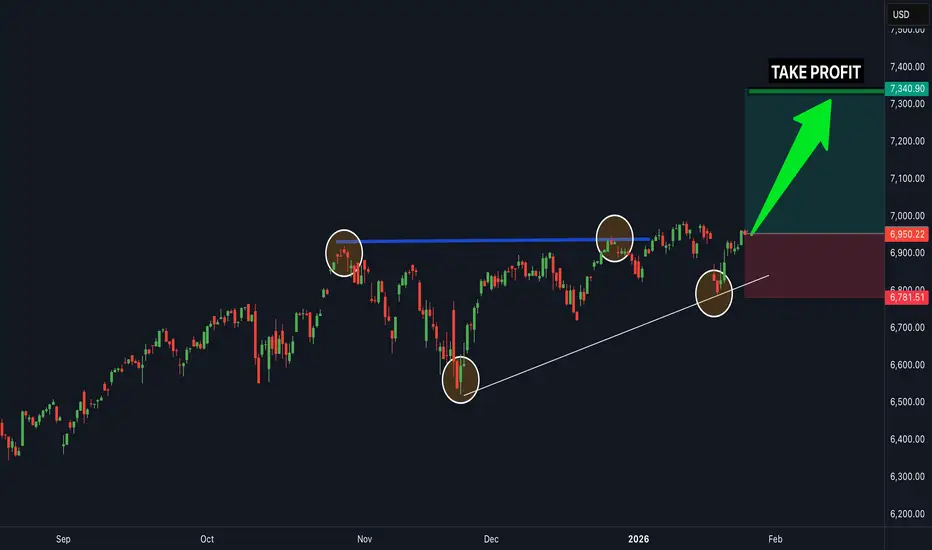
SPX.. time to buy nowSPX 500 is in a clear upwards channel and has broken the last bit of resistance (white trendline line shown) - this is a clear confirmation that the next target will be the next resistance zone to the upside shown above (this is a great buy trade opportunity) - buy the SPX 500 now...
SPX.. buy now SPX 500 is in a clear upwards channel and has broken the last bit of resistance (white trendline line shown) - this is a clear confirmation that the next target will be the next resistance zone to the upside shown above (this is a great buy trade opportunity) - buy SPX 500 now...
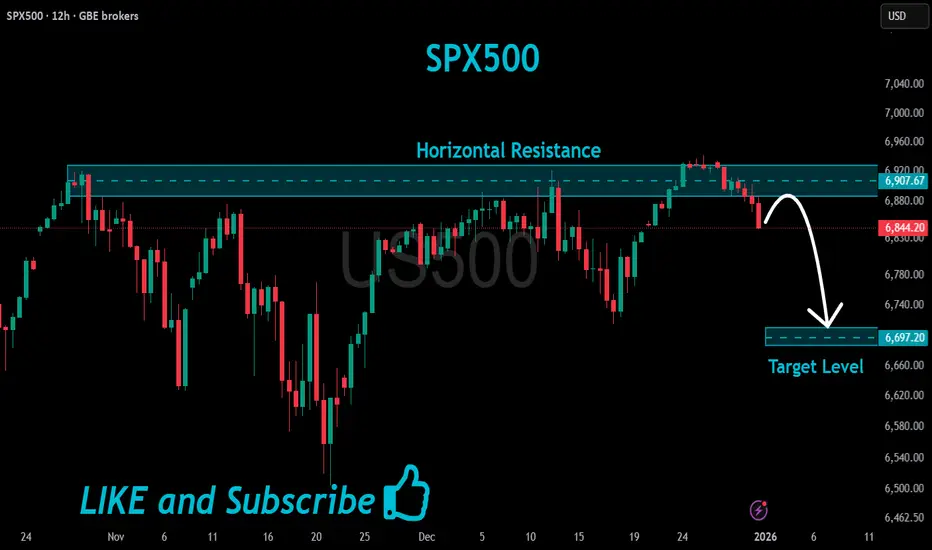
US500 Will Go Down!
HI,Traders !
#US500 has made a retest
Of the horizontal resistance
Of 6907.67 and we are already
Seeing a bearish reaction so
We are bearish biased and
Therefore a local bearish
Pullback is to be expected !
Comment and subscribe to help us grow !
SPX.. buy now it's going upSPX 500 is in a clear upwards channel and has broken the last bit of resistance (white trendline line shown) - this is a clear confirmation that the next target will be the next resistance zone to the upside shown above (this is a great buy trade opportunity) - buy the SPX 500 now... it's going up

Staying Sober over the Santa Claus RallyCME: E-Mini S&P 500 Options ( CME_MINI:ES1! )
Stock investors have a unique way of celebrating the holiday season. The “Santa Claus Rally” refers to the market typically trending up between the last five days of the year and the first two of the new year — in this case from Dec. 24, 2025, until Jan. 5, 2026.
The year-end stock market surge has indeed arrived. Major U.S. indexes climbed for a fifth straight session on Wednesday. The S&P 500 closed up 0.3% and posted a fresh record of 6,932.05, and the Nasdaq Composite gained 0.2%, settling at 23,613.31. The Dow Jones Industrial Average gained 288.75 points, or 0.60%, and also posted a closing record of 48,731.16.
On Tuesday, the Commerce Department announced the third-quarter U.S. GDP at 4.3%, surpassing the market consensus of 3.2%. After the GDP report, fed funds futures trading indicates two Fed rate cuts in 2026, according to the CME FedWatch Tool.
Behind the scenes, “Smart Money” has quietly turned bearish on the stock market. CFTC’s Commitments of Traders (COT) report shows that, as of December 16th, CME E-Minis S&P 500 futures have total open interest (OI) of 2,466,313 contracts.
• “Leveraged Funds” hold 218,923 Long positions, 608,090 Short positions and 149,554 in spread positions.
• The long/short ratio of 1-to-2.8 shows that “Smart Money” manager to stay sober while retail investors are drinking cocktail.
Apollo Switches Off the Risk Button
On Tuesday, Apollo Global Management, a giant alternative asset manager with nearly $1 trillion in assets under management, announced a strategic shift toward capital preservation, liquidity buildup, and risk reduction. Apollo cites economic uncertainty, inflation, geopolitical risk, and lofty valuations as driving forces behind its actions.
In my opinion, Apollo’s repositioning signals not just a tactical change at one firm, but a broader inflection point in investment strategy among institutional investors.
This also illustrates the importance of the COT report as a leading indicator. You could spot big moves by the institutional investors weeks before they make them public.
Protecting Stock Portfolio with E-Mini S&P Options
Traders with a broad-based stock portfolio could explore using CME E-Mini S&P 500 Options ( NYSE:ES ) to hedge the market downturn risk.
The ES futures contract has a notional value of $50 times the S&P 500 index. On December 23rd, the March 2026 contract (ESH6) was quoted at 6,954. Each contract has a notional value of $347,700.
To hedge the risk of index drawdown greater than 3%, traders could buy Put Options on ESH6 with a strike price of 6,750. On Wednesday, this Put is quoted at 112.50. To buy 1 Put, the trader is required to pay an upfront premium of $5,625 (= 112.50 x 50).
For a $1 million broad-based stock portfolio, what happens if the S&P 500 loses 10%?
• With no protection, the portfolio will lose approximately 10%, or -$100,000.
• Alternatively, traders could buy 3 Put Options, with notional value of the underlying futures contracts approximating the $1 million stock portfolio.
• Now that the ES futures dropped by 10% from 6954, to 6260. With options in place, the Put will gain $73,500 (= (6750-6260) x 50 x 3). Netting out the premium cost of $16,875 (= 5625 x 3), the portfolio loss will be cut by more than half, from -$100,000 to just -$43,375, or from -10% to -4.3%.
Option premium consists of intrinsic value and time value. The cost of the American option premium reflects the time value of a long protection period of three months. To lower the premium, traders could consider using shorter-dated options.
• The End-of-the-Month Options expiring January 2026 are quoted at 47.75 for the 6750-strike. This is 50% cheaper than the March expiration options ($112.50).
• The Weekly Options expiring Friday, January 2, 2026, are quoted at just $19.
Happy Trading.
Disclaimers
*Trade ideas cited above are for illustration only, as an integral part of a case study to demonstrate the fundamental concepts in risk management under the market scenarios being discussed. They shall not be construed as investment recommendations or advice. Nor are they used to promote any specific products, or services.
CME Real-time Market Data help identify trading set-ups and express my market views. If you have futures in your trading portfolio, you can check out on CME Group data plans available that suit your trading needs www.tradingview.com

SPX.. buy nowSPX 500 is in a clear upwards channel and has broken the last bit of resistance (white trendline line shown) - this is a clear confirmation that the next target will be the next resistance zone to the upside shown above (this is a great buy trade opportunity) - buy the SPX 500 now
S&P 500 "tech wreck": Double top breakdown targets 6,500?The S&P 500 has sliced through its 50-day moving average and paused by 50% Fibonacci retracement following a fourth straight day of losses. With a confirmed double top at 6,930 and momentum shifting bearish, we’re eyeing a move back to the range lows at 6,500.
In this video, we break down the impact of the "tech wreck" and Fed Governor Waller’s mixed signals on 2026 rate cuts, which have triggered a risk-off sentiment. Then, we outline a short setup selling the bounce into 6,765–6,800, targeting the November 21 lows.
Key drivers
Technical Breakdown : The index has broken below its 50-day moving average and the 50% Fibonacci retracement (6,725), confirming bearish momentum from a double top structure.
"Tech Wreck" & Macro : High-value tech stocks and crypto sold off sharply yesterday, exacerbated by Fed Governor Waller’s caution on "hurrying up" rate cuts despite inflation risks.
Range Structure : The S&P 500 is trading within a rectangular range between ~6,930 (highs) and 6,500–6,520 (lows). We are currently in the middle of this range with a downside bias.
Short Setup : We are looking to sell a retracement to the 38.2% Fib / prior low (~6,765–6,800) rather than chasing the breakdown due to the 4-hour RSI shift.
Trade Plan : Entry around 6,765, stop loss above 6,830 (23.6% Fib), targets at 6,600 and ultimately 6,500. Risk/reward is favourable at 1.7+.
Are you selling the tech sell-off or waiting for support? Share your levels in the comments and follow for more technical swing setups.
This content is not directed to residents of the EU or UK. Any opinions, news, research, analyses, prices or other information contained on this website is provided as general market commentary and does not constitute investment advice. ThinkMarkets will not accept liability for any loss or damage including, without limitation, to any loss of profit which may arise directly or indirectly from use of or reliance on such information.

S&P 500 Breakdown Alert — Rising Wedge Reversal in Play!Today I want to share an S&P 500 index( SP:SPX ) analysis, as this index plays a major role in guiding correlated markets—especially crypto, and particularly Bitcoin( BINANCE:BTCUSDT ).
The S&P 500 index entered the Potential Reversal Zone(PRZ) and resistance zone($6,902_$6,875), where it began to fall.
The S&P 500 index also failed to form new Higher Highs(HH) and Higher Lows(HL), which signals weakening bullish momentum over the past 7 trading sessions.
From a classical technical-analysis perspective, it appears that the S&P 500 index has broken below the lower line of its rising wedge pattern, which is considered a bearish reversal pattern. The index is currently in the process of completing a pullback/retest of the broken structure.
My expectation is that the S&P 500 index may decline at least toward $6,823, and if important support lines break, we could see a deeper correction toward the measured move (target) of the rising-wedge pattern.
What’s your outlook on the S&P 500 index and the U.S. stock market?
First Target: $6,823
Second Target: $6,803
Stop Los(SL): $6,889(Worst)
------------------------------------------------
We should also keep in mind that several important US economic indicators will be released this week, which could significantly impact market direction. So be extra cautious with your positions, especially during data releases:
JOLTS Job Openings➡️09 December
Federal Funds Rate➡️10 December
FOMC Statement➡️10 December
FOMC Press Conference➡️10 December
Unemployment Claims➡️11 December
------------------------------------------------
💡 Please respect each other's opinions and express agreement or disagreement politely.
📌S&P 500 Index Analyze (SPX500USD), 1-hour time frame.
🛑 Always set a Stop Loss(SL) for every position you open.
✅ This is just my idea; I’d love to see your thoughts too!
🔥 If you find it helpful, please BOOST this post and share it with your friends.

SPX - H4 - SELL SETUP - Supply Retest confirmedSPX has entered bear market territory last month and I expect a continuation to the downtrend from here onward. Based on many different macro indicators such as credit default swaps on big tech, macro regimes, sentiment and technical analysis. I see SPX falling off the clip from this precise supply zone

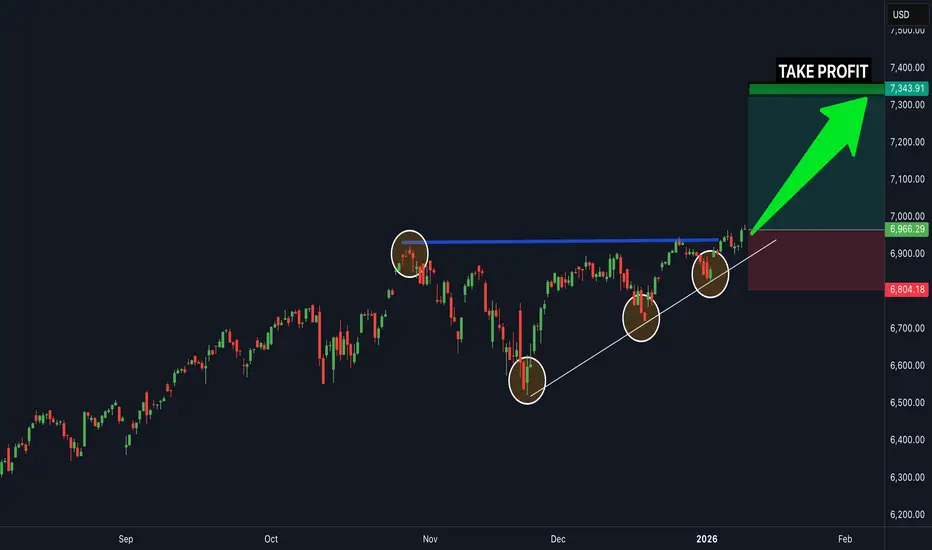
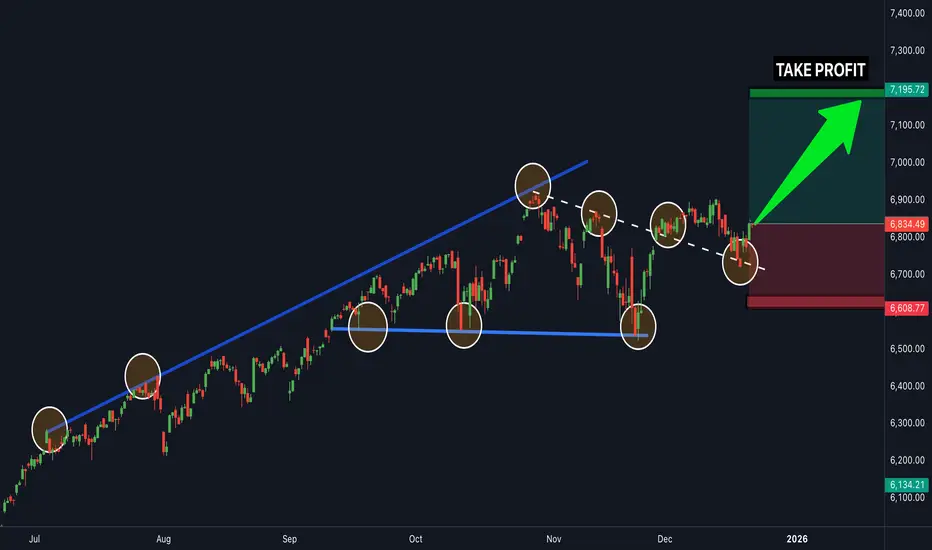
BUY SPX NOW...time to buySPX500 is in a clear upwards channel and has broken the last bit of resistance (white trendline line shown) - this is a clear confirmation that the next target will be the next resistance zone to the upside shown above (this is a great buy trade opportunity) - Time to buy!
SPX Idea 23.11.2025I also have several scenarios for SPX, unfortunately for this one, it's not possible otherwise. I would consider a potential short first when the SFP is above the weight at the price level of 6883 and then above the new ATH. I would open a long position at the level around Vwap 6453, where the daily level is also nearby, and then at the level of 6200, where the Vwap and weekly levels are located for context, and then a little lower, the Fibo level of 0.382.

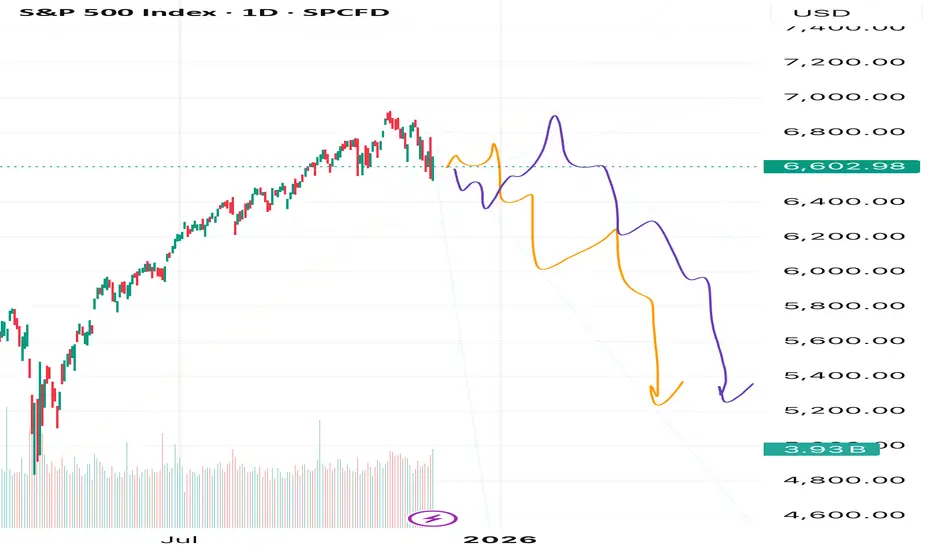
A Historic Shift in the S&P 500 Is BeginningFriends, in my view, the unstoppable rally in the S&P 500 has finally come to an end. The market has completed a massive five-wave structure with an extended fifth wave — and now we’re witnessing a historic moment as an exceptionally large correction begins.
As always, I’m watching two possible scenarios: the orange path and the purple path. But despite their differences, both point to the same outcome — my target at 5200. And that’s only the first target out of several.
Make sure to follow and subscribe, so you don’t miss the upcoming updates and deeper breakdowns.
This is just my personal market outlook — not financial advice. More updates coming soon.
SPX500 Will Go Down!
HI,Traders !
#SPX500 made a retest
Of the horizontal resistance
Level of 6678.85 from where
We are already seeing a
Bearish reaction so we are
Locally bearish biased and
We will be expecting a
Further local move down !
Comment and subscribe to help us grow !

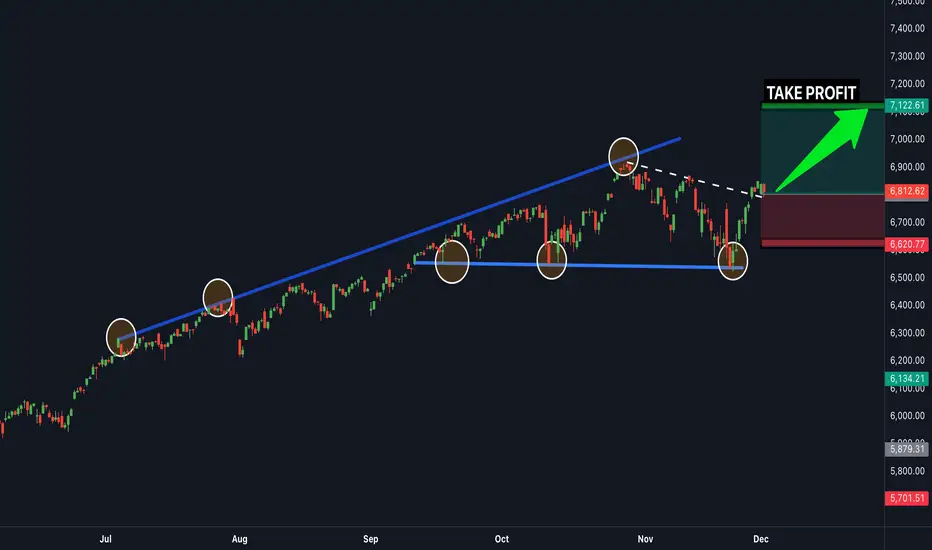
SPX500 TIME TO BUY NOWSPX500 is in a clear upwards channel and has broken the last bit of resistance (white line shown) - this is a clear confirmation that the next target will be the next resistance zone to the upside shown above (this is a great buy trade opportunity) - Time to buy!

SPX | Daily Analysis #12 - 10 November 2025Hello and Welcome Back to DP,
Review and News:
Last week was quite eventful. The index plunged toward the 6,640 area before a sharp rebound—helped in part by a series of market-friendly statements and tweets from former President Trump, which appeared to lift sentiment. Despite trading down more than 1.3% intraday, the market recovered impressively and ultimately closed the session in the green.
This week, investors will be watching closely to see whether Trump continues to influence sentiment with further comments or appearances that could help fuel market volatility and optimism. The shutdown remains at the center of U.S. politics. The Senate has advanced a temporary funding bill extending federal funding through January and reversing some layoffs, but final approval by the House and the President’s signature is still pending. Until a resolution is reached, uncertainty will linger across markets and public services.
The October Consumer Price Index (CPI) report—typically one of the most closely watched inflation indicators—is likely to be delayed due to the ongoing federal government shutdown. The lack of fresh data is creating a “data fog” for policymakers and traders alike.
Technical Analysis:
🟩 Demand Zones (Support Areas)
6,735 – 6,748 region
Multiple touches and strong buying reaction.
Large bullish candles emerged after price retested this area → indicates strong institutional demand.
It’s the nearest demand and acts as immediate support.
If broken, next possible downside continuation zone would be near 6,700 – 6,710.
Lower demand extension (6,730 – 6,740)
Good confluence with volume spike at lows → buyers defended this region before a sharp move up.
🟥 Supply Zones (Resistance Areas)
6,813 – 6,834 region
Clear previous consolidation before a breakdown.
This area now acts as a major supply / resistance zone.
Expect sellers to step in if price retests this zone — first test may trigger rejection.
It’s aligned with a local structure high; several long upper wicks in the past confirm supply pressure.
Above 6,834 → potential next supply
Around 6,850 – 6,860 (top of previous distribution).
Disclaimer:
This content is for informational purposes only and does not constitute financial or investment advice. © DIBAPRISM
Amir D.Kohn

Bull Run Stumbles: S&P 500 Heads Toward a Potential Correction After a rough day on Wall Street, the S&P 500 dropped about 1.2%, pulling U.S. markets lower. But there’s more behind this fall than just profit-taking.
What’s Really Happening?
Warning Signs from Wall Street
Two top banking leaders raised caution. Morgan Stanley’s Ted Pick expects a 10–15% correction, calling it a “healthy normalization.”
Goldman Sachs’ David Solomon warned that tech stocks are showing bubble-like behavior, with prices running much faster than earnings.
AI Boom Driving Market Concentration
The AI craze and tech optimism have made a few mega-cap companies dominate the market. In fact, just 10 big tech firms now make up nearly 40% of the S&P 500’s total value, making the market more fragile.
Fed Confusion Adds to Uncertainty
The Federal Reserve is sending mixed signals — some officials talk about possible rate cuts by December, while others say rates should stay high because the economy is still strong.
Adding to the mess, a partial U.S. government shutdown has delayed key data, leaving investors and the Fed guessing about what’s really happening in the economy.
What the Chart Reveals
From a technical standpoint, the U.S. market’s rally has been nothing short of extraordinary. Since the April bottom near 4,835, the index has soared nearly 42%, touching a recent peak around 6,920 — and even gained about 12–13% before the latest (April 2025) pullback began.
But now, the momentum seems to be fading. The chart is flashing early warning signals — RSI divergence suggests that while prices made new highs, the underlying strength (momentum) did not. That often hints at a potential trend reversal.
If this weakness deepens, the index could correct swiftly by around 10%, targeting the 6,200–6,100 zone. And if the “healthy normalization” predicted by Morgan Stanley’s Ted Pick (a 15% drop) plays out, the index might slide further to around 5,700 — a level that would reset valuations to more reasonable territory after the sharp run-up.
Valuation Check
Let’s set aside all the opinions and headlines for a moment and focus on the key valuation metrics that truly help us understand the real picture of the U.S. market.
The Price-to-Earnings (P/E) Ratio — The Market’s Mood Meter
P/E Ratio = Current Market Price/Earnings Per Share (EPS)
So, Current Market Price = P/E Ratio*EPS
Currently, the S&P 500’s P/E ratio stands at 30.8x, with an EPS of $222.5.
When you multiply the two — 30.8 × 222.5 = roughly $6,800 — it perfectly aligns with the index’s recent market level.
Now, to find out what the fair value of the market should be, let’s use the 5-year median P/E ratio, which is around 25.4x.
Fair Market Price = 25.4*222.5 = 6,650.
This aligns perfectly with the technical chart levels, suggesting that a 15% correction would be a healthy pullback to help cool down the overheated U.S. market.
The Buffett Indicator — Market Cap vs. GDP
One of Warren Buffett’s favorite valuation tools compares the total U.S. stock market capitalization to the country’s GDP — essentially measuring how large the market has grown relative to the real economy.
At present, this ratio stands at around 224%, far above the long-term fair value range of 100–120%. Even when compared to its 5-year median level of 192%, the market still appears significantly overvalued.
To return to its median level, the ratio would need to drop by roughly:
100 = 16.6%
That’s roughly a 15–16% correction, which again perfectly aligns with both the technical chart signals and Ted Pick’s projection of a healthy market normalization.
The Bottom Line
The U.S. market’s extraordinary rally has been built on a mix of AI optimism, liquidity hopes, and investor euphoria, but the fundamentals are starting to whisper caution.
Both valuation metrics and technical signals point to the same conclusion — the market is stretched, and a 10–15% correction wouldn’t be a disaster; it would be a return to balance.
History shows that every overheated bull run needs a pause — not to end the story, but to give it a stronger foundation.
So if the coming months bring some red on the screen, smart investors will see it not as fear, but as the market taking a deep breath before its next big move.
