US500 Structure Turns Positive as Demand Builds📈 Bullish US500 / SPX500 Swing Trade Opportunity | Thief Layer Strategy 🛡️💰
🔥 Asset: US500 / SPX500 Index
📅 Trade Style: Swing Trade
📊 Market Bias: Bullish Momentum
💡 Trade Plan – Thief Layer Entry Strategy
We’re playing a multi-layered bullish entry using Thief’s layering method 👇
🔹 Limit Layers:
• Buy Limit @ 6820
• Buy Limit @ 6840
• Buy Limit @ 6860
• Buy Limit @ 6880
(Add more layers based on personal risk tolerance & preference)
Layer Method: Using multiple limit orders helps accumulate positions on weakness and improve average entry for swing upside.
🛑 Stop Loss – Thief OG Rule
🔒 SL: 6800 (Thief SL)
➡️ Adjust SL based on your own risk level and strategy. Manage risk yourself — only use my SL as reference, not guidance.
⚠️ I am not recommending you ONLY use my SL/TP — trade at your own risk & adjust as needed.
🏁 Target Zone
🎯 Primary Target: 6980
📌 This zone aligns with strong resistance, potential overbought reaction & trap level — cautious profit-taking area.
🔗 Related Markets to WATCH
Here are correlated markets that often move with SPX500:
✔️ US Dollar Index (DXY) – correlation influences risk sentiment and equities. A stronger USD often supports equity strength, though relationship varies over time.
✔️ NASDAQ / US Tech Index – tech is a big driver for US500 performance due to sector weight.
✔️ Crude Oil (WTI / Brent) – recent patterns showed equities trending in tandem with oil, reflecting risk appetite.
✔️ EUR/USD & GBP/USD — sentiment indicators that often swing with risk on/off market mood.
🧠 Fundamentals & Macro Drivers
📌 Economic Outlook: U.S. growth expected without recession in 2026, aiding risk assets.
📌 Fed Policy: Recent rate cuts and expectation of additional easing support equity valuations.
📌 Earnings Growth: Most major sectors projected with higher expected growth for 2026.
📌 AI + Tech Tailwinds: Continued AI investment remains a key bullish driver for US equities.
📅 Watch Upcoming News Events:
• U.S. Nonfarm Payrolls
• Fed Rate Decisions / FOMC Minutes
• CPI & Inflation data
• PMI & Retail Sales
📌 Why This Setup
✅ Multi-layer entries improve execution quality
✅ Bullish macro backdrop + earnings support
✅ Clear risk zone + target
✅ Correlation watchlist for context
💬 Trade smart, manage risk, and always confirm with your own analysis.
If this idea helped, *like 👍, comment 💬, and follow 📌 for more Thief strategy setups!
US SPX 500

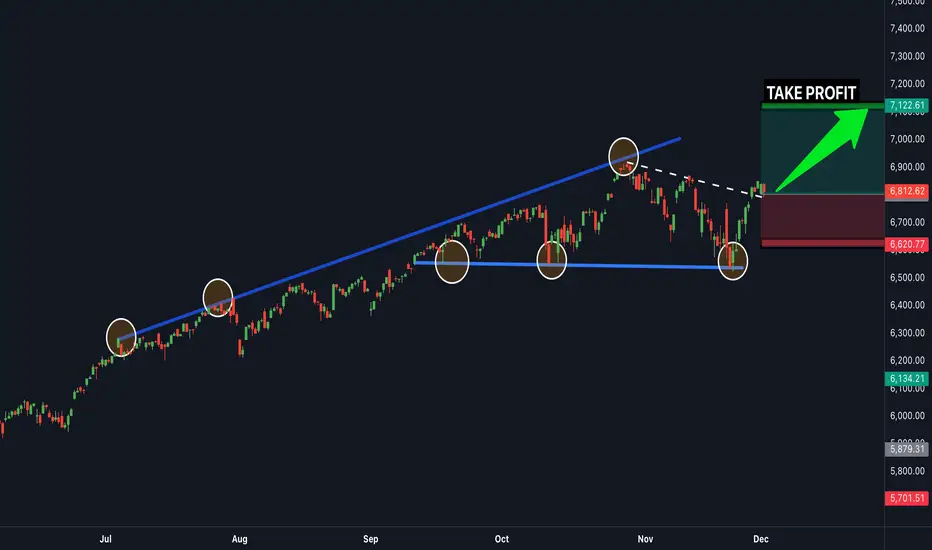
SPX.. buy now SPX 500 is in a clear upwards channel and has broken the last bit of resistance (white trendline line shown) - this is a clear confirmation that the next target will be the next resistance zone to the upside shown above (this is a great buy trade opportunity) - buy SPX 500 now...
S&P 500 Hits ATH — Fake Breakout & Start of a Major Correction?The S&P 500 Index ( OANDA:SPX500USD ), as I previously expected , has begun to rise and even reached a New All-Time High($6,823).
It appears that the S&P 500 Index has lost its uptrend line and is currently moving just above the resistance zone($6,930_$6,892). The key point here is that this break above the resistance zone($6,930_$6,892) hasn’t occurred with high volume, and there’s also a noticeable Regular Divergence (RD-).
From an Elliott Wave perspective, it seems that the S&P 500 Index has completed main wave 5 at the new All-Time High(ATH), indicating a potential fake breakout above the resistance level.
I expect that the S&P 500 Index may begin to decline and could drop at least to around $6,879, with the next target potentially filling a Runaway Gap($6,857.80_$6,850.80).
What are your thoughts on the S&P 500 Index? How do you see the U.S. stock market unfolding in 2026? I’d love to hear your opinion!
First Target: $6,879
Second Target: Runaway Gap($6,857.80_$6,850.80)
Stop Loss(SL): $6,952
Note: A decline in the S&P 500 index could also affect Bitcoin( BINANCE:BTCUSDT )(due to Bitcoin's correlation with the S&P 500 index).
💡 Please respect each other's opinions and express agreement or disagreement politely.
📌S&P 500 Index Analyze (SPX500USD), 1-hour time frame.
🛑 Always set a Stop Loss(SL) for every position you open.
✅ This is just my idea; I’d love to see your thoughts too!
🔥 If you find it helpful, please BOOST this post and share it with your friends.

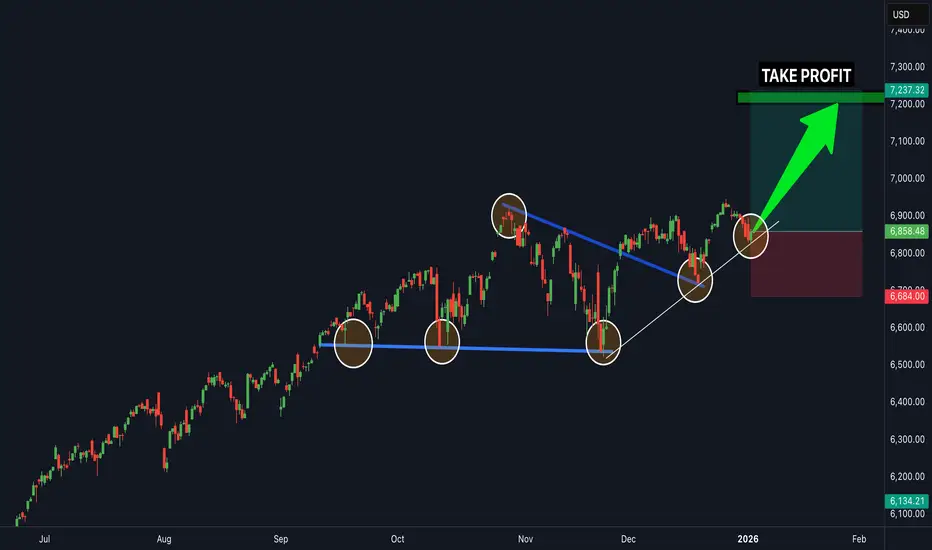
SPX.. buy now it's going upSPX 500 is in a clear upwards channel and has broken the last bit of resistance (white trendline line shown) - this is a clear confirmation that the next target will be the next resistance zone to the upside shown above (this is a great buy trade opportunity) - buy the SPX 500 now... it's going up

S&P 500 Index Approaches the 7,000-Point LevelOver the past five trading sessions, the U.S. equity index S&P 500 (SPX) has maintained a consistent bullish bias, posting gains of more than 2% in the short term and moving closer to the psychological 7,000-point level. For now, the index has managed to sustain firm buying pressure, supported by optimism around potential interest rate cuts in 2026 by the Federal Reserve. This scenario could foster a lower cost of borrowing, helping market liquidity remain stable while supporting investment and consumption—key pillars for equity market confidence. If this perception holds, it could continue to act as a positive catalyst allowing the SPX to maintain sustained buying pressure toward the close of 2025. As long as confidence remains in place, buying pressure may continue to shape short-term price action.
The Bullish Trend Holds
For several months now, the SPX has sustained a consistent bullish trend across its average price movements, keeping the index very close to the 7,000-point area. At this stage, no meaningful bearish corrections have emerged that would threaten the bullish technical structure, which remains the dominant formation to monitor. However, it is important to note that as prices have reached new highs in recent sessions, a sense of neutrality has begun to appear in price action. If this indecision persists, it could open the door to short-term bearish corrections.
RSI
At present, the RSI remains above the neutral 50 level, suggesting that average momentum over the past 14 sessions continues to favor buyers. However, a notable technical development has emerged: while the SPX price posts higher highs, the RSI shows lower highs, forming a bearish divergence. This pattern may signal a recent excess in buying pressure, increasing the likelihood of selling corrections in the coming trading sessions.
MACD
The MACD continues to display a histogram oscillating very close to the neutral zero line, reflecting persistent neutrality in short-term moving average momentum. If this behavior continues, it may point to an ongoing indecision phase in SPX price action, potentially allowing for a period of consolidation and the emergence of short-term pullbacks.
Key Levels to Watch
7,000 points – Key resistance: A major psychological level that stands out as the most relevant resistance given the lack of prior price references. Sustained moves above this area could trigger a more aggressive bullish bias and extend the current uptrend.
6,900 points – Nearby support: A level associated with the neutrality observed around recent all-time highs. Price action holding near this zone could reinforce a more stable consolidation phase and favor the formation of a short-term sideways range.
6,800 points – Major support: An area where the bullish trendline aligns with the 50-period simple moving average. Bearish moves below this level could put the broader bullish structure at risk and open the door to a more dominant selling bias in the sessions ahead.
Written by Julian Pineda, CFA, CMT – Market Analyst

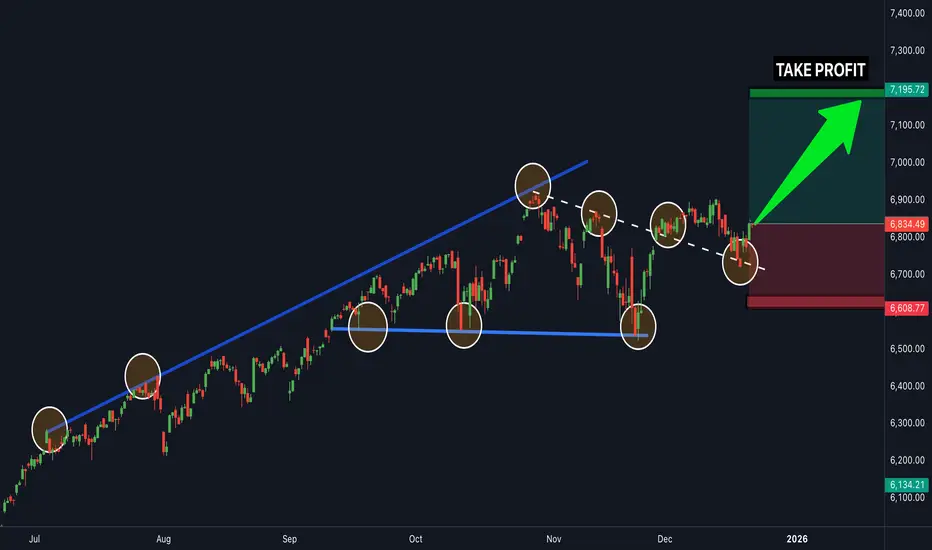
SPX.. buy nowSPX 500 is in a clear upwards channel and has broken the last bit of resistance (white trendline line shown) - this is a clear confirmation that the next target will be the next resistance zone to the upside shown above (this is a great buy trade opportunity) - buy the SPX 500 now
S&P 500 (H4) – A Breathing Pullback Within an UptrendHello everyone, Domic here.
Looking at the S&P 500 on the H4 timeframe, the dominant feeling right now is not a trend breakdown, but rather a market slowing down to catch its breath after a fairly solid advance.
The medium-term trend still leans bullish, as the EMA89 continues to slope upward and price remains within its zone of influence. Losing the EMA34 only signals that short-term buying momentum has weakened, with EMA34 now acting as dynamic resistance — a classic feature of a corrective phase within an uptrend.
The key level to watch is the EMA89. Price is currently rotating back to test this area with moderately sized bearish candles, without any aggressive breakdown. Volume also does not suggest strong distribution or panic selling. This behavior is typical of a technical pullback, not the start of a trend reversal.
The most fitting scenario at this stage is for the S&P 500 to continue moving sideways and consolidating around the EMA89, roughly within the 6,740–6,780 zone, allowing the remaining selling pressure to be absorbed. Only if we see a clear H4 close below the EMA89, followed by failed rebounds back above it, would a deeper correction come into play. For now, this remains a “rest after the run” within a medium-term uptrend.
Wishing you all a smooth and successful trading day!

S&P 500 index at PRZ — Next Bullish Rally!!!In general, I place significant importance on the S&P 500 index( SP:SPX ), especially over the past month, because of its strong correlation with the crypto market, particularly Bitcoin( BINANCE:BTCUSDT ). When sharp movements occur in the S&P 500 index, we often see a mirrored effect in the crypto market and Bitcoin’s chart.
Currently, the S&P 500 index is moving near the support zone($6,776_$6,712) and the Potential Reversal Zone(PRZ) , and it appears to have successfully broken the upper line of the descending channel, which is a positive sign for a continued bullish trend in the coming days.
From an Elliott Wave perspective, it seems that the S&P 500 has completed a zigzag correction(ABC/5-3-5) within the descending channel, and we can expect an upward wave towards the resistance zone($6,853_$6,823).
I expect that the S&P 500 will begin to rise again from the Potential Reversal Zone(PRZ) and could climb at least up to $6,816. If it breaks resistance zone($6,853_$6,823), we can expect even more gains, which can also positively impact the broader markets.
What’s your outlook on the S&P 500 index and the U.S. stock market?
First Target: $6,816
Second Target: $6,834
Stop Loss(SL): $6,739(Worst)
Note: During U.S. trading hours, market volatility and emotions tend to increase. Please make sure to apply strict risk and capital management.
💡 Please respect each other's opinions and express agreement or disagreement politely.
📌S&P 500 Index Analyze (SPX500USD), 1-hour time frame.
🛑 Always set a Stop Loss(SL) for every position you open.
✅ This is just my idea; I’d love to see your thoughts too!
🔥 If you find it helpful, please BOOST this post and share it with your friends.

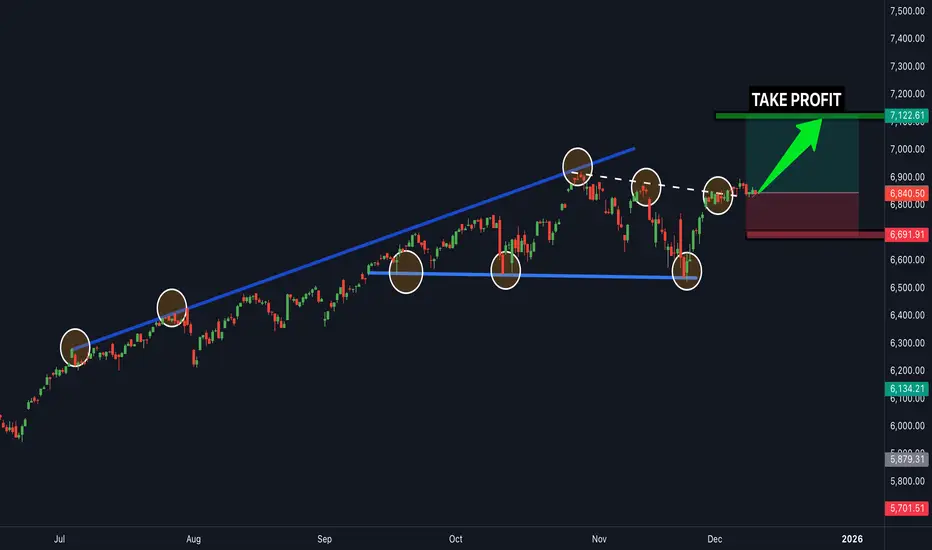
SPX...time to buySPX 500 is in a clear upwards channel and has broken the last bit of resistance (white trendline line shown) - this is a clear confirmation that the next target will be the next resistance zone to the upside shown above (this is a great buy trade opportunity) - time to buy the SPX 500 now

Nike is reaching trough lands soon ! Or not & W crash more !61% Retracement from all time low "IPO" to "ATH" is in the 60ish region. MKTS permitting & unless we are about to crash just like 1929 as some Elliottsions suggest then we are about to have a trough in Q1/Q2 of 2025 .!

SPX500 Eyes 7000 — Breakout or Bull Trap Ahead?🦸♂️ SPX 500 Heist: The 7K Bull Run Playbook (Swing Trade Setup) ✅
Alright, crew, listen up! The market is a vault, and we're here to make a strategic withdrawal. The SPX 500 is showing us the blueprints for a potential bullish breakout. This is our plan to ride the wave.
🎯 The Master Plan: BULLISH
We're looking for a classic breakout play. The gates are at 6780, and once they're open, we're going in.
⚡ Entry Signal (The "Go" Signal)
Action: Consider long positions ONLY AFTER a confirmed daily breakout and close above the key level of 🎯 6780.00.
Translation: Don't jump the gun. Wait for the market to show its hand.
🚨 Stop Loss (The "Escape Route")
Location: My suggested escape hatch is down at 🛡️ 6600.00. Place it after the breakout we talked about.
A Note from the OG: "Dear Ladies & Gentleman (Thief OG's), I am not recommending you set only my SL. It's your own choice. You can make money, then take money at your own risk." 😉
💰 Profit Target (The "Loot Bag")
Destination: We're aiming for the major resistance zone at 🎯 7000.00. This is a psychological magnet and a previous area where sellers stepped in.
Why Here? It's a zone of strong resistance, potential overbought conditions, and traps for the greedy. Be smart and escape with your profits!
Another OG Note: "Dear Ladies & Gentleman (Thief OG's), I am not recommending you set only my TP. It's your own choice. You can make money, then take money at your own risk." 😎
🔍 Market Intel: Pairs to Watch
A master thief always checks the surrounding area. Keep an eye on these correlated assets:
AMEX:SPY (SPDR S&P 500 ETF): The direct tracker. Moves almost tick-for-tick with the SPX.
NASDAQ:NDX (Nasdaq 100): Tech-heavy cousin. If NDX is strong, it often pulls SPX up with it.
TVC:DXY (U.S. Dollar Index): Our usual antagonist. A stronger dollar can be a headwind for large-cap stocks.
CME_MINI:ES1! (S&P 500 E-mini Futures): The real-time action. This is where the big moves often happen first.
✨ Community Boost
If you find value in my analysis, a 👍 and 🚀 boost is much appreciated — it helps me share more setups with the community!
#SPX500 #SP500 #SwingTrading #MarketPlaybook #PriceAction #ThiefTrader #IndexAnalysis #TechnicalAnalysis #TradingStrategy #US500 #Equities #BreakoutStrategy #TradingView #StockMarket #RiskManagement

SPX Is going up...time to buySPX 500 is in a clear upwards channel and has broken the last bit of resistance (white trendline line shown) - this is a clear confirmation that the next target will be the next resistance zone to the upside shown above (this is a great buy trade opportunity) - buy the SPX 500 now

US500 Price Map. Will Buyers Defend Key Layers Toward 7000?📊 US500/SPX500 Bullish Swing Trade Strategy | Professional Analysis 🚀
Current Price: $6,870.40 | Status: Bullish Momentum Building 🔥
🎯 TRADE OVERVIEW
Asset: US500 / SPX500 Index
Timeframe: DAY/SWING TRADE (Perfect for Active Traders)
Market Condition: BULLISH 📈
Risk Level: Calculated & Managed ✅
💡 WHY THIS SETUP WORKS
The SPX500 is trading near 52-week highs ($6,920.34), with technical indicators showing Strong Buy signals on daily timeframes. Market sentiment remains constructive with potential for mean reversion plays and breakout opportunities. The index has strong institutional support and is consolidating before the next leg up.
🎲 ENTRY STRATEGY: LAYERED APPROACH (THIEF STRATEGY)
Best Practice Approach: Use MULTIPLE LIMIT ORDERS at different price levels for optimal risk management.
Entry Layers - Place These Simultaneously:
Layer 1 - 6,800 (Low Risk Entry)
This is your first position entry at the strong support zone. This layer captures traders looking for early bounces and reduces your average entry cost significantly. Perfect for conservative traders who want maximum confirmation before committing capital.
Layer 2 - 6,825 (Medium Risk Entry)
This second layer adds confirmation as price moves higher. This is where momentum traders jump in. By staggering entries here, you're catching the middle ground between aggressive and conservative positions, giving you excellent risk-reward setup.
Layer 3 - 6,850 (Aggressive Breakout Entry)
This final layer targets breakout traders who wait for price confirmation. Use this only if you have capital left and see strong volume confirmation. This is your most aggressive entry but has the strongest conviction signal.
✅ Pro Tip: You can add MORE layers based on your risk tolerance & account size. Start small, build positions gradually. Never go all-in on one layer!
Why Layering Works 🎯
Layering is the professional way to build positions because it reduces average entry cost, protects against sudden whipsaws, captures multiple entry opportunities, and significantly increases your overall success probability. Instead of being wrong on one entry, you have three chances to be right!
🛑 STOP LOSS (SL): THIEF OG PROTECTION
SL Level: 6,750
Risk Zone: Below support level
This stop loss level protects you from breaking below a critical support zone. If price closes below 6,750, the bullish thesis is broken and you should exit to preserve capital.
📌 IMPORTANT DISCLAIMER:
⚠️ You are NOT required to use our suggested SL
⚠️ Adjust based on YOUR strategy & risk management rules
⚠️ YOUR MONEY = YOUR RULES | Trade with capital you can afford to lose
SL Management Tips:
Place your stop loss below key support levels that make sense with your trading strategy. Once you're in profit (usually +2% on SPX), consider moving your stop to breakeven so you're trading with house money. After solid confirmation and +3-5% profit, use trailing stops to let winners run. Most importantly, never risk more than 2-3% of your total account on a single trade.
🎁 PROFIT TARGET (TP): RESISTANCE CONFLUENCE
Primary Target: 7,000
Reasoning: Strong Resistance + Overbought Zone + Technical Trap Pattern
The 7,000 level represents a major psychological resistance and technical confluence where multiple indicators suggest profit-taking is likely. This is where smart money typically exits positions. The confluence of strong resistance levels, overbought RSI readings, and technical trap pattern all converge at this critical level, making it the ideal exit point for capturing the full move while protecting profits.
📌 CRITICAL NOTICE:
⚠️ Use YOUR OWN profit targets based on risk/reward ratio
⚠️ This is a SUGGESTED level only
⚠️ Protect Your Profits: Lock in gains before pullbacks
Exit Strategy:
Watch for volume divergence signals where price moves higher but volume decreases - this is a classic warning sign. Monitor RSI levels above 70, which indicate overbought conditions and potential reversals. Track support and resistance breaks throughout the move. Most importantly, don't be greedy. If you've hit your profit target, take it and move on. The best traders know when to say "I'm done for the day."
📍 RELATED PAIRS TO MONITOR (CORRELATION ANALYSIS)
Strong Positive Correlation 🔗
NASDAQ-100 (NQ100/COMP) - Correlation: +0.92
This is your tech-heavy index and moves almost in lockstep with US500. Why watch this? Because tech drives the market. If NASDAQ is weak while SPX is strong, watch out for sector rotation. The NASDAQ-100 currently sits at 25,692. If SPX breaks 7,000, expect NASDAQ targets of 26,500+ based on historical correlation patterns. This pair move confirms the strength of the rally.
DJIA (US30/Dow Jones) - Correlation: +0.89
The Dow Jones is your large-cap indicator. These are the blue-chip stocks. At 47,955, the Dow tends to lag SPX on rallies but confirms the trend strength. If Dow is not participating in SPX strength, it signals rotation OUT of mega-caps into mid-caps. Watch for this divergence as a warning signal.
Russell 2000 (RUT) - Correlation: +0.78
Small-cap participation is crucial. A weak Russell 2000 during SPX strength means only mega-caps are rallying. This is a RED FLAG for sustainability. If Russell is strong with SPX, the rally is broad-based and likely to continue. If Russell is weak, we're in a narrow rally that can reverse quickly.
Inverse Correlation (Risk Hedge) 🛡️
VIX (Volatility Index) - Correlation: -0.85
Currently at 15.41, this low volatility reading screams "risk-on" environment. Traders are comfortable, fear is low. But remember, VIX can spike suddenly. If VIX jumps above 20, consider taking profits and reducing exposure. A VIX spike signals institutional selling and risk-off sentiment.
US DOLLAR (DXY) - Correlation: -0.72
Trading at 98.97, a weak dollar SUPPORTS equities because US companies make more money when the dollar is weak (exports become cheaper). If the dollar strengthens suddenly, expect SPX pressure. Monitor Fed policy announcements that impact currency valuations - they directly impact your equity trades!
Sector Rotations to Track 💼
Tech Giants Matter:
NVIDIA (NVDA) at $182.41 is down -0.53% but still critical. This is THE stock to watch. If NVDA collapses, the entire rally is in question. NVIDIA is your AI barometer.
Meta Platforms (META) at $673.42 is up +1.80% and showing strength. This mega-cap strength confirms institutional confidence in the rally. When META leads, the market is feeling risk-on.
Microsoft (MSFT) at $483.16 is stable at +0.48%. This is your stability indicator. If MSFT can't go higher with SPX, it's a divergence warning.
Apple (AAPL) should be monitored for consumer health signals. Any weakness in AAPL suggests consumer spending concerns ahead.
🔍 TECHNICAL CONFIRMATION CHECKLIST
✅ Daily Chart: STRONG BUY - Moving Averages perfectly aligned in uptrend
✅ Weekly Chart: STRONG BUY - Macro uptrend completely intact, higher lows confirmed
✅ RSI: Not Yet Overbought - Means room to run before pullback expected
✅ MACD: Bullish Crossover Confirmed - Momentum indicator flashing green light
✅ Volume Profile: Good Distribution - Buying happening at higher price levels, not just sharp spikes
✅ Sentiment: Institutional Buying - Big money is flowing into SPX, not retail FOMO
This checklist confirms the setup is solid for the bullish premise. All signals are aligned, which means the probability is in your favor.
⚡ TRADER RULES & DISCLAIMERS
🎯 Golden Rules for This Trade:
Rule 1 - Only Risk What You Can Afford to Lose 💰
Don't use your rent money. Don't risk your emergency fund. Only trade capital that won't hurt your life if you lose it. This removes emotion from decision-making.
Rule 2 - Respect Your Stop Loss
No exceptions. Ever. A stop loss is not a suggestion - it's your insurance policy. Hit it and move on without hesitation. The traders who don't respect stops are the traders who blow up their accounts.
Rule 3 - Scale In and Out
Don't FOMO all-in on one entry. Build positions gradually with the three layers. Exit gradually with the three targets. This removes emotion and improves results dramatically.
Rule 4 - Lock Profits Before Pullbacks
Let winners run but protect gains. Your first 30% profit at 6,900 is EARNED. Take it. You only regret profits you didn't take.
Rule 5 - Track Correlations
Watch related pairs for divergence. If SPX goes up but NASDAQ goes down, something is wrong. Exit first, ask questions later.
Rule 6 - Use Alerts - Don't Stare at Screens 24/7
Set price alerts on TradingView. Let technology do the work. You have a life outside trading. Check alerts a few times per day.
Important Notices ⚠️
📋 This is TECHNICAL ANALYSIS ONLY - Not financial advice
🔒 NOT a recommendation to buy or sell
💡 Use this framework with YOUR OWN analysis - Don't blindly follow
🎓 Paper trade first if you're testing this strategy - Practice before risking real money
📊 Past performance ≠ Future results - Markets change constantly
💪 TRADER PSYCHOLOGY EDGE
Set your entries BEFORE market opens. Don't make emotional decisions when the market is moving fast. Your exit plan matters more than your entry plan. Where you exit determines your profit, not where you enter. Profits are made on discipline, not on aggression. The patient traders dominate the impatient ones.
One good trade beats ten desperate ones. Never try to "make back" losses with revenge trading. The best traders know when to step away from the market and recharge their minds.
🚀 ENGAGEMENT BOOSTERS FOR LIKES & VIEWS
If This Resonates:
👍 Like if you trade US500 index regularly
💬 Comment your entry price and targets
⭐ Bookmark this for your personal watchlist
🔔 Follow for daily swing trade setups and analysis
Share Your Thoughts:
"What's YOUR target on SPX? Comment below! 👇 Are you taking this trade or waiting for confirmation?"
"Have you tried the layered entry method? Tell me your experience in the comments!"

S&P 500 Breakdown Alert — Rising Wedge Reversal in Play!Today I want to share an S&P 500 index( SP:SPX ) analysis, as this index plays a major role in guiding correlated markets—especially crypto, and particularly Bitcoin( BINANCE:BTCUSDT ).
The S&P 500 index entered the Potential Reversal Zone(PRZ) and resistance zone($6,902_$6,875), where it began to fall.
The S&P 500 index also failed to form new Higher Highs(HH) and Higher Lows(HL), which signals weakening bullish momentum over the past 7 trading sessions.
From a classical technical-analysis perspective, it appears that the S&P 500 index has broken below the lower line of its rising wedge pattern, which is considered a bearish reversal pattern. The index is currently in the process of completing a pullback/retest of the broken structure.
My expectation is that the S&P 500 index may decline at least toward $6,823, and if important support lines break, we could see a deeper correction toward the measured move (target) of the rising-wedge pattern.
What’s your outlook on the S&P 500 index and the U.S. stock market?
First Target: $6,823
Second Target: $6,803
Stop Los(SL): $6,889(Worst)
------------------------------------------------
We should also keep in mind that several important US economic indicators will be released this week, which could significantly impact market direction. So be extra cautious with your positions, especially during data releases:
JOLTS Job Openings➡️09 December
Federal Funds Rate➡️10 December
FOMC Statement➡️10 December
FOMC Press Conference➡️10 December
Unemployment Claims➡️11 December
------------------------------------------------
💡 Please respect each other's opinions and express agreement or disagreement politely.
📌S&P 500 Index Analyze (SPX500USD), 1-hour time frame.
🛑 Always set a Stop Loss(SL) for every position you open.
✅ This is just my idea; I’d love to see your thoughts too!
🔥 If you find it helpful, please BOOST this post and share it with your friends.

BUY SPX NOW...time to buySPX 500 is in a clear upwards channel and has broken the last bit of resistance (white trendline line shown) - this is a clear confirmation that the next target will be the next resistance zone to the upside shown above (this is a great buy trade opportunity) - Time to buy the SPX 500 now
BUY SPX NOW...time to buy nowSPX 500 is in a clear upwards channel and has broken the last bit of resistance (white trendline line shown) - this is a clear confirmation that the next target will be the next resistance zone to the upside shown above (this is a great buy trade opportunity) - Time to buy SPX 500

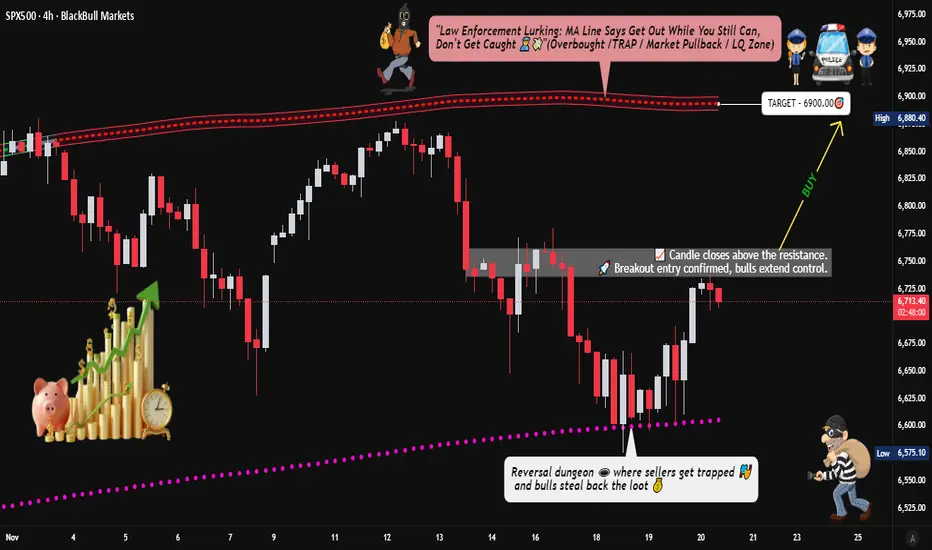
US500 Bullish Structure: Pullback → Breakout Continuation📈 SPX500/US500 Bullish Breakout Setup | Swing Trade Opportunity 🎯
🔥 Market Overview
Asset: S&P 500 Cash CFD (SPX500/US500)
Trade Type: Swing Trade (Medium-term)
Bias: BULLISH ✅
Current Price: ~$6,614 (Nov 20, 2025)
📊 Trade Setup & Technical Analysis
🎯 Strategy Confirmation
✅ Weighted Moving Average Pullback pattern confirmed
✅ Price consolidating near key resistance zone
✅ Bullish structure intact above major support levels
🚀 Entry Strategy
Breakout Entry: Enter AFTER confirmed breakout above $6,750 resistance
Wait for price to close above $6,750 with strong volume
Avoid premature entries; confirmation is key
Multiple position sizing recommended after breakout validation
🛑 Stop Loss Considerations
Suggested SL: $6,630 area
⚠️ IMPORTANT: This is a reference level only. Adjust your stop loss based on:
Your personal risk tolerance
Account size and position sizing
Trading strategy requirements
Trade at your own risk – customize stops to fit YOUR plan
🎯 Target Zones
Primary Target: $6,900-$6,950 zone
📌 Key Resistance Factors at Target:
Moving Average confluence acting as resistance barrier
Potential overbought conditions expected
Historical supply zone overlap
Risk of bull traps in this region
⚠️ Profit-Taking Strategy:
Consider scaling out near $6,900
Lock partial profits before $6,950
Trail stops for remaining position
This is YOUR trade – take profits when YOUR strategy signals
💰 Related Assets to Monitor
📉 Correlated US Indices
NASDAQ 100 (NAS100/US100) 📱
Tech-heavy index; leads SPX during risk-on moves
Correlation: ~85-90% positive
Key Level: Watch $21,000 breakout zone
DOW JONES 30 (US30) 🏭
Blue-chip indicator; confirms broad market strength
Correlation: ~80-85% positive
Key Level: $44,500 resistance critical
RUSSELL 2000 (US2000) 🏢
Small-cap indicator; risk sentiment gauge
Correlation: ~70-75% positive
Key Level: $2,400 breakout = bullish confirmation
💵 Dollar Correlation
US DOLLAR INDEX (DXY/USDX) 💵
Correlation: ~60-70% INVERSE (negative)
Dollar weakness = SPX strength typically
Key Level: Watch $106.50 support; break = SPX boost
🌍 Global Risk Assets
VOLATILITY INDEX (VIX) ⚡
Correlation: ~80% INVERSE (fear gauge)
VIX below $15 = bullish SPX environment
VIX spike above $20 = caution signal
GOLD (XAUUSD) 🥇
Correlation: Variable ~30-40% (flight to safety indicator)
Gold weakness + SPX strength = risk-on confirmed
📋 Risk Disclosure
⚠️ CRITICAL REMINDERS:
I am NOT providing financial advice
These levels are reference points only
YOU must determine your own entry, stop loss, and take profit levels
Trade with money you can afford to lose
Market conditions change rapidly – adapt accordingly
Past performance does not guarantee future results
🎓 Professional Risk Management:
Never risk more than 1-2% of capital per trade
Use proper position sizing calculators
Set alerts for key levels, don't watch charts 24/7
Have a written trading plan before entering
🔔 Action Plan Checklist
✅ Monitor price action near $6,750
✅ Confirm breakout with volume and candle close
✅ Set alerts for correlated assets (DXY, VIX, NAS100)
✅ Calculate position size based on YOUR risk tolerance
✅ Define exit strategy BEFORE entry
✅ Review market news and economic calendar
💬 Final Thoughts
This setup offers a risk-defined swing trade opportunity on the S&P 500 with clear technical levels. The weighted moving average pullback pattern provides structural support for the bullish thesis, while the $6,750 breakout level offers a defined entry trigger.
Remember: Markets are unpredictable. This analysis is educational and reflects technical observations only. YOUR trading decisions are YOUR responsibility.
🙏 Trade Safe, Trade Smart
If this analysis helps you, drop a like 👍 and follow for more setups! Let's build wealth together responsibly.
#SPX500 #SP500 #US500 #SwingTrade #Breakout #TechnicalAnalysis #StockMarket #Trading #ForexTrading #IndexTrading #BullishSetup #TradingView #MarketAnalysis
SPX500 Bullish Plan in Motion with SMA + Kijun Confirmation🚀 US500/SPX500 INDEX MARKET SWING TRADE MASTERCLASS 🎯
📊 ASSET: S&P 500 Index (US500 | SPX500)
Timeframe: 4H-Daily | Strategy Type: Swing Trade | Market Context: Bullish Pullback Confirmation
🎲 TRADE SETUP: THE "THIEF PROTOCOL" STRATEGY ⚡
✅ TECHNICAL CONFIRMATION
🔹 Primary Signal: Simple Moving Average (SMA) Pullback Retest
🔹 Secondary Confirmation: Kijun-sen (Ichimoku MA) Retest
🔹 Market Structure: Higher Lows Formation + Bullish Consolidation
🔹 Bias: LONG with Layered Entry Methodology
💰 ENTRY STRATEGY: MULTI-LAYER LIMIT ORDER APPROACH
The "Thief Layering Method" - Stack multiple buy limit orders for optimal risk distribution:
🟢 Layer 1 Entry: $6,750.00 - Initial Probe Entry (30% Position Allocation)
🟢 Layer 2 Entry: $6,800.00 - Aggressive Add (35% Position Allocation)
🟢 Layer 3 Entry: $6,850.00 - Final Confirmation Entry (35% Position Allocation)
Entry Flexibility: Adjust layers based on your account size & risk tolerance. Spread entries across pullback zones for superior fill pricing.
🛑 STOP LOSS MANAGEMENT
Recommended SL Level: $6,720.00 - Placed below the support trendline + SMA confluence
⚠️ IMPORTANT DISCLAIMER: Dear Traders! This is YOUR trading journey. We strongly recommend adjusting stop loss based on YOUR risk management rules. Account sizing is crucial - never risk more than 2-3% per trade. Your SL placement = YOUR decision, YOUR responsibility. Use proper position sizing ALWAYS.
🎯 PROFIT TARGET ZONES
Primary Target: $7,050.00 ⚡
📊 Technical Reasoning: This level represents strong resistance confluence zone, historical supply level in overbought territory, and creates a risk/reward sweet spot of 1:3+ return potential. Alert: Trap zone exists here - smart money reversal area confirmed.
Exit Strategy Recommendation: Close 50% of position at $7,000-7,020 to lock partial profits. Hold remaining 50% with trailing stop or until $7,050 for maximum upside capture. Lock profits incrementally to secure gains.
⚠️ CRITICAL REMINDER: Your profit target = YOUR choice! This TP represents technical confluence, but market conditions evolve. Trade YOUR plan, manage YOUR risk, protect YOUR capital.
🌍 CORRELATED PAIRS TO WATCH 🔗
📈 PRIMARY CORRELATIONS
1️⃣ QQQ (Nasdaq-100 ETF) - 0.99 Correlation 💻
This is the tech-heavy composition that typically leads SPX rallies. Current focus remains on AI/Mag7 momentum and overall growth stock sentiment. Key watch: QQQ strength = SPX bullish confirmation signal. When QQQ breaks out, SPX follows closely.
2️⃣ IWM (Russell 2000 ETF) - 0.95 Correlation 📍
Small-cap composition with high tariff sensitivity. Current status shows small-cap underperformance zones vulnerable to trade policy shifts. Trading tip: IWM weakness = Sector rotation risk, so watch for divergence from SPX strength.
3️⃣ DXY (US Dollar Index) - Inverse/Mixed Correlation 💵
Recent positive correlation emerging in 2025 market dynamics. Current dynamic shows dollar strength now sometimes supports equities due to policy-driven factors. Risk factor alert: DXY spike above 108 = potential SPX headwind to monitor.
📊 SECONDARY WATCH PAIRS
SPY (S&P 500 ETF) - Mirror of SPX, use for volume confirmation and institutional positioning.
DIA (Dow Jones ETF) - Large-cap value barometer, less tech-sensitive than QQQ, shows rotation signals.
VIX (Volatility Index) - Above 25 = caution mode, below 15 = complacency warning.
📱 KEY CORRELATION INSIGHTS FOR THIS TRADE
🔴 RED FLAGS - Watch These Closely:
VIX spiking above 30 signals potential fear spike. DXY breaking above 108 creates dollar strength pressure. QQQ failing to confirm breakout indicates tech weakness divergence. IWM hitting new lows signals broad market weakness.
🟢 GREEN LIGHTS - Trade Confirmation:
QQQ and SPX moving in sync above SMA is bullish. IWM holding key support levels confirms breadth. DXY consolidating means no headwind pressure building. VIX below 20 indicates low fear environment.
🎯 TRADE PSYCHOLOGY & EXECUTION TIPS
✅ Pre-Trade Checklist:
Confirm SMA pullback on 4H chart before entry. Verify Kijun retest on Ichimoku indicator. Check QQQ alignment for correlation confirmation. Monitor DXY to avoid strong dollar days. Set alerts at all 3 entry layers for execution readiness.
✅ During Trade Management:
Take partial profit at 50% move up to secure gains. Move SL to breakeven after hitting first target. Trail stop every 50-pip move in your favor. Document your execution for journal review and performance tracking.
🔥 TRADE EXECUTION SUMMARY
Signal Type: Bullish Pullback Retest ✅ Confirmed
Entry Method: 3-Layer Limit Orders 🎯 Optimized for Best Fill Pricing
SL Level: $6,720.00 🛑 Defined and Placed Below Support
TP Level: $7,050.00 🎯 Defined at Resistance Confluence
Risk/Reward Ratio: 1:3+ 💰 Favorable Trade Structure
Best Tradeable Window: Next 48-72 Hours ⏰ Active Setup Zone
Good Luck, Traders! 🚀 Trade Smart. Trade Safe. Trade Often.
Remember: Your SL = Your Protection | Your TP = Your Goal | Your Risk = Your Responsibility
#SPX500 #SwingTrade #TechnicalAnalysis #TradingIdea #S&P500 #MarketAnalysis #TradeSetup #RiskManagement

S&P 500 Bullish Layers Setup — Demand Zone Reload Opportunity!🟩 Asset:
US500 / S&P 500 — Index Market Trade Opportunity Guide (Swing / Day Trade)
💡 Trade Plan Overview
A bullish continuation plan is confirmed as the index builds strong demand-zone pressure, supported by broad fundamental economic drivers including resilient U.S corporate earnings, easing treasury yields, and steady sector rotation behavior.
This setup favors structured long positioning using disciplined multi-layer entries.
🎯 Trade Execution Plan (Thief Strategy — Layering Entry Method)
🟦 Entry Strategy (Layer Entries)
You can enter at any price, but here is the structured Thief layering approach:
Buy Limit Layer 1: 6,750
Buy Limit Layer 2: 6,800
Buy Limit Layer 3: 6,850
(You may add more layers if you prefer deeper dips — fully customizable to your personal risk appetite.)
🛡️ Stop Loss (SL)
Thief SL: 6,650
👥 Dear Ladies & Gentlemen (Thief OG’s), feel free to adjust SL based on your approach and risk preference. This SL is not mandatory — trade at your own risk tolerance.
🎯 Target Zone (TP)
Main Target: 7,050
The moving average cluster above current price acts as a strong resistance. Market structure signals a potential overbought trap, so locking profits as we approach 7,050 is wise.
👥 Dear Ladies & Gentlemen (Thief OG’s), this TP is not compulsory — take profits whenever your system confirms opportunities.
📊 Key Market Notes
Demand zones are holding strongly
Momentum shifts show bullish continuation
Price action respects MA levels
Fundamentals + rotation fuels upside
Trap zones above — manage exits properly
🔗 Correlation Watchlist (Related Markets You Must Track)
Monitoring correlated markets strengthens decision-making. Here are highly relevant pairs/assets:
💲 1. US Dollar Index (DXY)
Why important:
S&P 500 typically moves inverse to the USD.
When DXY weakens, US500 often gains momentum.
Strong USD → pressure on equities, especially tech.
Watch for:
USD pullback = bullish support for US500
USD breakout = equities face resistance
💲 2. US10Y / US Treasury Yields
Correlation:
Yields rising = stock market weakness
Yields falling = S&P 500 bullish fuel
Watch for:
Yields softening → risk-on flows
Freight in yield spikes → temporary pullbacks
💲 3. VIX (Volatility Index)
Correlation:
Low VIX = stable bullish conditions
Rising VIX = possible correction / trap
Watch for:
VIX drop under key zones → bullish confirmation
Spike above resistance → protect profits
💲 4. NASDAQ 100 (US100)
Correlation:
Strong tech = strong S&P 500
Tech weakness often leads broader index lower
Watch for:
Mega-cap earnings cycles
AI sector momentum
Bond yield reaction on tech stocks
💲 5. Crude Oil (USOIL / WTI)
Correlation:
High oil prices → inflation pressure → Fed concerns
Lower oil → relief → bullish S&P 500
Watch for:
Oil spike = possible S&P 500 pullback
Oil cool down = index strengthens
💲 6. Gold (XAU/USD)
Correlation:
Indirect & risk sentiment-based
Risk-off flows go into gold → equities may pause
Watch for:
Gold breakout = risk-off environment
Gold drop = risk-on supports S&P 500
📘 Final Thoughts
This setup follows the well-tested Thief layering strategy, combining technical demand zones with macroeconomic alignment. Stick to your personal risk comfort, manage layers wisely, and let price action guide exits.

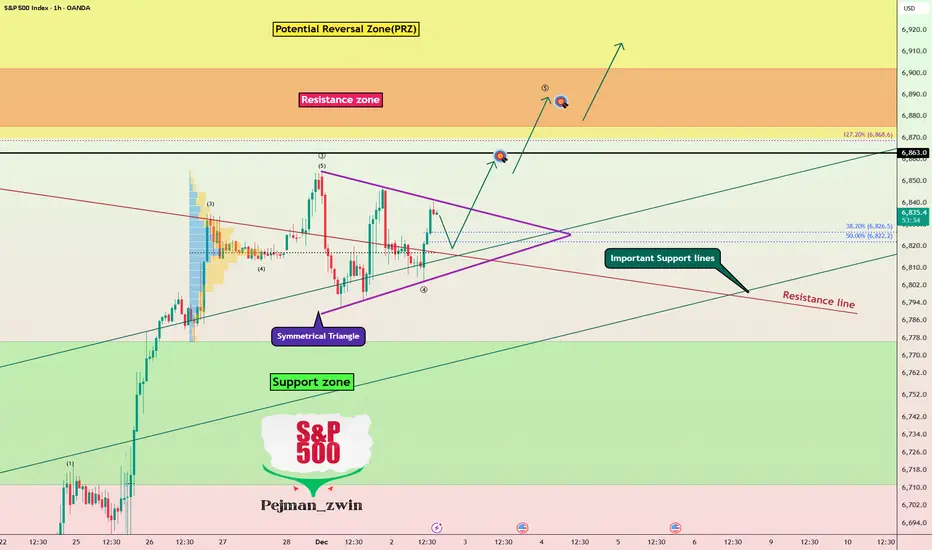
S&P 500 index Bull Run Continues — Symmetrical Triangle BreakoutThe S&P 500 index( SP:SPX ) has shown solid bullish momentum over the last 7 trading days, gaining more than +5% during this period.
The S&P 500 has once again moved back above Important Support lines, and it now appears to be breaking through a resistance line as well.
From a classical technical analysis perspective, the S&P 500 seems to be moving inside a symmetrical triangle pattern.
From an Elliott Wave standpoint, the S&P 500 looks to be completing Wave 4. A confirmed breakout above the upper line of the symmetrical triangle could validate the end of Wave 4.
I expect the S&P 500 to continue its upward movement and extend toward the Potential Reversal Zone(PRZ) and the Resistance zone ($6,902_$6,875).
What’s your view on the S&P 500 index and the broader U.S. stock market?
First Target: $6,859
Second Target: $6,887
Stop Los(SL): $6,774(Worst)
💡 Please respect each other's opinions and express agreement or disagreement politely.
📌S&P 500 Index Analyze (SPX500USD), 1-hour time frame.
🛑 Always set a Stop Loss(SL) for every position you open.
✅ This is just my idea; I’d love to see your thoughts too!
🔥 If you find it helpful, please BOOST this post and share it with your friends.
S&P500: Futures Stuck in Tight Range S&P 500 futures traded mostly sideways yesterday, remaining confined within a tight range. In our primary scenario, however, we anticipate that magenta wave (4) will soon resume its downward move. During this phase, the index is expected to initially break below the support levels at 6540 and 6371 points. We then look for the final low of the wave (4) correction to occur within our green Long Target Zone between 6163 and 5912 points. Once this low is established, the subsequent wave (5) should propel prices above resistance at 6952, marking the peak of the broader blue wave (III). Immediately after, we expect the onset of magenta wave (1), which should kick off a significant corrective phase. However, if the index continues to fall below the Long Target Zone, our alternative scenario may come into play (probability: 31%). In that case, it would suggest that the alternative blue wave alt.(III) has already completed and the major correction is already in progress.

SPX500: Break Above 6815 Could Accelerate GainsOANDA:SPX500USD |Overview
U.S. futures pointed lower on Monday as investors turned cautious following a soft, holiday-thinned trading week.
Despite Wall Street posting its strongest weekly performance since June, the Nasdaq ended November with its first monthly decline since March, as concerns grew over overstretched AI and tech valuations.
Markets are now awaiting remarks from Fed Chair Powell, along with early holiday-spending data, private payrolls, and this week’s key PCE inflation report, which may guide expectations ahead of next week’s policy meeting.
Technical Outlook
SPX500 maintains a bullish momentum while trading above 6771, although a correction from 6815 back toward 6771 is possible before attempting another upward move.
Bullish Scenario:
As long as price holds above 6771, the bullish trend remains intact.
A 4H close above 6815 will confirm continuation toward 6844 and 6888, with potential extension to 6918.
Bearish Scenario:
A 1H close below 6771 will signal the start of a bearish move toward 6713, and possibly 6670.
Pivot Line: 6815
Support: 6771 · 6713 · 6670
Resistance: 6844 · 6888 · 6918

BUY SPX NOW...time to buySPX500 is in a clear upwards channel and has broken the last bit of resistance (white trendline line shown) - this is a clear confirmation that the next target will be the next resistance zone to the upside shown above (this is a great buy trade opportunity) - Time to buy!