5-10% Correction for S&P500 incoming SPX is at the 1.618 fib level measured from Jan 25 high and April low.
This fib level acted as a temporary resistance in all major bear Markets (except 2020) with drawdowns between 5 and 10%.
A breach of the 200 DMA and Jan 25 high and April low anchored VWAP is unlikely.
Spy!

$QQQE NASDAQ 100 Equal-Weighted ETF: Breaking Out?Overview
The NASDAQ:QQQE NASDAQ 100 Equal-Weighted ETF has recently shown signs of breaking out from a period of consolidation. Since reaching its all-time high on October 27, 2025, the ETF has been trading within a wedging pattern. This technical formation typically indicates the potential for a resumption of the previous uptrend.
Recent Price Action
On the most recent trading day, the intraday high for NASDAQ:QQQE surpassed the previous high set on October 27th. This development reinforces the notion that the ETF may be poised to continue its upward movement.
Trading Strategy
In anticipation of a breakout and sustained uptrend, a half-size position has been initiated. The 21-day Exponential Moving Average (EMA), represented by the blue line on the chart, will serve as the reference point for setting a stop loss to manage risk.
Risk Management and Disclaimer
Readers are strongly encouraged to perform their own analysis and adhere to personal trading strategies. All investments involve inherent risks, so it is crucial to make careful and informed decisions when allocating capital in financial markets.

Why You Should Backtest (Before You Trust Any Strategy)Most traders ask the wrong question.
They ask:
“Does this strategy work?”
The better question is:
“When does this strategy stop working?”
Backtesting exists to answer that.
1. A Single Backtest Is Not Proof
One profitable run does not mean a strategy is good.
It means it worked once, under one set of assumptions.
Markets change.
Volatility changes.
Behavior changes.
Backtesting across parameters, symbols, and timeframes shows whether performance is structural or accidental.
2. Drawdown Matters More Than Profit
Profit attracts attention.
Drawdown determines survival.
Two strategies can both make money.
Only one lets you stay disciplined long enough to compound.
Backtesting reveals:
Worst historical drawdown
Length of drawdowns
Recovery behavior
If you don’t know those, you don’t know the strategy.
3. Most Strategies Fail From Fragility
Many strategies look great until you:
Change RSI length by 2
Shift timeframe slightly
Switch from BTC to ETH
If performance collapses from small changes, the edge isn’t robust.
Backtesting exposes fragility before the market does.
4. Backtesting Protects You From Yourself
Most trading mistakes aren’t technical.
They’re emotional.
Backtesting:
Sets realistic expectations
Reduces overconfidence
Prevents panic exits during normal variance
Confidence comes from data, not conviction.
5. Backtesting Is About Risk, Not Prediction
Backtesting doesn’t predict the future.
It defines boundaries.
It tells you:
What’s normal
What’s abnormal
When something is truly broken
That’s the difference between trading and guessing.
Final Thought
Strategies don’t fail because they’re bad.
They fail because traders never tested their limits.
Backtesting isn’t optional.
It’s the cost of taking trading seriously.

Why Default Strategy Settings Break Down Across MarketsThe Assumption: Defaults Are Good Enough
Most traders start with default indicator settings . RSI at 14. MACD at 12, 26, 9. Moving averages set to familiar values.
Defaults feel safe because they are familiar. They feel reasonable because they are widely used.
The problem: defaults are not designed to work across all symbols, timeframes, or market conditions.
The solution: instead of assuming defaults are acceptable, test how those settings behave when parameters are varied. Small changes often reveal whether a strategy is stable or dependent on coincidence.
The Assumption: If It Works on One Chart, It Should Work Elsewhere
A strategy looks clean on a single chart. Entries make sense. Losses feel explainable. Confidence builds.
The problem: one chart is not a market. Performance on a single symbol or timeframe says very little about robustness.
The solution: test the same logic across multiple symbols and timeframes. When behavior changes dramatically, it’s not failure, it’s information. Consistency across variation is what signals durability.
The Assumption: Indicator Logic Is the Edge
Traders often focus heavily on the logic behind indicators. Momentum, trend, mean reversion. The reasoning feels solid.
The problem: good logic does not guarantee good behavior. Two parameter sets can follow the same logic and produce completely different risk profiles.
The solution: explore how performance shifts as parameters move. Testing ranges, not single values, shows whether logic holds up under pressure or collapses when assumptions change.
The Assumption: Profit Tells the Full Story
Many traders judge strategies by net profit alone.
The problem: profit without context hides risk. Large drawdowns, unstable equity curves, or long stagnation periods often go unnoticed until they’re experienced live.
The solution: test for drawdown, consistency, and trade distribution alongside profit. Seeing how risk expands or contracts across parameter combinations changes how strategies are evaluated.
The Assumption: Defaults Fail Because Markets Changed
When defaults stop performing, traders often blame the market.
The problem: markets always change. A strategy that only works under narrow conditions was fragile from the start.
The solution: testing across broader conditions reveals whether a strategy is regime-dependent or structurally resilient. This allows expectations to adjust before capital is exposed.
What Testing Actually Replaces
Testing doesn’t replace strategy logic.
It replaces assumptions.
It replaces:
“This should work”
“This looks reasonable”
“Everyone uses this”
With:
“This is how it behaves”
“This is where it struggles”
“This is how sensitive it is”
Final Thought
Default settings are not wrong.
They are incomplete.
They are a starting point, not a conclusion.
The moment defaults are tested across parameters, symbols, and timeframes, they stop being assumptions and start becoming data. That shift is where real understanding begins.

Why Trading Strategies Fail When Market Conditions ChangeA Strategy Rarely Breaks Overnight
Most traders imagine strategy failure as a sudden event. One day it works. The next day it doesn’t.
In reality, strategies usually degrade slowly. Performance weakens as market conditions shift, even though the underlying logic remains unchanged. This gradual decay is easy to miss when trades are evaluated one by one.
1. Markets Do Not Stay in One Regime
Markets rotate through different environments:
High volatility and low volatility
Strong trends and choppy ranges
Expansion and compression phases
A strategy that thrives during one regime can struggle in another without any error in its design. This mismatch between strategy behavior and market conditions is one of the most common sources of frustration.
2. Why Traders Misinterpret Strategy Failure
When results deteriorate, traders often assume:
the strategy stopped working
the logic is flawed
the market “changed permanently”
In many cases, none of these are true. What changed was the context. Without understanding which environments favor or punish a strategy, losses feel random and confidence erodes.
3. How Backtesting Reveals Regime Sensitivity
Backtesting across longer periods often shows performance clustering. Profitable stretches tend to group together, followed by extended drawdowns or stagnation. These clusters usually align with shifts in volatility, trend strength, or liquidity.
Testing doesn’t eliminate drawdowns, but it explains them. Losses stop feeling mysterious when their conditions are understood.
4. The Risk of Optimizing for a Single Environment
Many strategies look impressive because they are tuned for one specific market regime. They perform exceptionally well under ideal conditions and poorly everywhere else.
Backtesting across different environments exposes this fragility. Robust strategies may not look spectacular in any single regime, but they remain functional across many.
5. Expectations Matter More Than Precision
A strategy does not need to work all the time to be valid. It needs to behave as expected.
Drawdowns are tolerable when anticipated. They become destructive when they arrive unexpectedly. Testing helps align expectations with reality and reduces reactive decision-making.
6. The Real Purpose of Backtesting
Backtesting is not about predicting the future. It is about understanding behavior.
It turns unexplained losses into understood outcomes. It replaces emotional responses with informed patience. Most importantly, it allows traders to stay aligned with the market long enough for probabilities to matter.
Final Thought
Strategies fail most often not because their logic is wrong, but because traders expect them to work under conditions they were never designed for.
Backtesting doesn’t prevent regime changes.
It prepares you for them.

ES (SPX, SPY) Analysis Week of January 26-30, 2026ES FUTURES | Week of Jan 26-30, 2026 | FOMC + Mag 7 Collision
ES closed Friday at 6,914.50 — sitting at equilibrium ahead of the most catalyst-dense week of Q1.
KEY CATALYSTS
Tue-Wed: FOMC Meeting — 94% hold at 3.50-3.75%, Powell speaks Wed 2:30 PM
Wed AMC: MSFT, META, TSLA earnings
Thu 8:30 AM: Q4 GDP — Atlanta Fed nowcast 5.37% (HOT)
Thu AMC: AAPL earnings
Fri: PCE Inflation, Month-end flows
Wild cards: Fed Chair replacement speculation, Trump-Canada 100% tariff threat, Winter storm (150M affected)
SENTIMENT SNAPSHOT
VIX: 16.09 (complacent)
SKEW: 148 (hidden tail risk)
Put/Call: 0.76 (neutral)
AAII Bulls: 43% (elevated)
NAAIM: 88% invested
Credit Spreads: Tight (risk-on)
DIX: 45%+ (dark pool buying)
Margin Debt: $1.225T ATH
Read: Retail bullish, institutions hedging. Late-cycle but no crash signals.
KEY LEVELS
Resistance:
6,956-6,970 — PWH/PDH cluster
7,040 — 4H Strong High (90%)
7,100-7,150 — Fib extensions
Support:
6,892-6,907 — 1H Fibs
6,875-6,880 — Weekly EQ (key)
6,857-6,860 — PWL
6,820 — 1H Weak Low
TRADE IDEA — MONDAY
Bias: Long on dip
Setup: Buy pullback to 6,875-6,892 support cluster
Stop: Below 6,857
Targets: 6,911 then 6,948 then 6,970
Why: Pre-FOMC consolidation typical, strong breadth (65% beating SPX — 2nd best in 50 yrs), dips being bought, no bearish trigger until Wed.
Invalidation: Close below 6,857 or VIX above 20 sustained.
RISK FACTORS
Intel crashed 17% Fri — semi headwind
DXY collapsing (97.17) — policy uncertainty
Gold $5,044 / Silver $107 — safe haven bid
Hot GDP could trigger hawkish Fed repricing
SCENARIOS
Bullish (25%): Break above 6,970 targets 7,040-7,100
Range (50%): Chop 6,880-6,970 until Wed
Bearish (25%): Break below 6,857 targets 6,820-6,780
RESPECT THE RANGE UNTIL PROVEN OTHERWISE.
Good Luck !!!

SPY Supply Cluster Above! Sell!
Hello,Traders!
SPY rejects from a well-defined supply zone while losing rising support structure. Weak bullish continuation and sell-side pressure suggest a bearish rotation toward lower liquidity pools. Time Frame 2H.
Sell!
Comment and subscribe to help us grow!
Check out other forecasts below too!
Disclosure: I am part of Trade Nation's Influencer program and receive a monthly fee for using their TradingView charts in my analysis.

SPY completes 100% price rise cycleSP500 has a just about completing 100% cycle as seen from the chart. This can be seen as an additional conformation to other technicals. You can go back to 1950's and verify that markets have corrected, consolidate,crashed after this psychological number, multiple times. If its not 100% then it can be a multiple of 100% like the 2000 bull run was for very close to 300%

SPY Mid Week Update (Jan 22–23)SPY Mid Week Update
Technical Look:
Price opened the week with a strong breakdown, exactly as outlined in my Sunday Weekly Outlook. After the initial move we saw a retest followed by continuation into the bearish target (please refer to the linked idea).
Then before the market close, Trump’s tariff cancellation comments shifted sentiment and the structure flipped back to a bullish setup.
Bullish Scenario (Active):
With Wednesday’s close, SPY has fully transitioned back into a bullish structure.
A decisive move above 686 would likely trigger a strong upside expansion.
My upside targets are:
696.25 – 700
A strong break below 679.5 would invalidate the bullish scenario.
Bearish Scenario (Unlikely):
If price breaks decisively below 679.5, I would consider the bullish scenario canceled and activate the bearish scenario.
In that case, I would expect price to continue lower and put positions could be considered on a retest near the 679 area.
This scenario would likely require a major narrative shift, such as Trump reintroducing EU tariffs. Without such a catalyst, the bullish scenario remains in play.
The primary bearish target in this scenario would be 671.25.
I share deeper US Market breakdowns and weekly scenario updates on Substack. Link is in my profile.
This analysis is for educational purposes only and reflects my personal opinion. It is not financial advice.

QQQ Mid Week Update (22-23 JAN)QQQ Mid Week Update
Technical Look:
Price opened with a strong breakdown, exactly as I expected in my Weekly Outlook from Sunday. After the initial move, we got a retest, and price continued lower into the bearish target. (Checked the linked idea.)
Then before the market close, Trump’s tariff cancellation comments shifted sentiment, and the structure flipped back to a bullish setup.
With Wednesday’s close, QQQ has fully transitioned into a bullish structure. Price action confirms that the bullish scenario is currently active and in control.
As long as there is no major sentiment shift (such as a cancellation of the Greenland deal), I expect the market to maintain its bullish structure.
Given the current momentum, price may reach upper targets relatively quickly.
Bullish Scenario (Active):
As long as the bullish structure remains intact, I expect price to continue higher.
Upside targets:
Target 1: 630
Target 2: 637
If price breaks the 610 level aggressively due to a sentiment shift, this bullish idea would be considered invalidated.
Bearish Scenario (Unlikely):
A bearish scenario would come into play only if Trump reintroduces EU tariff rhetoric and signals that the Greenland deal has been canceled.
In that case, a decisive break below 610 would open the door for put positions, and a downside continuation could follow.
The first downside target in this scenario would be 600.
I share deeper US Market breakdowns and weekly scenario updates on Substack. Link is in my profile.
This analysis is for educational purposes only and reflects my personal opinion. It is not financial advice.

Stock Market Forecast | BTC TSLA NVDA AAPL AMZN META MSFTStock Market Forecast | CRYPTOCAP:BTC TSLA NVDA AAPL AMZN META MSFT
SP:SPX CME_MINI:ES1! CME_MINI:NQ1!
Weekly stock market analysis covering the S&P 500 (SPY), Nasdaq 100 (QQQ), Bitcoin (BTC), and major large-cap stocks. In this video, we break down technical charts, key support and resistance levels, sector rotation, market sentiment, dark pool activity, earnings, and macroeconomic data to identify high-probability market scenarios for the week ahead.
Timestamps are included below so you can jump directly to specific tickers and chart analysis.
0:00 Intro & Market Overview
0:58 Sector & Sentiment Data
2:10 MAG 7 ETF / Dark Pools
5:12 ARK / Innovation & Small Caps
6:34 Earnings & Economic Calendar
8:44 S&P 500 (SPY)
12:12 Nasdaq 100 (QQQ)
15:22 Bitcoin (BTC)
22:15 Tesla (TSLA)
25:00 Meta (META)
26:30 Amazon (AMZN)
28:00 Microsoft (MSFT)
32:58 Google (GOOGL)
36:27 Apple (AAPL)
39:38 Nvidia (NVDA)
42:40 Outro

$TSLA Earnings Surprise? Sub $400 perhapsWell... Hope everyone has been good since I've last seen everyone. I'm doing alright, thanks for asking. Had my first profitable year trading options and it feels fantastic. With that said, lets start the new year with a bang! I've got this bar pattern here, a direct bearish match. Invalidation with a close above the gap at $475. Any close below the gap fill will be considered bearish into Earnings where the pattern matches up for a mean drop sub $400 by the end of the first week of February. I'll be looking forward to catching this $70 move if possible.

Tears of Liberty. Lets Make America Sell Again.Over the past decade, the U.S. stock market has significantly outperformed global stock markets excluding the United States. This divergence in returns has been one of the defining features of global investing since 2015, with U.S. equities—especially large-cap technology stocks—driving much of the outperformance.
Annualized Returns (2015–2025)
AMEX:SPY , S&P 500 Index(U.S.):
The S&P 500 delivered an average annualized return of 13.8% over the past ten years.
NASDAQ:ACWX , MSCI All World ex U.S. (Rest of World):
Global stocks outside the U.S. returned an average of 4.9% annually over the same period
Year-by-Year Breakdown
Year | SPX | World ex U.S. | U.S. Surplus
2024 23.9% 4.7% +19.2%
2023 23.8% 17.9% +5.8%
2022 -19.6% -14.3% -5.4% (!)
2021 26.6% 12.6% +14.0%
2020 15.8% 7.6% +8.2%
2019 30.4% 22.5% +7.9%
2018 -6.6% -14.1% +7.5%
2017 18.7% 24.2% -5.5% (!)
2016 9.8% 2.7% +7.1%
2015 -0.7% -3.0% +2.3%
Key Drivers of Performance
U.S. Outperformance
The U.S. market’s dominance was driven largely by the rapid growth of technology giants (such as Apple, Microsoft, Amazon, and Alphabet), which benefited from strong earnings growth, global market reach, and significant investor inflows.
International Underperformance
Non-U.S. markets faced headwinds such as multiply choking sanctions and tariffs, slower economic growth, political uncertainty (notably in Europe), a stronger U.S. dollar, and less exposure to high-growth technology sectors.
Valuation Gap
By 2025, U.S. stocks are considered relatively expensive compared to their international counterparts, which may offer more attractive valuations going forward.
Recent Shifts (2025 Trend):
As of early 2025, international stocks have started to outperform the S&P 500, with European and Asian equities seeing renewed investor interest. Factors include optimism over economic recovery in China and strong performance in European defense and technology sectors.
Long-Term Perspective
Historical Context
While the past decade favored U.S. equities, this has not always been the case. For example, during the 2000s, international stocks outperformed the U.S. following the dot-com bust.
Market Weight
The U.S. accounts for roughly 60% of global stock market capitalization and about 25% of global GDP, so its performance has a substantial impact on global indices.
Conclusion
From 2015 to 2025, the U.S. stock market delivered nearly triple the annualized returns of global markets excluding the U.S., primarily due to the outperformance of large-cap technology stocks.
While this trend has persisted for most of the decade, early 2025 shows signs of a potential shift, with international equities beginning to close the performance gap. Investors should remain aware of valuation differences and the cyclical nature of global market leadership.
The main technical chart for U.S./ ex U.S. ratio indicates the epic reversal is in progress.

ES (SPX, SPY) Analysis, Key-Zones, Setups for Fri (Jan 23)
Macro sentiment shifted bullish this week. Trump reached "framework deal" with NATO on Greenland at Davos, dropping tariff threats on 8 European nations. Markets rallied on de-escalation.
Breaking overnight: China greenlights tech firms to prep Nvidia H200 orders - major reversal, risk-on for tech sector.
Asian markets hit new highs. MSCI Asia Pacific +0.4%. Gold near $5,000. Dollar plummeted most in a month. Investors rotating out of US assets into emerging markets at record pace.
European PMIs came in better than expected. German Manufacturing 48.7 vs 47.8 forecast. UK Services 54.3 vs 51.7 - strong beat. UK Retail Sales +2.5% vs +1.1% expected.
BOJ held rates at 0.75% as expected. Japan PM Takaichi dissolved parliament, snap election Feb 8th.
TODAY'S ECONOMIC CALENDAR (ET)
9:45 AM - US Manufacturing PMI Flash (Forecast 52.1)
9:45 AM - US Services PMI Flash (Forecast 52.8)
10:00 AM - Michigan Consumer Sentiment Final (Forecast 54.0)
PMIs are the main catalyst today. Services PMI is the bigger market mover.
MULTI-TIMEFRAME STRUCTURE
4H Chart:
Price at Equilibrium ~6940 after recovering from LL at 6825 (Jan 20-21 selloff). CHoCH confirmed mid-January around 6900. Still printing LH structure - needs break above 6964+ for bullish confirmation. Oscillator readings neutral with slight bearish bias.
1H Chart:
HH formed at 6964.5 on Jan 22. Multiple LH prints developing. BOS marked - structure attempting bullish shift. Price sitting at PWL area. Oscillator showing bearish divergence developing.
30M Chart:
Tight consolidation between session levels. Price hovering around VWAP 6948 and Prior Close 6946. Waiting for PMI catalyst to determine direction.
RESISTANCE:
7040-7045 - Prior 4H HH, swing target
7015-7020 - 1H Strong High, 707K volume node
6990-7010 - Major HTF zone. 4H PWH/PQH cluster. 1H PMH. 651K volume node (39%). Premium zone entry.
6958-6970 - Primary resistance cluster. 4H LH 6964.5. 1H HH 6964.5. PDH 6969. ONH 6958.5. Y-VAH 6958.5. NYAM.H 6964.5. AS.H 6960.75. 120K volume zone (7%).
SUPPORT:
6930-6940 - Primary support cluster. 4H Equilibrium 6940. 1H Equilibrium 6940. Y-VAL 6932.5. NYPM.L 6932.5. PWL zone. 38K volume node (2%).
6920-6928 - Secondary support. PDL 6925.5. NYAM.L 6925.5.
6905-6915 - Deep pullback zone. ONL 6911.25. Thursday LO.L 6914.75. 1H HL structure.
6895-6905 - 1H CHoCH+ zone, structure support.
6820-6830 - 4H LL from Jan 20-21. 145K volume shelf (9%).
6795-6810 - HTF liquidity target. 4H PML. Weak Low zone.
SESSION GAME PLAN
Pre-9:45 AM: Expect consolidation 6930-6958. No forced trades. Mark levels and wait.
9:45 AM PMI Release: If PMI beats, look for 6930-6940 buy on any flush. If PMI misses, look for 6958-6970 rejection short. Initial move often fades - don't chase.
10:00 AM Post-Michigan: True directional move typically emerges after initial volatility settles. Best setups at confluence zones with CVD confirmation.
Friday Afternoon: Reduced position sizing after 2 PM. Watch for end-of-week flows. Book profits before weekend.
BIAS
Neutral-to-Bullish. Macro backdrop improved significantly. Technical structure shows recovery from Monday selloff. However 4H/1H still printing LH pattern - needs 6970+ break for bullish confirmation. PMI data is the wild card.
Price sitting exactly at 4H/1H Equilibrium - decision point. Wait for CVD confirmation at the 5-star confluence zones for highest probability entries

Distribution of Wyckoff Started in $SPYFrom a Wyckoff theory perspective, I expect a decline in the stock after a period of accumulation. The chart shows the most important signs of weakness in the uptrend. The break of the creek line is a confirmation of a bearish move, at least down to the 652 bottom AMEX:SPY

$SPY & $SPX — Market-Moving Headlines Friday Jan 23, 2026🔮 AMEX:SPY & SP:SPX — Market-Moving Headlines Friday Jan 23, 2026
🌍 Market-Moving Themes
💻 Intel Supply Shock
Intel beats earnings but drops after hours as severe chip supply constraints cap near-term revenue
🔁 Semiconductor Share Tension
Chip demand remains strong while capacity limits raise questions around order allocation
🏦 FinTech Consolidation Signal
Capital One announces Brex acquisition as credit trends and dealmaking collide
🏥 MedTech Spend Rebound
Hospital procedure growth resurfaces following strong Intuitive Surgical results
📊 Labor Market Resilience
Jobless claims remain low, reinforcing soft-landing expectations into month-end
📊 Key U.S. Economic Data Friday Jan 23 ET
9:45 AM
- S and P Flash U.S. Services PMI Jan: 53.0
- S and P Flash U.S. Manufacturing PMI Jan: 52.1
10:00 AM
- Consumer Sentiment final Jan: 54.0
⚠️ Disclaimer: For informational purposes only. Not financial advice.
📌 #SPY #SPX #Macro #PMI #Earnings #Semiconductors #Banks #Healthcare #Markets #Stocks #Options

2026 Price Target for SPY: $790 – Why the S&P 500 Could Soar 15%If you haven`t bought the dip on SPY last year:
Why my Price Target is $790 for SPY? Key Drivers for 2026!
Earnings Growth Acceleration:
Analysts expect S&P 500 EPS to grow 12–15% in 2026 (Goldman Sachs: 12%; FactSet consensus: ~14.9%). This builds on the AI-driven productivity boom and resilient consumer spending. If AI adoption accelerates (as seen in Meta, Nvidia, and Microsoft earnings), we could see 15–18% EPS growth—pushing multiples higher in a low-rate environment.
Fed Policy Tailwinds:
With inflation cooling (core PCE at ~2.8% in November, in line with expectations) and the economy strong (Q3 2025 GDP revised to +4.4%), the Fed is likely to deliver 1–2 more rate cuts in 2026. Lower rates support valuations and boost corporate borrowing/profits—classic bull-market fuel.
Geopolitical & Policy Clarity:
Trump's recent backtrack on aggressive tariffs (U-turn on 10–25% threats to NATO allies and Greenland deal) has eased fears. Combined with potential fiscal stimulus and deregulation, this creates a pro-growth backdrop. Midterm elections could add volatility, but history shows markets often "pump" post-election.
Valuation Expansion Potential:
The forward P/E is ~22x—elevated but justified by AI productivity gains. If earnings beat expectations and rates fall, multiples could stretch to 24–25x (similar to past tech-led cycles), supporting my higher target.
Comparison to Wall Street ConsensusWall Street targets for the S&P 500 end-2026 range widely:
Conservative: Bank of America ~7,100 (3–4% upside)
Average: ~7,269–7,600 (6–11% upside)
Bullish: Oppenheimer 8,100; Deutsche Bank 8,000; Goldman Sachs ~12% total return
My $790 SPY target sits on the bullish side (~15% upside), assuming stronger-than-expected earnings and policy support. It's not moonshot territory (some outliers see 8,000+), but it requires the rally to broaden beyond Big Tech.
Risks to Watch:
Tariff resurgence or trade wars could cap gains.
Inflation reacceleration might delay Fed cuts.
AI spending disappointment → valuation compression.
Volatility spikes around elections or macro data.
Still, the base case remains bullish: resilient economy, AI tailwinds, and supportive policy. SPY at $790 would mark another strong year in this bull run.

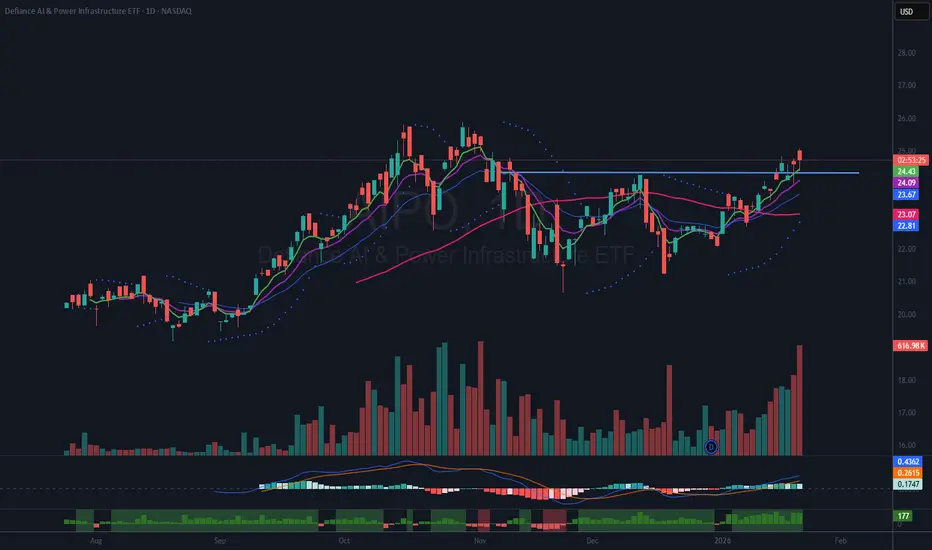
Analysis of the $AIPO – A.I. and Power Infrastructure ETFIntroduction
The NASDAQ:AIPO – A.I. and Power Infrastructure ETF is an investment vehicle that integrates exposure to companies involved in both power generation and artificial intelligence. This unique combination aligns with the growing demand for technological advancement and energy infrastructure, positioning it as a compelling option for those seeking to capitalize on the expansion of the A.I. sector.
Fundamental Perspective
From a fundamental standpoint, the ETF comprises companies considered to be at the forefront of the rapidly evolving artificial intelligence landscape. These organizations play a pivotal role in shaping the future of A.I., reinforcing the fund’s relevance in today’s market environment.
Technical Analysis
Technically, the NASDAQ:AIPO ETF appears poised to break out of its basing pattern, suggesting potential upward momentum. This observation supports the consideration of an entry point for investors who are monitoring technical signals.
Investment Approach
A half-sized position has been initiated with the intention of maintaining the investment over a longer time horizon. To manage risk, a stop loss has been established: the position will be reconsidered should there be two consecutive closes below the 21-period Exponential Moving Average (EMA), indicated by the blue line on the chart.
Key Holdings
Notable holdings within the fund include companies such as NYSE:PWR , NYSE:ETN , NYSE:GEV , NYSE:VRT , TSX:CCO , NASDAQ:CEG , NYSE:BE , among others. These constituents contribute to the fund’s exposure across both power infrastructure and artificial intelligence sectors.
Important Disclaimer
Readers are strongly encouraged to conduct their own analysis and adhere to individual trading strategies. All investments carry inherent risks, making it essential to make careful and informed decisions when allocating capital in financial markets.
ES (SPX, SPY) Analysis, Key Levels, Setups for Thur, Jan 22
GREENLAND CRISIS DE-ESCALATION
Trump announced "framework of a future deal" with NATO on Greenland/Arctic security. Feb 1 tariffs on 8 European nations CANCELLED. Market rallied immediately on de-escalation - tension that caused Tuesday's -1.3% selloff now reversing. NATO Secretary General Rutte confirmed deal focused on "Arctic security through collective efforts." Denmark welcomed the news, calling it "ending on a better note."
UKRAINE PEACE PROGRESS
US Envoy Witkoff: "We've got it down to ONE issue... I'm actually optimistic." Trump-Zelenskyy meeting TODAY in Davos (7:00 AM ET / 1:00 PM local). Witkoff & Kushner heading to Moscow to meet Putin (around 11:00 AM-12:00 PM ET). Trump floated "tariff-free zone" for Ukraine post-war reconstruction. Major diplomatic progress could spark additional risk appetite.
FED INDEPENDENCE PRESERVED
Supreme Court SKEPTICAL of Trump's attempt to fire Fed Governor Lisa Cook. Justice Kavanaugh: Trump's position "would weaken, if not shatter, Fed independence." Bipartisan pushback from conservative AND liberal justices. Market participants already adjusting Fed outlook - reduced betting odds of Cook removal. This removes a significant tail risk for monetary policy uncertainty. Court expected to rule by June 2026.
AI/TECH MOMENTUM
Nvidia CEO Jensen Huang: AI revolution "would require trillions of dollars." Global chip stocks performing strongly in premarket. Nasdaq 100 futures +0.8% overnight. AI infrastructure plays leading the rally.
WHITE HOUSE ECONOMIC OPTIMISM
WH Sr. Adviser Hassett: "We might get two quarters in a row above 5%"
Hassett: "Recent inflation data may have been very promising"
BEARISH CATALYSTS / RISKS
-------------------------
1. PCE INFLATION DATA (10:00 AM ET) - CRITICAL EVENT
Combined October & November release (unusual - due to prior government shutdown). Consensus: 2.8% YoY for both headline and core. Credit Agricole expects 2.9% YoY (above consensus) which could pare back Fed cut expectations. HOT print = hawkish repricing, potential selloff. COOL print = further rally fuel.
2. GEOPOLITICAL UNCERTAINTY REMAINS
Greenland deal is "framework" only - no concrete details yet. Denmark still says Greenland "not for sale" - fundamental disagreement persists. Ukraine talks down to "one issue" but resolution not guaranteed. Putin-related meetings later today could introduce volatility.
3. EXTENDED RALLY CONCERNS
Small caps outperforming S&P 500 for 13 straight sessions. S&P has yet to fully recover weekly loss. Gold on track for greatest weekly gain since October (flight to safety signal). Bitcoin below $90K showing crypto weakness.
TECHNICAL ANALYSIS
==================
MULTI-TIMEFRAME STRUCTURE
-------------------------
DAILY
Structure: Bullish, recovering from December lows. Recent CHoCH confirmed bullish continuation. Price trading in PREMIUM zone (above 50% fib). PQH resistance cluster near 6,988-7,000. Key Support: PML ~6,780, PQL ~6,600. Fib Extensions (upside targets): 1.272 @ 7,149.75 | 1.618 @ 7,226.75. LuxAlgo Oscillator Matrix: Momentum building but approaching overbought.
4-HOUR
Structure: Bullish swing established after Monday's LL at 6,791. Current position: Testing resistance in 6,940-6,960 zone. Premium Zone: 6,960-7,020 (heavy supply expected). PWL: 6,923.25 (key level to monitor). Fib retracement levels from recent swing: 1.272 @ 6,873.50 | 1.618 @ 6,834.50 | 2.0 @ 6,791.25
1-HOUR
Structure: HH-HL pattern intact. Recent BOS above 6,920 confirms bullish momentum. Premium zone: 6,950-7,050 (overhead supply). Discount zone: 6,830-6,865 (accumulation area). PML: ~6,780. Fib Extensions: 1.272 @ 7,077.50 | 1.618 @ 7,122.75 | 2.0 @ 7,172.75. Volume profile shows strong buying into Wednesday close.
30-MINUTE KEY LEVELS (from stats boxes)
ES Levels:
PDH: 6,904.75
PDL: 6,822.25
ONH: 6,916.50
ONL: 6,846.75
VWAP: 6,865.50
IB High: 6,897.00
IB Low: 6,865.75
Open: 6,886.00
Prior Close: 6,837.50
Y-VAH: 6,904.50
Y-POC: 6,886.00
Y-VAL: 6,841.50
NQ Levels:
PDH: 25,429.75
PDL: 25,098.00
ONH: 25,439.75
ONL: 25,095.25
VWAP: 25,279.00
Prior Close: 25,144.00
KEY ZONES
=========
RESISTANCE (Supply Zones)
-------------------------
6,916-6,920: ONH / Session High - first rejection level, partial profit zone
6,940-6,960: 4H resistance cluster - expect selling pressure
6,988-7,000: Daily PQH + Round Number - major psychological resistance
7,020-7,030: PMH Confluence - strong institutional supply
7,077-7,080: 1.272 Fib Extension - extended target if breakout
7,120-7,150: 1.618 Fib Extension - swing target
SUPPORT (Demand Zones)
----------------------
6,897-6,905: PDH / IB High confluence - first pullback watch zone
6,865-6,875: VWAP + IB Low - high-probability bounce zone
6,846-6,850: ONL - intraday support
6,822-6,830: PDL - critical intraday support
6,780-6,800: PML + Deep Discount - swing support zone
6,790-6,795: Week's LL + 2.0 Fib - invalidation level for bullish thesis
TRADE SETUPS
============
PRIMARY SETUP: LONG ON PULLBACK TO 6,865-6,905
----------------------------------------------
Thesis: Relief rally continuation after Greenland de-escalation and Fed independence preserved. Pullback to VWAP/IB zone provides optimal R:R.
Entry Zone: 6,865-6,905
Stop Loss: 6,818 (below PDL)
Targets:
T1: 6,916 (ONH) - take 50%
T2: 6,955-6,960 (4H resistance) - take 35%
T3: 6,990+ (runner) - trail BE
Confirmation Required:
- CVD divergence at support (selling exhaustion)
- Bid absorption
- Avoid entry if PCE comes hot (>2.9% YoY)
SECONDARY SETUP: BREAKOUT LONG ABOVE 6,920
------------------------------------------
Thesis: Clean break above ONH triggers continuation toward 4H resistance and daily PQH.
Entry: 6,920-6,930 (break and retest)
Stop Loss: 6,895 (below breakout)
Targets:
T1: 6,955-6,960
T2: 6,990-7,000
T3: 7,030
Confirmation Required:
- Volume surge on breakout
- NQ leading/confirming
- No negative headline flow
HEDGE SETUP: SHORT AT PREMIUM REJECTION (6,988-7,000)
-----------------------------------------------------
Thesis: If price spikes into daily PQH without consolidation, fade for mean reversion.
Entry: 6,988-7,000 (rejection candle)
Stop Loss: 7,025
Targets:
T1: 6,955
T2: 6,920
Only valid if:
- Aggressive spike into resistance
- CVD divergence (buying exhaustion)
- PCE already released and digested
- Clear rejection wick on 15m chart
SESSION GAME PLAN
=================
PRE-MARKET (6:00-9:30 AM ET)
- Monitor Trump-Zelenskyy meeting outcome (7:00 AM ET)
- Watch for headline risk from Davos
- Note any pre-PCE positioning in futures
PCE RELEASE (10:00 AM ET)
- Wait 15-30 minutes for initial reaction to settle
- Hot print (>2.9%): Look for short opportunities on failed breakouts
- Cool print (<2.7%): Aggressive long bias, buy dips
REGULAR SESSION
- Primary focus: Pullbacks to 6,865-6,905 for longs
- Take profits at resistance levels (6,916, 6,955)
- If price holds above 6,920, shift to breakout mode
- Late session: Watch for Putin meeting headlines (11:00 AM-12:00 PM ET)
RISK MANAGEMENT NOTES
=====================
1. Position Size: Standard - conditions favor continuation but event risk elevated
2. Max Loss: 10 points per scalp, 25 points per swing position
3. Avoid: Mid-range entries between 6,925-6,950 (no edge zone)
4. Headlines: Greenland/Ukraine headlines can cause instant 10-20 pt swings - use wider stops or reduce size
5. PCE Reaction: Don't fight the initial move; wait for exhaustion signals
SUMMARY & FORECAST
==================
NEAR-TERM (Today): Bullish bias with 65% probability of testing 6,955-6,990 if PCE comes inline or cool. 35% chance of pullback to 6,830-6,865 on hot inflation print.
WEEKLY OUTLOOK: Continuation of recovery rally targeting PQH at 6,988. Break above opens door to 7,050-7,080 (1.272 extension). Failure to hold 6,820 shifts bias back to neutral with potential retest of 6,780-6,800.
KEY LEVELS TO WATCH:
Bullish above: 6,905
Bearish below: 6,820
Breakout trigger: 6,920+
Target zone: 6,955-7,000

S&P 500 Extreme Breadth Reading! Caution!Why It Matters
Strong breadth = healthy rally, broad participation → more sustainable trend.
Weak breadth = top-heavy rally, fragile momentum → prone to correction.
Think of it like an airplane:
If all four engines (hundreds of stocks) are pushing, you can climb easily.
If one engine (a few mega-caps) is doing all the work, you can stay aloft — but not for long!
CAUTION! is in order!
Click boost, follow, comment nicely for more authentic, no BS, raw analysis. Let's get to 6,000 followers. ))

S&P500, NASDAQ Update: Found Support! Heading Higher?This is an mid-week UPDATE to the Weekly Forex Forecast for the week of Jan. 19-24th.
In this video, we will analyze the following FX market: ES and NQ
Both of the indices dumped upon the Open Tuesday with Trump tariff threats. Wednesday, the market found support and bounced for a full recovery from Tuesday's drop.
If price breaks through the Volume Imbalance, we could see the market rally to the buy side liquidity highs, as mentioned in the forecast .
We'll soon see...
Enjoy!
May profits be upon you.
Leave any questions or comments in the comment section.
I appreciate any feedback from my viewers!
Like and/or subscribe if you want more accurate analysis.
Thank you so much!
Disclaimer:
I do not provide personal investment advice and I am not a qualified licensed investment advisor.
All information found here, including any ideas, opinions, views, predictions, forecasts, commentaries, suggestions, expressed or implied herein, are for informational, entertainment or educational purposes only and should not be construed as personal investment advice. While the information provided is believed to be accurate, it may include errors or inaccuracies.
I will not and cannot be held liable for any actions you take as a result of anything you read here.
Conduct your own due diligence, or consult a licensed financial advisor or broker before making any and all investment decisions. Any investments, trades, speculations, or decisions made on the basis of any information found on this channel, expressed or implied herein, are committed at your own risk, financial or otherwise.

SPY Weekly Outlook – Week 3 of 2026 (Jan 19–23)SPY Weekly Outlook – Week 3 of 2026 (Jan 19–23)
Technical Look:
As expected last week, price found support at the 687.5 level and continued its upside move. We discussed that if SPY failed to push toward 700 on Monday’s open, a post CPI pullback toward 687.5 could occur. That scenario played out precisely on Wednesday, with price retracing into the 687.5 zone and finding support there.
As I mentioned in my Wednesday Mid Week Update, this reaction marked a shift back to a bullish structure, with upside targets at 691.75 – 694 – 695.25. I also stated that I would exit all call positions at 695.25, and price reached that level exactly before getting rejected.
(Please refer to the linked idea for visual reference.)
Scenarios – Prediction:
At this point, I am tracking two possible scenarios for SPY.
Scenario 1: Bearish Scenario (Higher Probability)
This is currently the more likely scenario, mainly due to the macro backdrop, including Trump–EU tensions and potential EU tariffs related to Greenland.
I believe price may open the week with a sharp downside move.
My bearish targets are:
686 – 679.75 – 669.5
If price breaks 686 aggressively and closes a 4H candle below it, I would expect a move toward 679.75.
Similarly, if 679.75 is broken decisively and holds below, price could extend toward 669.5.
Each of these bearish targets also represents a potential bounce or reversal zone, so I prefer taking partial profits (around 1/3) at each level.
If price breaks 686 decisively, I would look to engage on the short side using put options.
Scenario 2: Bullish Scenario
This scenario becomes valid only if Trump EU tensions ease before the market opens (with Monday being a holiday and trading resuming on Tuesday).
The 695 level acts as a call wall in options positioning for SPY. If price breaks above 695 aggressively, I would look to buy calls on a retracement, targeting a move toward the 700 area.
Position Management Notes:
I manage risk by scaling out of positions at key reaction levels and adjusting exposure as structure confirms. Partial profit-taking at major levels is a core part of my approach.
I share deeper US Market breakdowns and weekly scenario updates on Substack. Link is in my profile.
This analysis is for educational purposes only and reflects my personal opinion. It is not financial advice.

QQQ Weekly Outlook – Week 3 of 2026 (Jan 19–23)QQQ Weekly Outlook – Week 3 of 2026 (Jan 19–23)
Technical Look:
Last Monday, price pushed into 629.25, which I marked as Bullish Target 1 in last week’s outlook, but failed to secure a close above that level. As mentioned in my Sunday outlook, with CPI scheduled for Tuesday, I did not expect sustained upside continuation beyond those levels before the data release.
QQQ tapped 629.25, failed to hold above it, and began its retracement exactly as anticipated.
Since QQQ was the stronger index relative to SPY, it found support earlier and did not need to reach its full downside target at 610.25. SPY had already reached its key support zone, which allowed QQQ to stabilize sooner.
(Please refer to the linked idea for visual confirmation.)
Scenarios – Prediction:
At this stage, I am tracking two potential scenarios.
Scenario 1: Bearish Scenario (Higher Probability)
This is currently the more likely scenario due to the macro environment, particularly Trump–EU tensions and potential EU tariffs related to Greenland.
I believe price may open the week with a sharp downside move.
My bearish targets are:
614.5 – 610.25 – 599.5
If price breaks 614.5 decisively and closes a 4H candle below it, I would expect a move toward 610.25.
Likewise, if 610.25 is broken aggressively and holds below, price could extend toward 599.5.
Each of these bearish targets also represents a potential bounce or reversal zone, so I prefer taking partial profits (around 1/3) at each level.
If price breaks 614.5 decisively, I would look to engage on the short side using put options.
Scenario 2: Bullish Scenario
This scenario becomes valid only if Trump–EU tensions ease before the market opens (with Monday being a holiday and trading resuming on Tuesday).
The 626 level acts as a call wall in options positioning for QQQ. If price breaks above 626 aggressively, I would look to buy calls on a retracement, targeting 629.5 and 636.5.
Position Management Notes:
I rely on confirmation-based entries around key levels. Once in a position, I manage risk by taking partial profits at reaction zones and adjusting exposure as price structure develops.
I share deeper US Market breakdowns and weekly scenario updates on Substack. Link is in my profile.
This analysis is for educational purposes only and reflects my personal opinion. It is not financial advice.
