ES for the Holiday WeekLooking at ES for the holiday week it seems generally bullish. After bouncing off this weekly support they seem to be targeting this untested daily level at 6907. There is also the 4hr sitting at 6912. Confluence of these levels being so close together makes me think they are targeting this area. If they continue to push with momentum 6942 is in play to attack those previous highs.
Trend plotted by TrenVantage LITE
Trades plotted by BreakPoint LITE
Spy!

$SPY & $SPX Scenarios — Week of Dec 22 to Dec 26, 2025🔮 AMEX:SPY & SP:SPX Scenarios — Week of Dec 22 to Dec 26, 2025 🔮
🌍 Market-Moving Headlines
• Holiday week liquidity: Thin volumes amplify moves, especially around Tuesday’s data dump.
• Delayed macro catch-up: GDP and durable goods hit at once, giving markets a late-cycle growth read before year-end positioning.
• Consumer confidence update: One of the few forward-looking signals in a quiet, holiday-shortened week.
📊 Key Data & Events (ET)
Tuesday, Dec 23
8 30 AM
• GDP Q3 (delayed): 3.2 percent
• Durable Goods Orders (Oct, delayed): -1.1 percent
9 15 AM
• Industrial Production (Oct): 0.1 percent
• Capacity Utilization (Oct): 75.9 percent
• Industrial Production (Nov): 0.1 percent
• Capacity Utilization (Nov): 76.0 percent
10 00 AM
• Consumer Confidence (Dec): 91.7
Wednesday, Dec 24
8 30 AM
• Initial Jobless Claims (Dec 20): 225,000
Thursday, Dec 25
• Christmas Holiday — Markets Closed
Friday, Dec 26
• No major data scheduled
⚠️ Disclaimer: For informational use only — not financial advice.
📌 #SPY #SPX #markets #macro #holidayweek #GDP #durablegoods #consumerconfidence

$SPY: 15m Structural Repair & Dynamic Trend BreakoutWhat I’m Seeing: I am currently observing a confluence on the AMEX:SPY 15-minute chart following the Friday close at $680.59. My Structure Engine shows that price has fully cleared the $679 intraday demand threshold, effectively 'repairing' the liquidity void created during the mid-morning dip. Simultaneously, the Automatic Trend Line script has printed a fresh support level at $679.50, confirming that the short-term trend is now realigned with the larger bullish bias.
Why It Matters: This 15m confluence is a high-confidence signal for intraday expansion. By 'sealing' the void below $679, the market has established a new structural floor. When the Automatic Trend Line engine identifies support right on top of a repaired zone, it indicates that the 'path of least resistance' has shifted upward. It suggests that intraday sellers have been absorbed and momentum is now being guided by the dynamic trend.
What I Expect to See Next: I expect the 15m trend to hold as price targets the immediate pivot high at $681.50. If we see a 15m candle body close above $681.50, the 'void' to the next major resistance at $684.22 (Monday's projected range high) becomes the primary target. I will be watching for the Trend Engine to maintain its slope; a breakdown below the $676.75 support would invalidate this short-term structural repair thesis.

Stock Market Forecast | BTC TSLA NVDA AAPL AMZN META MSFTQQQ stock market Forecast
Nvidia Stock NVDA Forecast
Apple Stock AAPL Forecast
Microsoft Stock MSFT Forecast
Google Stock GOOGL Forecast
Amazon Stock AMZN Forecast
Meta Forecast Technical Analysis
Tesla Stock TSLA Forecast
Magnificent 7 stocks forecast
Bitcoin CRYPTOCAP:BTC forecast
SP:SPX NASDAQ:NDX CME_MINI:ES1!

S&P Futures Trading Day 85 — Watching the Market Run Without MeEnded the day +$80 trading S&P Futures. My pre-market analysis spotted a potential breakout from the recent downtrend, with the only major resistance looming ahead at the 6890s. I set my plan to short that resistance and look for longs at the 5-minute MOB. Unfortunately, I was just a step too late on the long entry, and the market ripped higher without filling my order. It’s always frustrating to watch a planned move happen without you, but I stayed disciplined, took the small win on the shorts, and respected the bullish market structure.
📰 News Highlights
S&P 500 CLIMBS AS ONGOING AI-LED REBOUND PUSHES TECH HIGHER
🔔 VX Algo Signals
9:29 AM — MES Market Structure flipped bullish (X3) ✅ 11:20 AM — VXAlgo NQ X1DP Buy Signal ✅ 2:00 PM — VXAlgo ES X3 Sell Signal ✅
3 out of 3 signals worked — 100% accuracy today.
🔑 Key Levels for Tomorrow
Above 6925 = Bullish Below 6900 = Bearish

YEN CARRY TRADE LAST WAVE UP 5 of C of B CRASH SOON AFTERThe chart of the yen carry trade The reason for the coming CRASH in world markets for 2026 . Best of trades WAVETIMER !

Santa Rally / V-Shaped Recovery WatchNASDAQ:QQQ continues to respect the 50 & 100 DMA, just like every selloff since July. Momentum indicators are exiting oversold territory, suggesting a familiar upside rotation.
AMEX:SPY confirms.
AMEX:IWM remains structurally bullish on the monthly (cup & handle).
CRYPTOCAP:BTC shows classic oversold mean reversion behavior.
Key risk: loss of 100 DMA.
Bias: upside continuation while support holds.

ES (SPX. SPY) Analysis, Levels, Setups for Fri (Dec 19th)News + schedule
BoJ delivered a 25 bp hike to 0.75% - this can keep early-session volatility elevated via yen/carry-trade unwind and rate moves.
10:00AM Existing Home Sales (Nov), 10:00AM Michigan Consumer Sentiment (final).
ES is currently bracketed by a solid support level between 6820 and 6824 and a formidable resistance zone ranging from 6863 to 6872. Until either side manages to establish dominance with a convincing 15-minute close outside these boundaries, we can anticipate continued fluctuations and volatility within the midpoint range of 6840 to 6855.
A++ Setup 1 - LONG (Sweep-reclaim at the bottom)
Trigger (15/5/1): 15m sweep under 6820.50-6823.50 and close back above 6823.50 - 5m holds above 6823 - 1m first pullback that holds.
Entry: 6824.00-6826.00
Hard SL: 6810.75
TP1: 6854.50
TP2: 6863.00
TP3: 6872.00
A++ Setup 2 - SHORT (Rejection from the cap)
Trigger (15/5/1): 15m push into 6863-6872 and close back below 6863 - 5m fails to reclaim 6863 - 1m lower-high entry.
Entry: 6860.50-6862.50
Hard SL: 6870.75
TP1: 6842.25
TP2: 6823.25
TP3: 6811.75
Good Luck !!!

$SPY & $SPX Scenarios — Friday, Dec 19, 2025🔮 AMEX:SPY & SP:SPX Scenarios — Friday, Dec 19, 2025 🔮
🌍 Market-Moving Headlines
• Housing + sentiment check: Existing home sales and consumer sentiment close out the week, offering a read on demand resilience after a heavy CPI and labor stretch.
• Light macro, positioning matters: With no inflation or labor surprises today, flows, OPEX dynamics, and technical levels take priority.
📊 Key Data & Events (ET)
10 00 AM
• Existing Home Sales (Nov): 4.1 million
• Consumer Sentiment, Final (Dec): 53.5
⚠️ Disclaimer: For informational use only — not financial advice.
📌 #SPY #SPX #markets #housing #consumer #trading #stocks

MASSIVE RALLY OR MASSIVE CRASH...In this video we will talk about if the markets are in store for a MASSIVE RALLY OR MASSIVE CRASH...
NASDAQ:QQQ AMEX:SPY AMEX:IWM

Santa Rally Setup: Why I Think Markets Rip Into 2026Santa Rally Setup: Why I Think Markets Rip Into 2026
Looking at NASDAQ:QQQ across 2H/D/W/M:
• 2H: breaking downtrend → measured move toward ~$640
• Daily: curling out of oversold + volume shelf suggests $621 magnet
• Weekly: divergence risk = key “line in the sand” (lose lows = pain train)
• Monthly: pullback still looks “normal” within broader uptrend
AMEX:IWM remains the most bullish: 4-year cup & handle breakout + retest behavior.
₿ CRYPTOCAP:BTC : oversold conditions, watching downside toward ~70k if weakness continues.
Not financial advice.
What are you watching: QQQ / SPY / IWM / BTC?

ES (SPX, SPY) Analysis, Key Levels, Setups for Thu (Dec 18)TOMORROW EVENT STACK (ET)
07:00 - Bank of England rate decision + statement
04:00 - Norges Bank rate decision (Norway)
08:15 - ECB policy statement release
08:30 - CPI (Nov) + Real Earnings (Nov)
08:30 - Initial Jobless Claims
08:30 - Philly Fed Manufacturing (Dec)
08:30 - ECB press conference begins (adds FX noise, CPI still dominates ES)
High-impact window: The peak whip risk occurs from 08:30 to 08:45 ET. After the market opens at 09:30, it often either continues the 08:30 trend or reverses back to fair value.
October CPI Release and Its Implications
The absence of the October CPI data from the Bureau of Labor Statistics (BLS) introduces significant complexity to the upcoming November CPI release. Notably, the November figures will omit certain one-month percent changes due to the missing October data. This gap is likely to lead to increased volatility in market reactions, as traders may rely more heavily on year-over-year comparisons and overarching narratives. It's important to emphasize that this presents a data-quality risk rather than a straightforward price forecast.
Current projections from Reuters indicate a CPI rise of 0.3% month-over-month, with a year-over-year increase of 3.1%. Additionally, core CPI is expected to mirror this 0.3% monthly change, while the year-over-year core figure is anticipated to remain at 3.0%. These benchmarks represent the market's baseline, and any significant deviation—either a miss or beat—could trigger a pronounced market reaction.
Navigating Market Dynamics: A Practical Guide for E-mini S&P Traders
- Hot Scenario: A core CPI increase of 0.4% or more, or any unexpected data that raises inflation concerns, is likely to drive yields upward. In this case, E-mini S&P futures may see selling pressure on initial rebounds, as traders react to renewed inflation fears and test support levels.
- Cool Scenario: Conversely, if the core CPI prints at 0.2% or below, or if there’s a clear downside surprise against expectations, we might witness a drop in yields. This scenario could facilitate a breakout for E-mini S&P futures, allowing for upward progression through resistance levels as shorts are squeezed.
- In-Line Scenario: The market may react chaotically to the initial news, but typically, direction stabilizes upon the first pullback following the 09:30 cash market open.
To ensure effective trading during the CPI release, adhere to the following guidelines:
1. Avoid initiating new positions in the final 60 seconds leading up to the 08:30 release.
2. Establish four key reference points: the high and low of the pre-CPI trading range (08:20-08:29) and the high and low resulting from the CPI spike (08:30-08:33). These levels frequently serve as pivotal points for price action during the first 30 to 90 minutes of trading post-release.
By keeping these dynamics in mind, traders can better navigate the potentially tumultuous waters of the upcoming CPI announcement.
Market Analysis: Short-Term Outlook
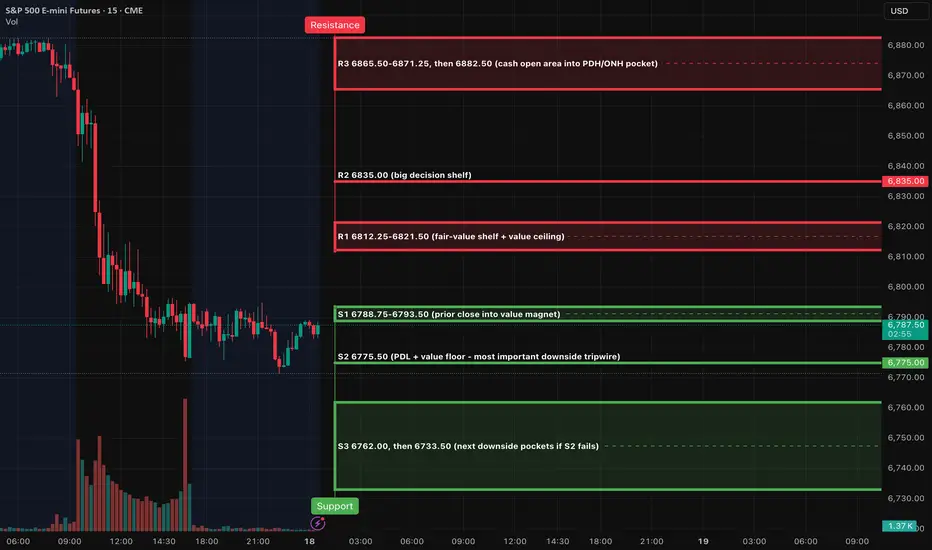
In the broader context, the recent trading action suggests a failure to maintain momentum after reaching the upper resistance band. The most recent price structure indicates a downward trend, with the market currently trading below key resistance levels. For upcoming sessions, this is critical; any attempts at upward movement will need to overcome the 6821-6835 range to signify a genuine reversal rather than mere corrective action.
On the 4-hour timeframe, we observe a distinct sell-off followed by a consolidation phase. There are several resistance zones left untested from the recent decline, which could hinder any potential rallies. The immediate resistance is located between 6812 and 6821, with a higher barrier at 6835. Should the price exceed 6835, it might have the potential to rally toward the 6865-6882 range.
The 1-hour perspective reveals a classic pattern characterized by a sharp decline followed by a basing phase. Notably, trading volume surged during the sell-off before tapering as prices stabilized near the close. This dynamic sets the stage for either a rebound toward immediate resistance levels or a further decline if the established support fails.
The oscillator is currently in a deeply oversold position, registering in the low teens and beginning to show signs of a potential upward turn. This development suggests some bounce potential, although it does not guarantee a trend reversal on its own. A credible shift in trend will require the price to reclaim the R1 resistance and maintain levels above R2.
Overnight Market Outlook: NY Session Forecast
Base Case Scenario (Pre-CPI): Anticipate a period of rotational trading between support level S2 at 6775.50 and resistance range R1 at 6812-6821.
Bullish Scenario: Should the market hold at S2, a reclaim of R1 would be crucial. A successful transition of R2 (6835) from a resistance level to a support floor could propel prices toward R3 (6865-6871), with the potential to reach 6882.50 if bullish momentum remains strong.
Bearish Scenario: Conversely, if the market slips below S2 and fails to reclaim the 6775.50 level, we could see a decline towards S3 at 6762, with a further slide to 6733.50 if selling pressure intensifies.
A++ Setup 1 - Short Position (Rejection at Resistance Level 1)
Entry Criteria: Monitor the market for a minimum of 30 minutes. The ideal entry is between 6816.00 and 6821.00.
- Stop Loss (SL): 6838.00
- Take Profit (TP) Targets:
- TP1: 6775.50
- TP2: 6762.00
- TP3: 6733.50
**Invalidation Point:** The setup will be invalidated if price sustains above 6835.00.
A++ Setup 2 - Long Position (Continuation through Resistance Level 2)
Entry Criteria: Again, monitor for a duration of at least 30 minutes. The target entry range is between 6830.00 and 6836.00.
- Stop Loss (SL): 6818.50
- Take Profit (TP) Targets:
- TP1: 6871.25
- TP2: 6882.50
- TP3: 6936.25
Invalidation Point: The trade will be considered invalid if there is a decisive drop back below 6821.50 after the reclaim action.
Good Luck !!!
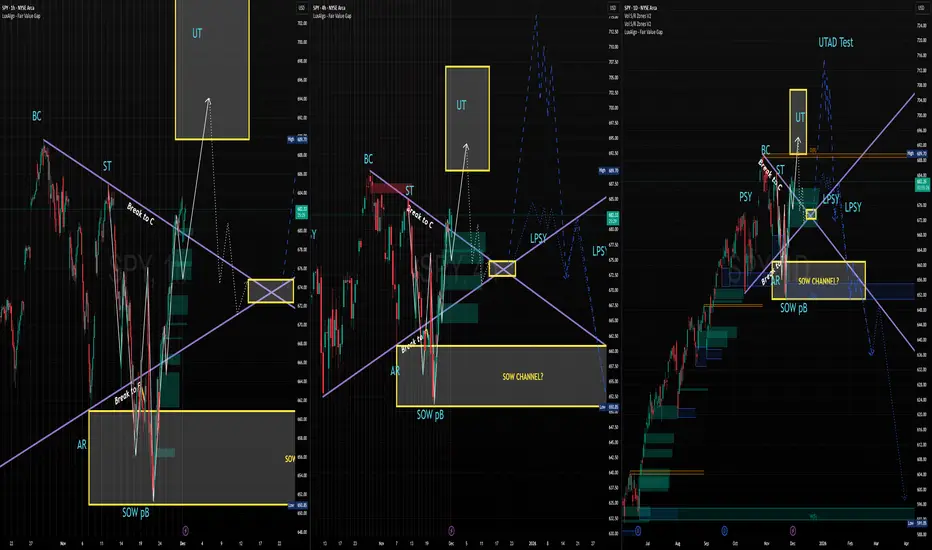
4H Long Term $SPY Wyckoff Distribution StructureThis idea is an updated and more simplified chart to show current structure that has build out on the 4H chart from the multi-timeframed chart I had in a previous idea -
As the title states, we have a Wyckoff distribution method/pattern in play here on the chart.
So far the set up and pattern has been pretty on-point if you take a look and analyze Wyckoff Methods from www.wyckoffanalytics.com
.
I don't have a ton of additional analysis to add here. I am only analyzing the chart and indicators I have. However, I'd love to hear some additional feedback for contrasting opinions or agreeing opinions for some confluence.
I'll add that two weeks later from the original idea, the structure, important support / resistance zones, and volume at those areas in the structure strengthens my opinions on validity of what is forming here.
This is still too early in the pattern / structure to play any moves based solely on this idea. In my opinion we are likely in the latter half of Phase B and this will take some patience to play out if you find conviction in it.
I am being patient and playing what the market gives me on an intra-day and intra-week basis while keeping this chart in the back of my mind.
I'm still early in my trading and TA journey (began January of this year) and I'm still learning but I thought I'd share an idea with the TV community that I have been keeping my eye on and trying to learn more about.
Thanks for your time and as stated in my other idea, it is always great to hear feedback for contrasting opinions or agreeing opinions for some confluence.

Long Term Wyckoff Distribution In-PlayAs the title states, we have a Wyckoff distribution method/pattern in play here on the chart.
So far the set up and pattern has been pretty on-point if you take a look and analyze Wyckoff Methods from www.wyckoffanalytics.com .
I don't have a ton of additional analysis to add here. I am only analyzing the chart and indicators I have. However, I'd love to hear some additional feedback for contrasting opinions or agreeing opinions for some confluence.
Have a great day TV gang and I hope you have a great December.
$SPY & $SPX Scenarios — Thursday, Dec 18, 2025🔮 AMEX:SPY & SP:SPX Scenarios — Thursday, Dec 18, 2025 🔮
🌍 Market-Moving Headlines
• 🚨 CPI Day — inflation is back in focus with November CPI and Core CPI printing together. This is the primary macro catalyst for rates, equities, and the dollar.
• 📉 Labor cooling check: Jobless claims add confirmation or pushback to the disinflation narrative.
• 🏭 Regional growth signal: Philly Fed survey gives a real-time read on manufacturing momentum into year-end.
📊 Key Data & Events (ET)
8 30 AM — Major Inflation Print
• Consumer Price Index, CPI (Nov): 0.3 percent
• CPI Year over Year: 3.1 percent
• Core CPI (Nov): 0.3 percent
• Core CPI Year over Year: 3.0 percent
• Initial Jobless Claims (Dec 13): 225,000
• Philadelphia Fed Manufacturing Index (Dec): 3.6
⚠️ Disclaimer: For informational use only — not financial advice.
📌 #SPY #SPX #CPI #inflation #macro #rates #markets #trading #stocks

$PLTR ShortInitially shorted
PLTR from 175s on 17th
Nov. Closed my position around 153 and bought back for a bounce around 155.
Medium term I am bearish on & PLTR, we can clearly see a failed high at around 209. If price wanted to stay bullish it should have consolidated or stayed above the previous high at around 189 but this to me is a trap price pushing above 189 and coming back down.
I have closed my longs here and will be looking for LH now, might even go to 185 around the 0.618 Flb level but nothing changes for me I will be looking for swing shorts.
Put this post earlier but it was restricted for some reason so posting it again now. Now the price has started to halt near the 0.618 level and we might get the down move now. Let’s see

ES (SPX, SPY) Analysis, Key Zones, Setups for Wed (Dec 17th)Market Update: ES Faces Critical Decision Point
The ES market is currently navigating a narrow “decision pocket” between 6850 and 6865, following a significant selloff and a subsequent bounce that has yet to establish a definitive trend. The situation is clear: buyers must defend the lower range of 6834 to 6817 to maintain market stability within this range. Conversely, sellers are focusing on the upper threshold between 6880 and 6892. With the Consumer Price Index report scheduled for release on Thursday morning, traders are likely to become more reactive, potentially taking profits swiftly and responding sensitively to any news regarding interest rates.
What can move ES tomorrow (high-impact catalysts, ET)
7:00 MBA Mortgage Applications - usually a modest mover, but it can nudge rates early.
8:15 Fed Governor Waller (Economic Outlook) - big rates sensitivity; ES can whip on any change in tone.
9:05 NY Fed President Williams - opening remarks at an NY Fed conference; still headline-capable.
10:30 EIA Weekly Petroleum Status Report - can move crude and inflation expectations, which can leak into ES.
11:00 Treasury buyback details (eligible bonds list) - rates pulse risk.
1:00 20Y Treasury auction (competitive bids) - one of the bigger intraday “rates steering wheel” moments.
1:40-2:00 Treasury buyback operation window - can add another yields swing in the early afternoon.
Macro and News Themes to Watch Ahead of Tomorrow’s Market
In the current environment, interest rates are proving to be the primary driver of market dynamics. Any increase in long-term yields exerts downward pressure on the equity markets, particularly when key indices like the S&P 500 are hovering near critical resistance levels.
The Federal Reserve's messaging remains notably inconsistent. While some officials are emphasizing the importance of maintaining inflation credibility and adopting a cautious stance towards future rate cuts, others suggest that monetary policy is already positioned effectively and anticipate a gradual cooling of inflation. This divergence creates a volatile atmosphere, leading to heightened market reactions surrounding Fed speeches.
On the geopolitical front, oil prices are responding to ongoing developments, particularly concerning Venezuela, which has raised supply-risk concerns. This uptick in crude prices has the potential to reinforce inflation narratives and influence equity market sentiment.
Additionally, the looming Bank of Japan (BOJ) meeting, where a rate hike is expected, adds another layer of complexity. Even ahead of this anticipated move, shifts in foreign exchange and global rates could significantly impact U.S. index futures and overall market positioning.
Overnight NY Market Forecast
Base Case Scenario: The market is expected to trade within a range of 6832.75 to 6880.50. Watch for potential retracements towards the 6849.00-6849.75 level, which appears to be a pivotal support point.
Bullish Scenario: Should the index manage to sustain a position above 6880.50, a decisive break above 6892.00 would likely drive prices towards 6936.25, a key resistance level.
Bearish Scenario: Conversely, a confirmed drop below 6817.50 would pave the way for a test of 6800.00 initially. If sellers maintain their grip on the market, further declines to 6767.75 and 6733.75 may follow.
A++ Setup 1 (Rejection Fade short from the upper shelf)
Entry: 6887.00-6891.75
Hard SL: 6896.25
TP1: 6863.50
TP2: 6849.75
TP3: 6834.50
A++ Setup 2 (Acceptance Continuation short under PDL)
Entry: 6814.50-6817.25
Hard SL: 6823.75
TP1: 6800.00
TP2: 6767.75
TP3: 6733.75
Good Luck !!!

$SPY & $SPX Scenarios — Wednesday, Dec 17, 2025🔮 AMEX:SPY & SP:SPX Scenarios — Wednesday, Dec 17, 2025 🔮
🌍 Market-Moving Headlines
• Very light macro day: No major inflation, labor, or growth data scheduled.
• Post-data digestion: Markets continue to digest Tuesday’s delayed jobs, retail sales, and PMI releases.
• Fed speakers are secondary: With CPI and employment already out, commentary matters only if tone shifts meaningfully.
📊 Key Data & Events (ET)
• No top-tier economic data scheduled
⚠️ Disclaimer: For informational use only — not financial advice.
📌 #SPY #SPX #markets #trading #macro #stocks

Opening (IRA): SPY January 30th 605/615/730/740 Iron Condor... for a 1.25 credit.
Comments: Structuring the setup such that the credit received is about 1/10th the width of the wings which results in the short option legs being at about their respective 10 delta strikes.
Metrics:
Max Profit: 1.25 ($125)
Max Loss/Buying Power Effect: 8.75 ($875)
ROC at Max: 14.28%
ROC at 50% Max: 7.14%
Will generally look to adjust on side test or on side approaching worthless. Am looking to take profit at .25, resulting in a 1.00 ($100) realized gain.

Bearish Pendant SPX BE CAREFULNot financial advice dont hold a license you have an inverse head and shoulders on a micro time frame inside of a bearish pendant I would like to see 6750 swept before end of day dont get caught in the chop

SPX to 6792Its hard to see on a 30 minute chart but you created your inverse head and shoulders and you are forming your bull flag. Unless if invalidated and LOD breaks your heading up here EMA's are slightly pointing up. Pay attention to the clue's

Run with $NKEOne of those set it and forget it charts.
Patience needed as this is a weekly chart, but i expect a break upward of the failling wedge within a month and a rapid acceleration with a few pullbacks after each target is reached.
$79, 98, and 121 targets over the next 8 months.

ES (SPX, SPY) Analyses, Key Levels, Setups for Tue (Dec 16th)
As we head into Tuesday, ES is showing signs of structural weakness following a significant sell-off, culminating in a late dip into the 6845-6840 demand zone. The prevailing trend appears to be downward as long as prices remain beneath the resistance range of 6863-6874. However, the 6845-6840 support still has the potential to trigger a rebound. Traders should anticipate the most decisive price action around major data releases, followed by a phased, level-to-level approach in trading strategy.
EVENTS THAT CAN MOVE ES (ET)
2:00am UK labor data
3:15am-5:00am Eurozone PMI batch + ZEW sentiment window
8:30am US jobs data bundle + Retail Sales + Earnings + Unemployment
9:45am US Flash PMI
10:00am Business Inventories
4:30pm API oil stats (can hit energy tone into the close)
Market Outlook: NY Session Forecast
In the upcoming New York trading session, we anticipate a period of consolidation likely to include a modest rebound attempt. However, this upside movement is expected to face resistance within the range of 6859 and 6863-6874. Should sellers maintain pressure and keep prices below 6863 as we head into the session, we could see a subsequent pullback towards the 6845-6840 range, followed by a potential drop to 6825.
On the bullish side, if the market can decisively reclaim and sustain levels above 6874, we might open the door for a rally towards 6902 and possibly 6923.
Conversely, a clear breach below 6840 that lacks immediate recovery signals strengthens the bearish outlook, targeting 6825 initially, with the potential for a further decline to 6800-6790.
ES Short (A++) - Sell 6863-6874 - SL 6876.50 - TP1 6845-6840 TP2 6825 TP3 6800-6790
Key zones
Support - 6845-6840, 6825, 6800-6790
Resistance - 6851-6859, 6863-6874, 6902, 6923-6936
A++ Setup 1 - Short (ceiling fade)
Entry - Sell 6863-6866 after a rejection from 6863-6874
Stop - 6876.50 (above the rejection high)
TP1 - 6845-6840
TP2 - 6825
TP3 - 6800-6790
ES Long (A++) - Buy 6825 reclaim - SL 6814.25 - TP1 6863 TP2 6902 TP3 6923
A++ Setup 2 - Long (flush then reclaim)
Entry - Buy 6825-6828 only after price reclaims and holds above 6825
Stop - 6814.25 (below the flush low)
TP1 - 6863
TP2 - 6902
TP3 - 6923
Good Luck !!!
