SPY DEMAND LEVEL BELOW|LONG|
✅SPY tapped into the demand level and printed bullish reaction wicks, signaling a short-term rebound toward 678$. Liquidity above minor highs could be targeted. Time Frame 2H.
LONG🚀
✅Like and subscribe to never miss a new idea!✅
SPDR S&P 500 ETF (SPY)

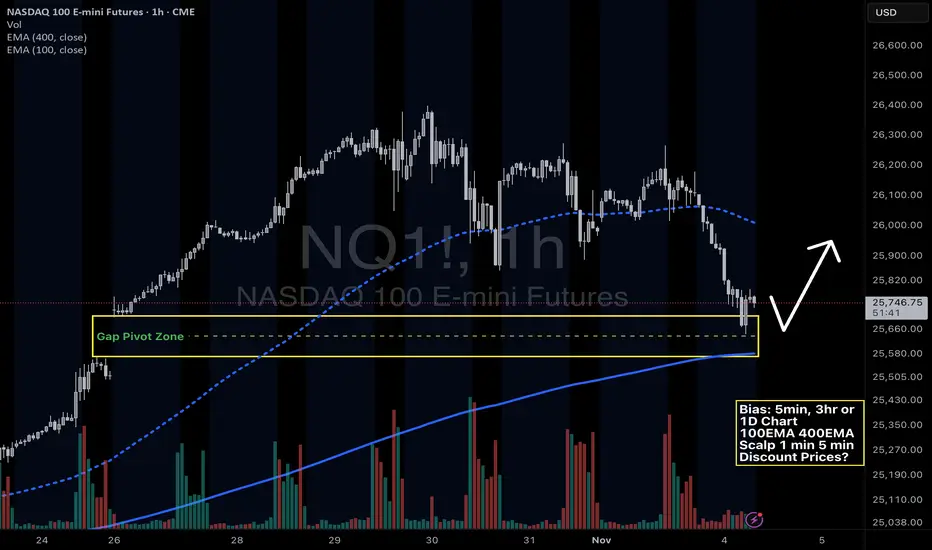
Nasdaq NQ - tapping into previous Gap Pivot ZoneNQ -Nasdaq Futures- pulled all the way back to the previous Gap up zone from October 26, 2025. Also, confluence with the 1 hour 400 EMA. Does this signal a bounce opportunity? Or does this signal that there will be a major news event that will occur? Is the market predictive of real life?
Day 61 — Trading Only S&P Futures | Focused on the Grand CupRecap & Trades
Day 61 — I shifted focus entirely to the Tradeify Grand Cup tourney account.
Instead of trading multiple accounts, I traded larger — up to 2 ES contracts — and kept everything clean and simple.
The morning structure was bearish, so I shorted early and caught 20–30 point moves before flipping at 10:40 for the reversal.
Throughout the day, I played structure and gamma zones just like we do inside the VX Algo system.
Lesson & Mindset
Sometimes, focus beats multitasking.
Trading one account with intention often leads to better results than juggling multiple screens.
And when you scale up, you realize that discipline matters more than direction.
News & Levels
Big takeaway from today — Fed’s Daly said the October rate cut was appropriate and they’ll keep an open mind for December.
That kind of language tells us the Fed is keeping optionality alive.
Tomorrow’s levels: Above 6910 bullish, below 6893 bearish.

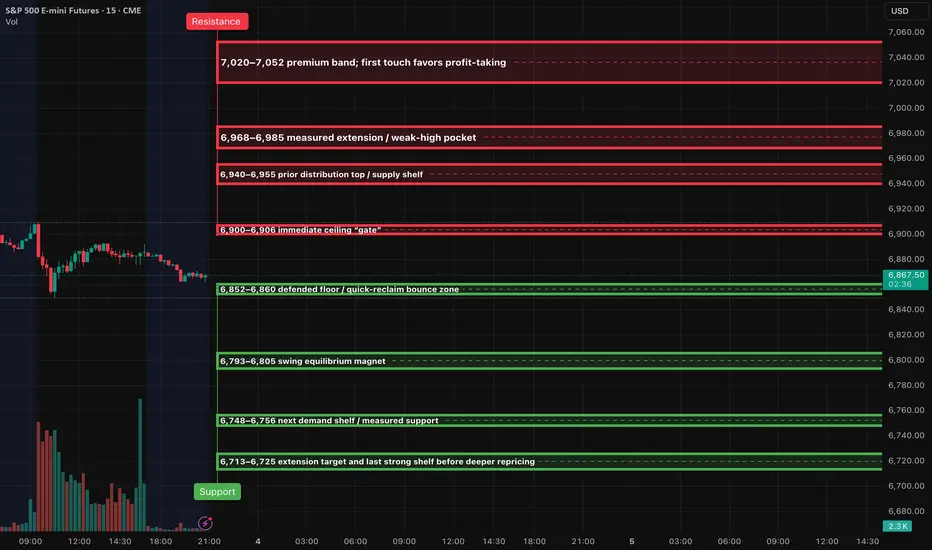
ES (SPX, SPY) Analysis, Key Zones, Setups for Tue (Nov 4th)Bias & context
Range-to-slightly-bearish intraday while price remains capped under 6,900–6,906. A clean 15m body close above that “gate” shifts bias to the upside toward 6,940→6,985. Lose 6,852–6,860 on a 15m body-through and the path opens to 6,805→6,756.
The key levels remain unchanged.
Setups (15m→5m→1m)
Rejection Fade at 6,900–6,906: tag and 15m close back below → use the first 5m re-close lower and enter short on the 1m pullback; TP1 = 6,860, TP2 = 6,805, TP3 = 6,756; hard SL = 15m wick high +0.50.
Acceptance Continuation through 6,906: 15m full-body close above → buy the 5m pullback that holds; TP1 = 6,940–6,955, TP2 = 6,968–6,985; invalidation = a 15m close back inside ≤6,900.
Quick-Reclaim Bounce at 6,852–6,860: sweep and instant reclaim → long back toward 6,900 “gate”; if the reclaim fails, stand aside and wait for the body-through short.
Exhaustion Flush Bounce at 6,748–6,756: only on a fast flush; first-touch responsive long back to 6,793–6,805; invalidate on a decisive 15m body-through below 6,748.
Kill-zones (ET)
NY AM 09:30–11:00 primary execution window; NY PM 13:30–16:00 continuation / reversal window.
Calendar & shutdown check
JOLTS (Sep) is scheduled for Tue, Nov 4 at 10:00 ET, but BLS warns releases may be delayed during the shutdown. Treat this as tentative.
ADP National Employment Report (Oct) is Wed, Nov 5 at 08:15 ET and is unaffected (private release).
ISM Services PMI (Oct) is Wed, Nov 5 at 10:00 ET and is unaffected (private release).
Census/Commerce releases on Tue (Trade Balance, Factory Orders) are on the calendar, but federal data dissemination is paused under the shutdown; expect postponements.
Major earnings Tue, Nov 4 (pre-market) include SHOP, UBER, PFE, SPOT, ETN, RACE, APO, MAR, TRI, ZTS, MPC, MPLX.
Management:
Instruction notes: only take plays where TP1 ≥ 2.0R using the 15m-wick stop. At TP1 close 70% and park 30% at BE; runner aims the next level. No trailing before TP2. Max 2 attempts per level per session.
$SPY $SPX Scenarios — Tuesday, Nov 4, 2025🔮 AMEX:SPY SP:SPX Scenarios — Tuesday, Nov 4, 2025 🔮
🌍 Market-Moving Headlines
🚩 Jobs data on deck: Tuesday’s focus is on labor demand — the JOLTS report remains a key barometer for wage pressure, though it may not print due to the shutdown.
⚠️ Data blackout continues: The Trade Balance and Factory Orders are both delayed government releases, keeping markets dependent on Fed tone and price action.
💬 Fed-speak pre-jobs: Vice Chair Bowman’s early-morning remarks will frame policy bias ahead of ADP and Friday’s NFP.
💻 Volatility compression: With few confirmed reports, traders watch AMEX:SPY ’s range behavior and TVC:VIX positioning before the labor-data surge mid-week.
📊 Key Data and Events (ET)
⏰ 6:35 AM — Michelle Bowman (Fed Vice Chair) speech
⏰ ⚠️ 8:30 AM — U.S. Trade Deficit (Sept) — may not print
⏰ ⚠️ 10:00 AM — Factory Orders (Sept) — may not print
⏰ ⚠️ 10:00 AM — Job Openings (JOLTS, Sept) — may not print
⚠️ Note:
All three macro reports are subject to delay under the continuing government shutdown. Expect headline-driven trading and low data-volume volatility until Wednesday’s ADP and ISM Services releases.
⚠️ Disclaimer: Educational and informational only — not financial advice.
📌 #trading #stockmarket #SPY #SPX #Fed #Bowman #JOLTS #TradeBalance #FactoryOrders #bonds #yields #economy #shutdown #macro

My work and projection take notice The chart posted is something I post as I feel major events or turns .I have Not needed to alt this chart since we have evolved in the pattern As you notice the next projection in the 6900 ;s zone notice the BB band s . and be ready !

$GEV Technical and Position UpdateNYSE:GEV Support and Trading Strategy Overview
Earnings and Revenue Performance
On October 22nd, NYSE:GEV missed earnings expectations. However, despite the miss, the company's earnings still grew by 368%. Additionally, revenue rose by 11.8% during the same period.
Support Area and Technical Indicators
An important area of support has been identified in the current price action for $GEV. The stock has remained above this support level for the past two trading days. Technically, NYSE:GEV has also regained its 5-day and 10-day moving averages (DMA) and is presently trading just below the 20-day exponential moving average (EMA).
Position Initiation and Risk Management
A half-size position was initiated at $587. A price alert is set on the horizontal support area, which is being monitored as a potential point to close the position if necessary. The actual stop is placed below the most recent low recorded on October 28th, at $565.00. Both the horizontal support area and the recent low represent attractive risk-reward levels aligned with the trading style being used.
Potential Position Additions
If the price manages to move above the 20-day EMA, there are plans to add to the existing position.
Important Disclaimer
Readers are encouraged to independently analyze this trading idea and strictly follow their own trading rules. It is important to remember that all investments carry risk. Making informed decisions with your own capital is essential.

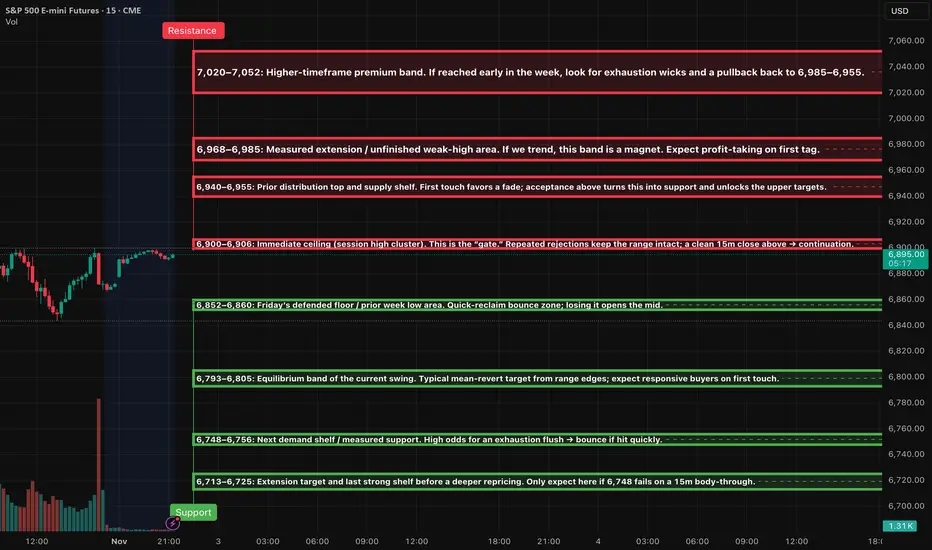
ES (SPX, SPY) Week Ahead Analysis, Nov 3rd - Nov 7thMarket Context
The price is currently positioned just below a key near-term resistance level at 6,900–6,906, following a sharp reversal on Friday from around 6,845. The daily and 4-hour structures indicate an incomplete "weak-high" area above, but the 1-hour momentum has just shifted upward from oversold conditions. As we move into the Asia/London sessions, I anticipate a balance formation within the upper half of the previous session unless we see a decisive 15-minute close above 6,906.
Short — Rejection Fade at 6,900–6,906
Trigger: 15m rejection close back below the band → 5m re-close down with a lower high → 1m first pullback fail.
SL: Above the 15m wick high +0.25–0.50.
TP1: 6,880 → 6,860 (≥2.0R gate). TP2: 6,805.
Notes: If a retest holds below 6,900, add on a fresh 1m LH.
Short — Rejection Fade at 6,940–6,955
Trigger: Same 15m→5m→1m sequence as above.
SL: Above the band’s 15m wick +0.25–0.50.
TP1: 6,900 gate; TP2: 6,880–6,860; stretch TP3: 6,805.
Long — Acceptance Continuation above 6,906
Trigger: 15m full-body close above 6,906 → 5m pullback holds and re-closes up → 1m HL entry.
SL: 5m pullback low −0.25–0.50.
TP1: 6,940–6,955; TP2: 6,968–6,985; stretch TP3: 7,020–7,052.
Notes: If 6,906 holds as support on retest, consider scaling on a clean 1m HL.
Long — Quick-Reclaim Bounce at 6,852–6,860
Trigger: Sweep/flush below the band and instant reclaim (1–3m), confirmed by a 5m re-close up → 1m HL entry.
SL: Below the sweep low −0.25–0.50.
TP1: 6,900 gate; TP2: 6,940–6,955.
Long — Quick-Reclaim Bounce at 6,793–6,805
Trigger: Same reclaim logic; prefer fast tag → quick pop.
SL: Below the 5m reclaim low −0.25–0.50.
TP1: 6,860; TP2: 6,900; optional TP3: 6,940.
Long — Exhaustion Flush Bounce at 6,748–6,756 (stretch 6,713–6,725)
Trigger: Fast liquidation into the band + momentum divergence → 5m reversal close → 1m HL entry.
SL: Below the exhaustion low −0.25–0.50.
TP1: 6,793–6,805; TP2: 6,860; trail only after TP2.
Short — Continuation Below 6,852
Trigger: 15m body-through below 6,852 that holds on retest → 5m LH → 1m pullback entry.
SL: Above the 15m break wick +0.25–0.50.
TP1: 6,805; TP2: 6,756; stretch TP3: 6,725.
KILL-ZONES & EXECUTION NOTES
Primary execution windows: NY AM 09:30–11:00 and NY PM 13:30–16:00. London 02:00–05:00 optional, reduced size. Asia optional, smallest size.
Stops & viability: Anchor hard SLs to the relevant 15m wick; only take plays where TP1 ≥ 2.0R. Max two attempts per level per session. At TP1: close 70%, set 30% runner to BE; no trailing before TP2.
WEEK AHEAD GAME PLAN
If Monday holds above 6,860 and forms a higher low, the outlook is modestly bullish, aiming for a move toward 6,940–6,955 early to mid-week. A decisive daily close above 6,955 would suggest a rally into the 6,968–6,985 range, with the potential to extend further to 7,020–7,052 later in the week.
Conversely, if the price falls back below 6,852, the scenario shifts to a mean-reversion week, targeting 6,805 and then 6,756, with 6,713 as a potential stretch target.
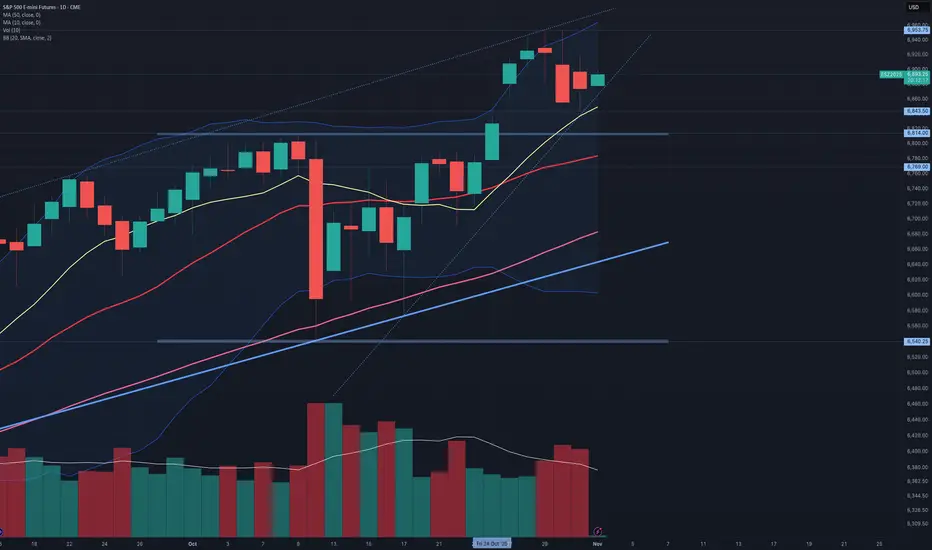
$ES_F $SPX $SPY: The song remains the same This song remains the same, at least during Globex. Several bearish weekly candlesticks, including those for $ES_F, SP:SPX , and AMEX:SPY so far, are not hindering the intense chasing buying pressure. The uptrend remains intact as long as the 10-day simple moving average continues to provide support. The recent weekly Doji could indicate a possible pullback if today's closing price falls below 6843. It's important to note that the volume did not support the breakout above the resistance level at 6814 on October 25, resulting in a new ATH. In contrast, there was a higher volume on Thursday and Friday, both of which closed with red candlesticks. Additionally, the average volume over the past two weeks has been decreasing.
$SPY $SPX Scenarios — Week of Nov 3 → Nov 7, 2025🔮 AMEX:SPY SP:SPX Scenarios — Week of Nov 3 → Nov 7, 2025 🔮
🌍 Market-Moving Headlines
🚩 Post-FOMC digestion: After Powell’s Oct 29 presser, traders watch whether yields and the dollar cool or extend higher.
📈 Labor-week spotlight: Friday’s Jobs Report (NFP, wages, unemployment) anchors the week — rate-path odds hinge on those prints.
💬 Fed tone in focus: Multiple governors and regional presidents hit the circuit after the FOMC — every nuance matters for December guidance.
⚠️ Shutdown watch: Several BEA and Census releases (Factory Orders, Trade Balance, GDP components) may not print on time if the government remains partially shuttered.
💻 Earnings taper off: Final big-cap names and sector leaders wrap Q3 results, shaping sentiment into mid-November.
📊 Key Data and Events (ET)
Mon Nov 3
⏰ ⚠️ 8:30 AM — Durable Goods Orders (Sept) | Ex-transportation subset — BEA report; possible delay
⏰ 10:00 AM — Factory Orders (Sept) ⚠️ possible delay
Tue Nov 4
⏰ 9:00 AM — S&P Case-Shiller Home Price Index (Aug)
⏰ 10:00 AM — Consumer Confidence (Oct) 🚩
Wed Nov 5
⏰ ⚠️ 8:30 AM — Advanced Trade Balance in Goods (Sept) | Retail and Wholesale Inventories — Census; may be delayed
⏰ 10:00 AM — Pending Home Sales (Sept)
⏰ 🚩 2:00 PM — FOMC Rate Decision
⏰ 🚩 2:30 PM — Fed Chair Powell Press Conference
Thu Nov 6
⏰ 🚩 8:30 AM — Initial Jobless Claims (Oct 25) expected on schedule
⏰ 🚩 8:30 AM — GDP (Q3, Advance) ⚠️ BEA data; delay possible
⏰ 9:55 AM — Fed Vice Chair Michelle Bowman speaks
Fri Nov 7
⏰ 🚩 8:30 AM — PCE and Core PCE (Sept) along with Personal Income, Spending, and Employment Cost Index ⚠️ BEA risk
⏰ 9:45 AM — Chicago PMI (Oct)
⏰ 12:00 PM — Cleveland Fed President Hammack and Atlanta Fed President Bostic remarks
⚠️ Note:
Shutdown risk applies to BEA and Census releases marked with ⚠️
Confirmed live data include Jobless Claims, FOMC decisions, and Fed speeches — these will drive most of the week’s price action.
Friday’s PCE print (if released) remains the key inflation gauge.
⚠️ Disclaimer: Educational and informational only — not financial advice.
📌 #trading #stockmarket #SPY #SPX #Fed #Powell #FOMC #PCE #GDP #JoblessClaims #inflation #bonds #yields #economy #macro

S&P 500 (ES1!): Bullish! Buy This Dip!Welcome back to the Weekly Forex Forecast for the week of Nov. 3 - 7th.
In this video, we will analyze the following FX market: S&P 500 (ES1!)
The S&P500 is bullish, and buys are valid.
Price is currently in a +FVG, so looking for sells is prohibited!
If the +FVG fails, only then will buys become invalid.
Enjoy!
May profits be upon you.
Leave any questions or comments in the comment section.
I appreciate any feedback from my viewers!
Like and/or subscribe if you want more accurate analysis.
Thank you so much!
Disclaimer:
I do not provide personal investment advice and I am not a qualified licensed investment advisor.
All information found here, including any ideas, opinions, views, predictions, forecasts, commentaries, suggestions, expressed or implied herein, are for informational, entertainment or educational purposes only and should not be construed as personal investment advice. While the information provided is believed to be accurate, it may include errors or inaccuracies.
I will not and cannot be held liable for any actions you take as a result of anything you read here.
Conduct your own due diligence, or consult a licensed financial advisor or broker before making any and all investment decisions. Any investments, trades, speculations, or decisions made on the basis of any information found on this channel, expressed or implied herein, are committed at your own risk, financial or otherwise.

LightWhenever I prepare an idea to publish, well... I don't prepare.
As you may already have realized, my "blog" is not about trading / investment analysis. It is an attempt of mine to describe the indescribable. To smell the un-smellable (like a Greek song said).
My first ideas were an attempt of mine to reach out to others to spark conversation.I wasn't trying to give out any meaningful insight, because I had none. Now I think I have information to share, but Socrates would not agree with me, he is certain that he knows nothing . Since I cannot / don't want to be like Socrates, I will be like Diogenes the Cynic, I like him more... His views on philosophy and the world have grown on me.
And speaking of grown...
Apple has grown. From a seed of a Macintosh in a wooden box, into to a computer that would destroy Orwell's 1984, and then to a pair of smart glasses that would become the dystopia they tried to avoid.
Traders have also grown, most only in their age and appetite. The minds stood still.
And prices have grown higher and higher, but lighter than ever before.
Many analysts develop indicators in reverse. They want profit and shape indicators in a way to satisfy this growing appetite. The appetite of the man who isn't satisfied with the few, cannot be satisfied with the many. I have done this myself in the past.
There are two ways this chart is misleading.
First: Price on top of Bollinger Band can be interpreted as a "strong push", and at the same time an "overextended price". The indicator by itself is not misleading. It is us who don't analyze it properly.
Second: While this indicator calculates a statistical deviation (a pure mathematical idea), it fails in the act. Statistical deviation of trending prices cannot be calculated with ordinary moving averages. Don't listen to me, listen to the scientists from whom I found this, research it yourselves. A secondary problem is log scale.
A portion of traders, whom I call gamblers have grown light minded, it seems. They don't want prices to ... slide backward into oblivion, just as (we / they) have finally begun to see the light.
And just like gamblers, lighter my charts have apparently become. I simply try to shed some light into the darkness of technological / artificially untelligent societies.
Since my publications of indicators have been buried in the darkness, now it is time for them to shine, in simple terms.
And so, fixing analysis needs many steps. I show again the original statistical band:
Our data lives in a log-scaled world of increasing proportions, not increasing amounts. So, we re-shape our/Bollinger's mathematics to survive in this wild world of massive numbers. We then conclude to the log-scaled band:
One of the major problems however has not been fixed. Mathematicians dictate that classical moving averages don't apply in "Time Series Data" i.e. price history. Statistics don't work in trending data.
To fix this issue I have constructed a simplified MA model and applied it in multi-timeframe price data using PineScript.
The MA-Model is not a moving average (it doesn't describe an average price). It is instead one of the infinite trend-nullifying lines, from the base of which statistics are calculated. The band is the same 2-sigma area like the classic Bollinger.
What is the conclusion of this chaotic story, I hear you say...
It is either too simple or too complex.
The simple explanation is that history repeats itself.
Going back to 1998, we see the following:
Price divergences have become apparent from statistics. On the first arrow of each one, price reaches a 2-sigma deviation. On the second arrow of each divergence, price fails to make a second deviation jump, price instead returns to mean.
It is as if prices move in two steps. First they define a trend from a 2-sigma event (either bullish / bearish), then they follow up on the trend, while reverting to mean.
Now in 2025, in a larger timeframe, Apple seems to crave bitter sweets.
The 1998-2000 bubble is dwarfed from this massive chart.
Apple has done it. From the bottom of the world and a sub 1% market share, to conquer the world. It is the most loved brand. Sells the most popular smartphone. Designs the most powerful chips. Shapes future trends. And ironically, this very idea is typed on a modern Apple device.
You have reached the top, when everyone is sure that you will live forever.
And I mean everyone, including me who hypocritically votes against them.
The drop will come when a single person changes their mind.
Be wise. Be safe. Be aware.
-Breen
P.S. I will follow up this idea with some interesting charts on SPX in the following days.

SPY 30 minute outlook for 3 to 7 NovemberThe most important thing first
Only trade at the map levels. For this week that list is short. 678, 682, 685, 690, and the gap zone 671 to 672. Everything else is noise until price reaches one of these spots. Your job is to listen for acceptance or rejection at the level, then act with a small number of simple rules.
Why this matters this week
The last print on Friday was near 682. Buyers defended higher lows for two weeks, yet supply still lurks above 685. This creates a tight battlefield where patience has an edge. We also walk into a week with event windows that can move liquidity at specific times. That makes a level based plan far more useful than chasing mid range impulses.
The map you can trade
Place these levels on a clean thirty minute chart. No indicators are required for the core read.
700 round number magnet. Respect the gravity if price runs
690 first upside checkpoint above the band
685 first breakout gate. Acceptance here often pulls price into 690
682 pivot around Friday close. That is the middle of the week map
678 first support inside balance
671 to 672 open gap zone from late October
665 next shelf under the gap
661 to 662 fifty day context on the daily, not a trigger but important reference
Mark a simple session based VWAP if you like, only as a way to define impulse and pullback structure. If VWAP pins near 682 during cash hours, treat that as the intraday axle.
Catalysts to respect
Write the event times directly on your chart. Private payrolls, the two ISM prints, and Treasury supply updates are the likely spark plugs. The idea is not to predict the number. The idea is to protect your risk into the time stamp and let the reaction tell you when to press or stand down. Most reactions that stick will retest a level. That is the entry you want.
Three rules for entries and exits
Keep it simple. You need only three.
Break and hold
Above 685 for fifteen minutes, buy the first pullback that holds the breakout line. Use the impulse low as your stop. First target 690. If momentum stays firm, trail under higher swing lows and let the tape pull you toward 700. If the retest under 685 appears, stand aside and wait for a clean reclaim before trying again.
Reject and rotate
If price rejects 685 early and bleeds back under 682, fade pushes back into 682 only when the tape is balanced and liquidity is thick. First target the other edge at 678. Second target is a test of the 671 to 672 gap zone. Cut the idea if a higher low forms above 682 and buyers reclaim the pivot.
Explore and revert
If 678 breaks and fails to reclaim, let price explore 671 to 672. Two ways to trade it. Either do nothing and stalk reversal structure inside the gap zone, or short failed bounces that cannot get back above 678 with a target at the top of the gap. In both cases the invalidation is a fast reclaim of 682 with improving tape.
How to size and manage
Define one Discipline unit for the week. That is your full risk per idea
Use one half unit when you trade against the outer edge of the weekly options expected move. At Monday open write the current expected move upper and lower bounds on your chart and treat them as fences for scaling
Take partials into logical magnets. Into 690 from a 685 break. Into 678 from a 682 rejection. Into 671 to 672 after a 678 failure. The objective is to convert risk into house money early, then trail with intent
What to watch intraday
A breadth or depth improvement during a 685 reclaim. That is usually the cleanest long of the day. You will see it in tape speed and order book thickness rather than in oscillators
A stall near 690 with lower highs on five minute bars. That is usually the place to stop pressing longs and to hand the rest of the work to the trail
A false break under 678 that immediately rips back through 682. That is the place to flip your bias for a rotation toward 685 again
Scenarios in plain language
Trend continuation
If buyers clear 685 and hold it on the retest, the path of least resistance is higher. Aim for a measured push into 690. If the tape is squeezing and liquidity stays supportive you can keep a runner for a look at 700. The evidence you need is simple. Higher lows on five and ten minute bars and no heavy selling into the bid.
Range rotation
If we reject 685 early, expect a ping pong week between 678 and 685 with a pivot near 682. You fade the edge only when the tape is calm. You do not fade when a data release has just hit, because the first reaction can keep running.
Pullback to value
If 678 gives way and cannot reclaim, let it go. The highest quality buy zone is down near 671 to 672 where trapped shorts may cover. The first long is often the retest that holds the top of the gap and prints a higher low on five minute bars.
Risk and discipline
Cut losers fast at the level, not in the middle of the range
Never widen stops during event minutes
Do not add size mid range. Add only at the level after confirmation
If you take three trades and all three fail to hold structure, step away for an hour. That reset often saves the day
Closing note
You do not need ten indicators and a dozen opinions this week. You need five levels, three rules, and one risk unit. Write them down. Trade only when price comes to you. Let the market do the heavy lifting.
Reminder
Education and analytics only. No advice. No guarantees. Process beats prediction.

SPY BEARS ARE STRONG HERE|SHORT
SPY SIGNAL
Trade Direction: short
Entry Level: 681.87
Target Level: 650.12
Stop Loss: 702.99
RISK PROFILE
Risk level: medium
Suggested risk: 1%
Timeframe: 9h
Disclosure: I am part of Trade Nation's Influencer program and receive a monthly fee for using their TradingView charts in my analysis.
✅LIKE AND COMMENT MY IDEAS✅

Agenda 89 --- the path to spy's next major topso I been rambling about agenda 89 and spy cycles for like ages. I also more or less blew my account up not listening to my own advice and my own levels. key thing here is market follows cycles. and no I am not willing to share the prior cycles. this here is for me more than anyone else.
I am not good with numbers so I had chatgpt do the calculations for me and the rationale made sense given my basic college math level knowledge. In fact the cycles that gpt calculated appeared to follow the same cycle rules that I used to detect the historical cycles. I have only 3 historical cycles detected. in recent times. reason being that since 2008 Aladdin took over the market and things changed. there is a certain year where it all did shift but for simplicity only data after 2008 matters because after that Aladdin by blackrock the mega algorithm managed all the trillions that move the market daily. it literally trades with itself. it's too huge to fail so I will not fight it. the cycles have also been shrinking in expansion per say. the next top is likley the last or second to last before some major black swans start happening. At least that's what aladdin has priced in. he knows more about you than yourself and
other notes is that the tops follow wycoff style, the expanded and got more volatile as they progressed and I plan to follow the same pattern in my projections. my projections are half lazy in terms of the tops/bottoms. it can really follow any wycoff. but of note, when all was noted and combined chatgpt described it as a wycoff schematic #1. even though when I typed the pattern that i saw in i labeled it as musical notes. I did not paint very well on chart because things in real life do not follow the textbook 1-1, point is, whipsaw and that's your range there more or less. I am not sure how to past an image here so just google it.
the rules and this is for me to not blow my account up anymore:
1- no timing the market, it dipped? good it can dip lower before tuning up. so expect the trades to be long. were looking at 13 dips before the top in febuary.
2- the numbers can be off slightly. I'm no picasso, can;t time or paint the market. levels evolve and change with time. the range wont change though.
3- the true top is likley a tuesday or a wednesday since historically it was those days so extra bias for them
4- no greed
5- yes this will chop until next year mid febuary - do not blow up. RANGE BOUND.
I'm expecting possibilities of up to 720-730 for the top on spy since that would be two full cycles in geometry which would make sense assuming the prior 3 were 90 degrees each. hence a strong belief of mine that this may be the last market cycle aladdin is pricing in before doomsday events. Aladdin probably knows when WW3 will start before the guys launching the nukes know it will start and has been pricing it in since it took over the markets. that thing is a monster beyond comprehension.

Stock Market Forecast | TSLA NVDA AAPL AMZN META MSFTStock Market Forecast | CME_MINI:NQ1! CME_MINI:ES1! NASDAQ:NDX SP:SPX
Mag 7 | TSLA NVDA AAPL AMZN META MSFT GOOGL

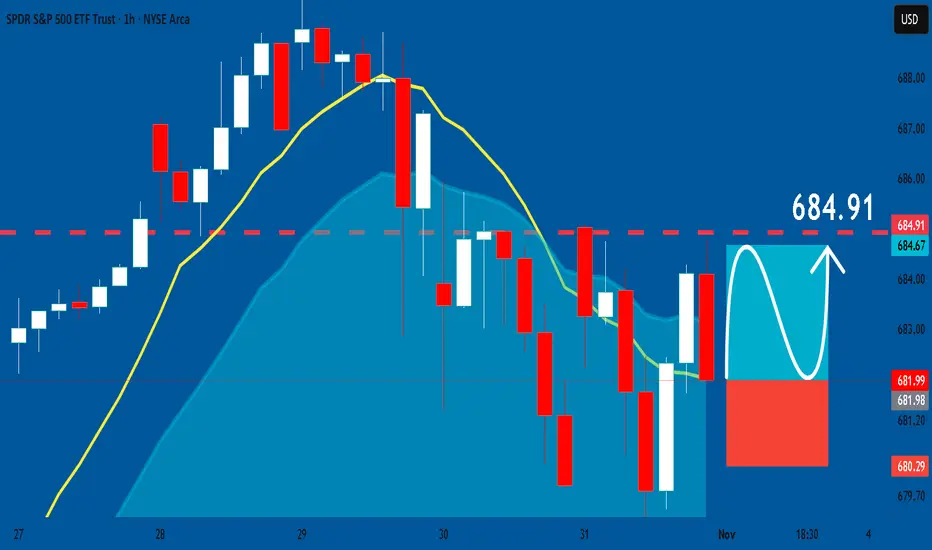
SPY: Long Signal with Entry/SL/TP
SPY
- Classic bullish pattern
- Our team expects retracement
SUGGESTED TRADE:
Swing Trade
Buy SPY
Entry - 681.99
Stop - 680.29
Take - 684.91
Our Risk - 1%
Start protection of your profits from lower levels
Disclosure: I am part of Trade Nation's Influencer program and receive a monthly fee for using their TradingView charts in my analysis.
❤️ Please, support our work with like & comment! ❤️
S&P 500 INDEX | Institutional Technical Analysis Masterpiece🔥 US500 S&P 500 INDEX | Institutional Technical Analysis Masterpiece | 6,843.7 🔥
📈 ELITE MULTI-TIMEFRAME BREAKDOWN | NOVEMBER 3-7, 2025 TRADING ROADMAP 📈
Current Level: 6,843.7 | Analysis Date: November 1, 2025, 00:54 UTC+4
Hello, TradingView community! 👋 The S&P 500 has been on an absolute tear, closing the week at a staggering 6,843.7 . The big question on everyone's mind is: Are we witnessing a final euphoric push before a correction, or is this simply a pause before the next leg up? This week, from November 3rd to 7th, will be critical.
Let's break down the multi-timeframe picture, blending classic theories with modern indicators to build a comprehensive trading plan for both intraday and swing traders. 🧠
═══════════════════════════════════════════════════════════════════
🎯 MARKET INTELLIGENCE EXECUTIVE SUMMARY
The S&P 500 stands at 6,843.7 , navigating a historic technical confluence zone that will determine the market's trajectory through year-end 2025. Our algorithmic and classical analysis fusion reveals bullish continuation potential with measured risk parameters. This week presents asymmetric opportunities as institutional positioning, technical patterns, and macro catalysts align for potentially explosive moves.
Critical Support Infrastructure: 🛡️
Immediate Floor: 6,820 - 6,830 (Algorithmic bid zone)
Secondary Base: 6,800 - 6,810 (Institutional accumulation)
Major Support: 6,750 - 6,770 (Weekly pivot nexus)
Ultimate Defense: 6,700 - 6,720 (Psychological fortress)
Resistance & Target Architecture: 🎯
First Ceiling: 6,860 - 6,870 (Intraday supply)
Secondary Wall: 6,900 - 6,910 (Round number magnet)
Breakout Zone: 6,950 - 6,970 (Pattern objective)
Major Extension: 7,000 - 7,020 (Psychological milestone)
═══════════════════════════════════════════════════════════════════
📊 WEEKLY TIMEFRAME (1W) - MACRO MARKET STRUCTURE
Elliott Wave Grand Architecture: 🌊
We're positioned in Minor Wave 3 of Intermediate Wave (5) within the secular bull market. The impulsive structure projects targets at 7,100-7,200 based on Fibonacci extensions. Critical validation: maintaining above 6,720 preserves the bullish count.
Primary Count: Wave 3 of (5) targeting 7,100
Alternative: Wave B of expanded flat, risk below 6,650
Invalidation: Weekly close below 6,600
Time projection: Completion by late November
Wyckoff Accumulation Schematic: 📚
Phase D - Markup Beginning
- Preliminary Supply (PSY): 6,920 tested
- Buying Climax (BC): 6,950 rejection
- Automatic Reaction (AR): 6,750 hold
- Last Point of Support (LPS): Current 6,843
- Sign of Strength (SOS): Pending above 6,870
Ichimoku Cloud Mastery: ☁️
Tenkan-sen: 6,815 (9-period support)
Kijun-sen: 6,780 (26-period base)
Senkou A: 6,850 (cloud top resistance)
Senkou B: 6,720 (cloud bottom support)
Chikou Span: Clear above price (bullish)
Cloud status: Thick and ascending
Advanced Harmonic Patterns: 🦋
Developing Bullish Gartley with precision ratios:
- XA leg: 6,500 to 6,950 (450 points)
- AB retracement: 0.618 at 6,672 ✅
- BC extension: Testing 0.786 at 6,845 (current)
- D completion: 0.786 XA at 6,850-6,870
- Target upon completion: 7,050-7,100
═══════════════════════════════════════════════════════════════════
📉 DAILY TIMEFRAME (1D) - SWING TRADING COMMAND CENTER
Japanese Candlestick Mastery: 🕯️
Yesterday's Doji Star at resistance signals equilibrium. Today's action critical:
- Close above 6,860 = Three White Soldiers continuation
- Close below 6,820 = Evening Star reversal warning
- Current bias: Neutral-bullish pending confirmation
Master Pattern Recognition:
Cup and Handle formation nearing completion:
- Cup low: 6,650 (October)
- Cup high: 6,920 (Recent peak)
- Handle forming: 6,820-6,870 range
- Breakout target: 7,190 (270-point measured move)
- Volume requirement: 25% above 20-day average
Bollinger Bands Configuration: 📊
Upper Band: 6,875 (immediate resistance)
Middle Band (20-SMA): 6,810 (dynamic support)
Lower Band: 6,745 (oversold boundary)
Band Width: Expanding (volatility increasing)
%B Indicator: 0.68 (upper half, bullish bias)
RSI Multi-Timeframe Analysis:
Daily RSI: 59 (room for upside)
Hidden bullish divergence vs price action
Support trend line from September intact
Resistance at 70 provides 11-point runway
═══════════════════════════════════════════════════════════════════
⚡ 4-HOUR TIMEFRAME (4H) - TACTICAL EXECUTION FRAMEWORK
Gann Theory Application: 📐
Current Gann Angles:
1x1: 6,825 (45-degree support)
2x1: 6,850 (current resistance)
1x2: 6,790 (major support)
Square of 9: 6,889 (next target)
Gann Box: 6,750-6,950 range
Time cycles: Nov 5 critical date
Dow Theory Confirmation Checklist: ✅
Primary Trend: Bullish (new highs achieved)
Secondary Trend: Consolidation/Correction
Volume Confirmation: Accumulation on dips
Breadth Analysis: 65% stocks above 50-DMA
Sector Rotation: Technology leading (bullish)
Transportation Confirmation: Pending
Moving Average Symphony:
- EMA 8: 6,838 (ultra-short support)
- EMA 21: 6,825 (short-term support)
- EMA 50: 6,810 (medium support)
- SMA 100: 6,785 (strong support)
- SMA 200: 6,750 (major trend support)
Pattern Alert: 🚨
Ascending Triangle resolution imminent:
- Horizontal resistance: 6,860-6,870
- Rising support: 6,820-6,830
- Apex convergence: November 4
- Breakout projection: 6,950+
═══════════════════════════════════════════════════════════════════
🎪 1-HOUR TIMEFRAME (1H) - PRECISION TRADING LABORATORY
Micro Pattern Development: 🔬
Double Bottom forming at 6,825:
- First bottom: 6,823 (10:00 UTC)
- Second bottom: 6,826 (14:00 UTC)
- Neckline resistance: 6,855
- Pattern target: 6,885 (30-point move)
VWAP Trading Matrix:
Daily VWAP: 6,841
Weekly VWAP: 6,825
Monthly VWAP: 6,795
Upper Band 1: 6,858 (first resistance)
Upper Band 2: 6,875 (second resistance)
Lower Band 1: 6,824 (first support)
Lower Band 2: 6,807 (second support)
Support & Resistance Precision Grid:
R4: 6,890 (Major resistance)
R3: 6,875 (Daily upper BB)
R2: 6,860 (Pattern neckline)
R1: 6,850 (Immediate resistance)
PIVOT: 6,843.7 (Current Price)
S1: 6,835 (Micro support)
S2: 6,825 (VWAP support)
S3: 6,810 (Major support)
S4: 6,795 (Monthly VWAP)
═══════════════════════════════════════════════════════════════════
⚡ 30-MINUTE TIMEFRAME (30M) - SCALPING COMMAND POST
Microstructure Analysis: 🎯
Bull Flag pattern developing:
- Pole: 6,810 to 6,855 (45 points)
- Flag consolidation: 6,835-6,845
- Breakout trigger: 6,846
- Target: 6,890 (45-point measured move)
Volume Profile Intelligence: 📊
POC (Point of Control): 6,837
VAH (Value Area High): 6,848
VAL (Value Area Low): 6,828
HVN (High Volume Node): 6,835-6,840
LVN (Low Volume Node): 6,855-6,860 (breakout zone)
Scalping Execution Zones:
Buy Zones:
• Zone 1: 6,835-6,838 (POC test)
• Zone 2: 6,828-6,831 (VAL support)
• Zone 3: 6,820-6,823 (Strong bid)
Sell Zones:
• Zone 1: 6,848-6,851 (VAH resistance)
• Zone 2: 6,858-6,861 (Supply zone)
• Zone 3: 6,868-6,871 (Major resistance)
═══════════════════════════════════════════════════════════════════
🏃 15-MINUTE & 5-MINUTE HYPERSPEED SCALPING
15-Minute Lightning Analysis: ⚡
Wedge pattern near apex:
- Upper trendline: 6,847
- Lower trendline: 6,839
- Breakout direction: 70% probability upward
- Quick target: 6,855 (+12 points)
- Stop: 6,835 (-8 points)
5-Minute Algorithmic Signals:
Long Entry Conditions:
RSI(5) < 30 AND Price > VWAP = BUY
MACD crossover AND Volume > Average = BUY
Price touches EMA(20) from above = BUY
Short Entry Conditions:
RSI(5) > 70 AND Price < VWAP = SELL
MACD crossunder AND High volume = SELL
Price rejected at resistance = SELL
Exit Rules:
Take profit: 8-10 points
Stop loss: 5-6 points
Time stop: 15 minutes max hold
Session Volatility Map: 🕐
Asian: 10-15 point range (quiet)
London Open: 20-30 point expansion
NY Premarket: 25-35 point volatility
NY Open: 40-50 point moves
NY Afternoon: 20-30 point consolidation
═══════════════════════════════════════════════════════════════════
📅 WEEKLY STRATEGIC FORECAST (NOVEMBER 3-7, 2025)
Monday, November 3: 🚀
Opening gap probability: 60% bullish
Strategy: Buy weakness to 6,830, target 6,870
Key levels: Support 6,820, Resistance 6,880
Expected range: 50 points
Tuesday, November 4: 🗳️
Election Day - Extreme volatility expected
Strategy: Straddle/strangle positions
Potential range: 6,750-6,920 (170 points!)
VIX spike likely above 25
Wednesday, November 5: 💥
Post-election directional resolution
Strategy: Trade the breakout aggressively
Bullish above 6,880 → Target 6,950
Bearish below 6,800 → Target 6,720
Thursday, November 6: 📊
FOMC minutes and economic data
Strategy: Fade first move, trade reversal
Expected consolidation: 6,850-6,900
Options gamma concentration: 6,875
Friday, November 7: 🎯
Weekly options expiration dynamics
Strategy: Theta decay trades around 6,850
Pin risk: 6,850 strike concentration
Weekly close above 6,870 = Bullish next week
═══════════════════════════════════════════════════════════════════
⚖️ INSTITUTIONAL RISK MANAGEMENT PROTOCOLS
Intraday Risk Framework: 🛡️
Position sizing: 0.5-1% risk per trade
Risk-Reward: Minimum 1:2.5 ratio
Daily loss limit: -2% portfolio max
Consecutive losses: 3 max, then pause
Profit trailing: 60% of maximum gain
Breakeven stop: At 10-point profit
Scaling strategy: 3 entries maximum
Swing Position Architecture: 💼
Core position: 50% at 6,820-6,830
Add-on levels: 25% at 6,800, 25% at 6,780
Stop loss: Below 6,750 (all positions)
Target 1: 6,900 (25% exit)
Target 2: 6,950 (35% exit)
Target 3: 7,000 (25% exit)
Runner: 7,050+ (15% hold)
═══════════════════════════════════════════════════════════════════
🔴 RISK SCENARIOS & CIRCUIT BREAKERS
Bearish Invalidation Levels: 🐻
15-min close below 6,835 = Micro caution
Hourly close below 6,820 = Intraday bearish
4H close below 6,800 = Swing bearish shift
Daily close below 6,750 = Trend reversal risk
Weekly close below 6,700 = Major bear signal
Tail Risk Considerations: 🦢
• Geopolitical shock (100+ point gap risk)
• Fed policy surprise (2-3% moves)
• Tech earnings disasters (sector rotation)
• Credit event contagion (systemic risk)
• AI bubble concerns (valuation reset)
═══════════════════════════════════════════════════════════════════
💎 ELITE CONFLUENCE TRADING ZONES
Premium Buy Zone: ✅
6,820-6,830
(Multi-timeframe support + Fibonacci 61.8% + VWAP + Moving average cluster)
Optimal Sell Zone: ❌
6,870-6,880
(Resistance confluence + Pattern targets + Round number + Options barrier)
Breakout Trigger: 🚀
6,870-6,875
(Triangle apex + Bollinger Band + Volume breakout zone)
═══════════════════════════════════════════════════════════════════
🏆 MASTER TRADER'S FINAL VERDICT
The S&P 500 at 6,843.7 presents a high-conviction bullish opportunity with exceptional risk-reward dynamics. Technical confluence across multiple timeframes, combined with constructive market internals and seasonal factors, supports upside continuation toward 6,900-6,950 initially, with 7,000+ potential.
Top 3 Highest Probability Trades: 🎯
Swing Long: 6,820-6,830 → Target: 6,950 (RR 1:4)
Breakout Long: Above 6,870 → Target: 6,920 (RR 1:3)
Scalp Long: VWAP 6,841 → Target: 6,855 (RR 1:2.5)
Trading Wisdom: 🧠
Position for probability, not possibility. Size for survival, not home runs. The best traders are risk managers who happen to trade.
"Markets can remain irrational longer than you can remain solvent. Trade the chart, not the opinion!" 💡
═══════════════════════════════════════════════════════════════════
📍 ACTIONABLE INTELLIGENCE SUMMARY
Bull market intact above 6,750. Accumulate dips toward 6,820. Target 7,000 by month-end. Risk management is paramount during election week volatility.
Trade with discipline. Prosper with patience. 💰
═══════════════════════════════════════════════════════════════════
#SPX #SP500 #US500 #TechnicalAnalysis #Trading #StockMarket #Indices #DayTrading #SwingTrading #ElliottWave #Wyckoff #HarmonicPatterns #OptionsTrading #VIX #MarketStructure #OrderFlow #InstitutionalTrading #AlgorithmicTrading #TradingView #MarketForecast #SPY #ES_F
🔔 Follow for Institutional-Grade Analysis | Precision • Discipline • Profits 📊
Disclaimer: This analysis is educational only. Trading carries substantial risk of loss. Past performance does not guarantee future results. Always conduct independent research and employ proper risk management.

$SPY ends the week with a Shooting Star AMEX:SPY : The week ends with a Shooting Star pattern and a negative RSI 5 divergence.
Levels to watch if the Shooting Star pattern indicates a correction:
1. The last breakout resulted in a new all-time high at 674.
2. The last higher low, which coincides with the 10-week simple moving average, is a key support level that must hold for the uptrend to continue at 663.
SPY Bullish Breakout: Flag Setup Aims for 700–715SPY remains in a strong 1D uptrend, printing higher highs and higher lows from June through November. Price continues to respect the 20-day MA as dynamic support, with a clean demand zone near $671.72. Overhead, the recent all-time high at $689.76 aligns with the upper boundary of a developing bull flag (upper trendline ≈ $688). Structure is bullish; momentum stays positive while volatility cools after October’s expansion.
Primary path: a daily close above $689.76/$690 confirms the flag breakout and likely drives a continuation toward the psychological $700 handle first, then the $710–$715 extension as participation broadens. Alternatively, a constructive pullback into $671–$675 offers a dip-buy zone so long as the 20-day MA holds. If $671.72 fails decisively, watch the 60-day MA around $658.57 as the next support area.
Triggers and risk: Break-and-hold above $690 or a strong rebound from $671 activates longs; scale out near $700 with room for $710–$715 if momentum persists. Invalidation for breakout entries sits below the recent consolidation lows around $678; for dip buys, a break under the prior swing low near $668 negates the immediate bullish thesis. A daily close below $671 would be an early bearish warning. This is a study, not financial advice. Manage risk and invalidations

Opening (IRA): SPY February 20th -600P... for a 6.09 credit.
Comments: Laddering out at strikes better than what I currently have on. It would be better if I had weakness, but I've got dry powder for that should it occur.
Targeting the strike paying around 1% of the strike price in credit. Will generally roll to lock in realized gains and/or "window dress" (i.e., roll down and out to a lower strike paying approximately the same amount of credit.

LLY LOOKS BULLISH OCT 31 2025I have LLY from lower levels of 870ish which was trade 2. Trade 1 was initiated at 637. Now again it looks ready to go to 890
I am long since $815 yesterday.
Trade as per your risk management and its a current price trade so SLs would be huge. But I can understand what price is trying to do here.
LLY should breakout

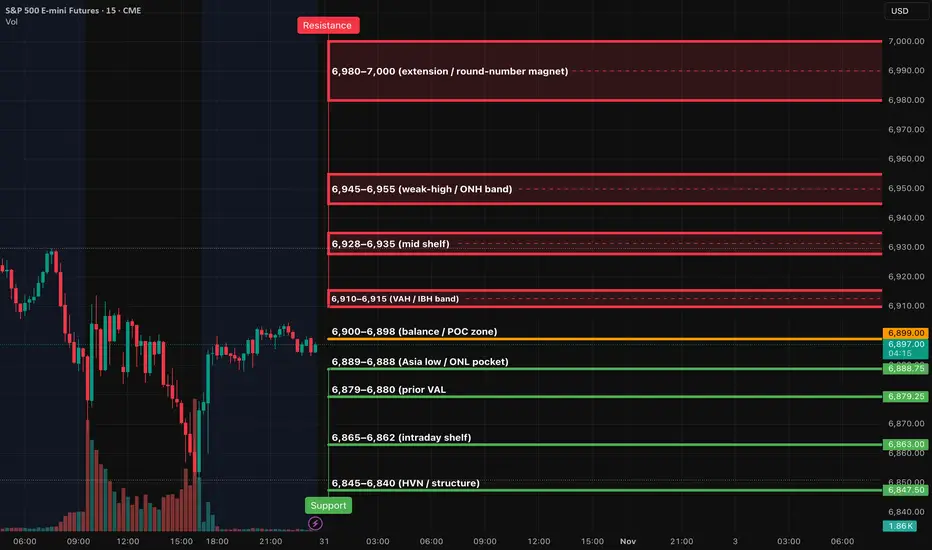
ES (SPX, SPY) Analysis, Key Zones, Setups for Fri (Oct 31st)Kill-zones (ET): NY AM 09:30–11:00; manage 12:00–13:00; NY PM 13:30–16:00.
Event (Fri): 9:45 ET Chicago PMI (unaffected by shutdown).
Upside continuation (LONG):
6,910 flips to support with a 15m close above → 5m pullback holds → 1m HL entry.
SL: 15m trigger-wick ±0.25–0.50.
TP1 6,928; TP2 6,945–6,955; TP3 6,980–7,000.
Quick-reclaim bounce at 6,889–6,888: sweep and instant reclaim → ride to 6,898 → 6,904–6,910.
Pop-and-fail shorts (SHORT):
Reject 6,904–6,910 then 15m closes back under 6,904 → 5m LH entry.
SL: 15m wick.
TP1 6,898; TP2 6,889; TP3 6,879.
Clean breakdown of 6,889 with a 15m close ≤6,887 → 5m LH entry.
TP1 6,879; TP2 6,865; TP3 6,845.
Management & risk
Viability gate: only take a trade if TP1 ≥ 2.0R using the 15m-wick stop.
At TP1: close 70%, set the 30% runner to BE; runner aims TP2→TP3.
Max two attempts per level per session.