SPY MAJOR CORRECTION INCOMINGWhat up, fam? I'm back on my market Nostradamus grind, and I got a feeling y'all gotta hear about. Time to drop some knowledge! 🧠
Listen, rewind to February 14, 2025 🗓️. That day, my trading system was ringing the alarm bells like crazy. It gave me a super early heads-up that a major U-turn, a reversal, was about to hit the market.
Where did that heat check come from? Nvidia (NVDA) stock.
I saw it sitting high, maybe around $140, and I dropped a bomb: I said Nvidia was taking a trip down to $90. 💣
Y'all remember that? I got roasted! People called me all types of crazy names—clown, dummy, you know, the usual investor insults when you try to call the market's shot. But guess what? My system came through. The proof is in the pudding. 🧾
📉 Time for the Next Big Drop: SPY
Now, I'm dropping another prophecy, and it's for the big dog: SPY (that's the S&P 500 ETF, for those sleeping).
I'm calling for a major correction—a big ol' dip—just like the one we saw back in March and April 2025.
I'm predicting this correction is gonna take us all the way back down to the $480 level we saw in 2025. If it gets real ugly, we might even erase all the gains of 2025 and re-test those earlier 2025 lows. Don't say I didn't warn you! ⚠️
💡 The Secret Sauce: It Ain't Luck
Why am I posting this now? For two reasons:
For the Records: This post is my time stamp. I can send people back here when it happens and say, "I told you so!" 😉
To Show You This: The market is predictable. You can get early warnings and see the signs before a big move hits. 🔔
But here’s the real talk: you gotta put in the work. You can't just wish upon a star. To get to this level, you have to master:
Reading the Charts
: Being a boss at understanding the flow. 📊
Math
: Understanding the numbers game. ➕
Self-Worth
: Believing in your own study and research skill. 💪
That's all for today. Don't be mad when it happens.
See you at $485 in the SPY! Before summer 2026 target. Peace out. ✌️
SPDR S&P 500 ETF (SPY)

SPY: Long Trading Opportunity
SPY
- Classic bullish formation
- Our team expects growth
SUGGESTED TRADE:
Swing Trade
Buy SPY
Entry Level - 671.95
Sl - 668.83
Tp - 677.75
Our Risk - 1%
Start protection of your profits from lower levels
Disclosure: I am part of Trade Nation's Influencer program and receive a monthly fee for using their TradingView charts in my analysis.
❤️ Please, support our work with like & comment! ❤️

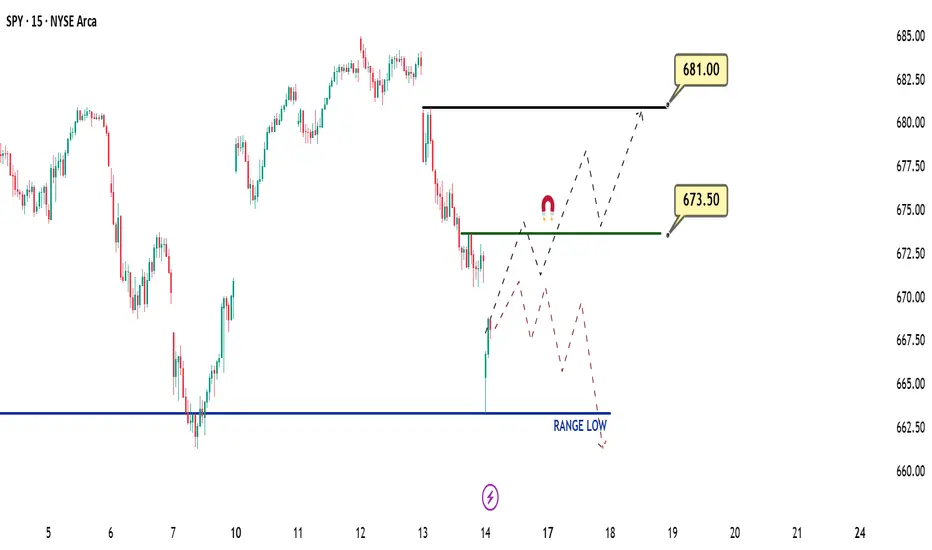
Daily SPY (US500-ES-SPX) Outlook - Prediction (14 NOV)Daily SPY (US500-ES-SPX) Outlook - Prediction (14 NOV)
📊 Market Sentiment
Market sentiment appears neutral, in my opinion. The U.S. government is expected to reopen soon; however, officials have decided not to release previous economic data. This creates uncertainty for traders — without key data, it becomes difficult to anticipate the FED’s next policy decision.
📈 Technical Analysis
QQQ ran the weekly swing low at the 687 level and was rejected there. SPY retested the 637 zone, which is the range low for me, and reacted perfectly with a strong bounce. At the moment, price is showing clear upward momentum, suggesting that a stronger move may develop into the afternoon session. NVDA and AAPL are currently leading the market higher.
📌 Game Plan
Bullish Scenario: I bought calls and I’m targeting a minimum of 673.5. My second target is 681 for a runner. Once price reaches 673.5, I will move my stops to break-even.
Bearish Scenario: If price gets rejected at the 671 level, I will exit my calls and switch to puts, targeting the 661 zone.
💬For detailed insights and broader market context, please check my Substack link in profile.
⚠️ For educational purposes only. This is not financial advice.
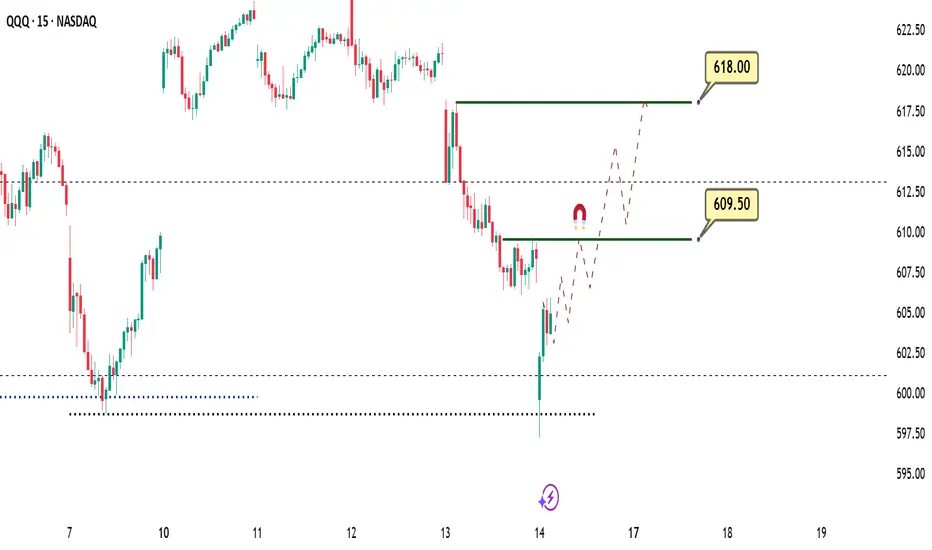
Daily QQQ (US100-NQ) Outlook - Prediction (14 NOV)Daily QQQ (US100-NQ) Outlook - Prediction (14 NOV)
📊 Market Sentiment
Market sentiment appears neutral, in my opinion. The U.S. government is expected to reopen soon; however, officials have decided not to release previous economic data. This creates uncertainty for traders without key data, it becomes difficult to anticipate the FED’s next policy decisions.
📈 Technical Analysis
QQQ tapped the weekly swing low at 687 and was rejected from that level. SPY retested the 637 zone, which is the range low for me, and reacted with a strong bounce. At the moment, price is showing clear upward momentum, suggesting that a stronger move may develop into the afternoon session. NVDA and AAPL are currently leading the market higher.
📌 Game Plan
I bought calls around 601, and I expect to see 609.5 first, and if we get a strong continuation, possibly the 618 level.
At 609.5, I will close half of my position, trail my stop-loss to breakeven, and target 618 for the remainder.
💬For detailed insights and broader market context, please check my Substack link in profile.
⚠️ For educational purposes only. This is not financial advice.
Market Crashed — I Stayed Calm & Made $338 | Day 69 RecapMade $338.44 today trading S&P Futures on a day where almost everything was red.
The market opened with a bearish structure, and even without big headlines, selling pressure stayed strong all morning.
I decided to wait for the 6750 zone — a strong technical support — and caught a clean dead cat bounce from there.
This session reminded me that sometimes, less is more. Trade small, trade smart, and don’t let overconfidence creep in after a winning streak.
Above 6850 = bullish, below 6825 = bearish.
I’ll be watching for follow-through if we retest support again.

ES (SPX, SPY) Analysis, Levels, Setups, for Fri (Nov 14th)
Today’s session revealed a marked risk-off sentiment as the market began to discipline leading sectors, notably large-cap tech, AI, semiconductors, and high-beta growth stocks. This correction coincided with a reassessment of expectations for near-term Federal Reserve easing and an environment defined by unequal economic data in the wake of the record shutdown.
Despite the abrupt decline, the E-mini S&P 500 (ES) remains in a pullback phase within a broader uptrend, still functioning within a weekly premium and supply zone. This movement exhibits characteristics typical of a sharp correction and repositioning rather than the definitive onset of a bear market. Importantly, prices have yet to break below the last significant daily higher-low region, weekly market structure continues to show constructive signs, and the “stress indicators” monitored by institutional investors are elevated but not yet at levels indicative of a crisis.
Dashboard Context
Volatility: Implied volatility surged today, with equity volatility pushing above previously complacent levels, albeit the term structure remains predominantly upward-sloping rather than inverted. This nuance is critical; while funds are investing more for protection and short-term hedges, the volatility landscape does not yet suggest a disorderly liquidation phase.
Options Positioning: The index and overall put/call ratios have transitioned from a state of complacency to caution, reflecting increased demand for hedging. However, levels are not yet extreme enough to signal panic. Skew is elevated, indicating that investors are bidding for downside protection, although it remains within the upper bounds of a normal range. This suggests that while major institutions are leaning into protective strategies and tactical downside plays, the broader market is not universally positioned for a crash.
Breadth: The internal damage today was notable, with decliners outpacing advancers significantly across major exchanges. This shift in breadth oscillators from positive to negative in a single session points to a broad-based distribution rather than a narrow selloff concentrated in a few prominent names. Historically, such internal damage requires several sessions for a market to recover.
Credit and Funding: High-yield spreads have widened modestly from recent lows, and high-yield ETFs have pulled back from their peaks. Nevertheless, there are no current signs of a credit crisis. Spreads remain well within ranges that do not indicate severe stress, and funding markets continue to operate smoothly. Provided that credit conditions stay stable, current equity weakness is likely more reflective of a valuation and positioning reset than systemic risk.
Cross-Asset Risk: The crypto market experienced a sharp selloff, while global equity indices broadly fell. This behavior confirms a classic cross-asset risk-off scenario, as investors reduced exposure to the highest-beta, most speculative areas while simultaneously de-leveraging from U.S. equity leaders. Conversely, traditional defensive stocks and segments of quality value showed relative resilience, a behavior consistent with a managed de-risking rather than an all-encompassing liquidation.
In summary, the dashboard indicates a shift from “overbought complacency” to a higher-volatility, risk-off environment. However, we have yet to enter a full-scale, credit-driven bear market. This context is essential for interpreting today’s decline in the E-mini S&P 500.
Multi-Timeframe Technical Structure (Weekly → Daily → 4H → 1H)
Weekly: The E-mini remains in an upward trajectory, printing higher highs and higher lows. Prices have retreated from a premium zone established at recent highs. The current weekly bar suggests rejection, yet critically, price levels remain comfortably above the last key weekly higher low near the 6,000 mark. Weekly momentum, previously overstretched to the upside, is rolling over, signaling a potential cooling phase – likely a period of consolidation or corrective drift rather than immediate trend failure.
Daily: On the daily chart, the ES has formed a distinct upper range beneath a weak high. Today’s trading produced a significant red candle, indicating a drop from the upper range back toward its center. The prior swing low around 6,620–6,580 remains intact, but the daily oscillator shows mild bearish divergence relative to the last high – a common occurrence in maturing upswings. This situation conveys the message of “bullish but extended, now in corrective mode,” rather than a definitive shift to a pattern of lower highs and lower lows.
4-Hour: The 4-hour structure has entered a short-term downtrend. A lower high was established in the 6,900–6,920 range, leading to an impulsive sell-off toward demand around 6,730–6,700. This selloff exhibited characteristics of liquidation: substantial red candles, minimal counter-rotation, and strong volume. The 4-hour oscillator shows bearish pressure but is beginning to flatten near support, consistent with an early basing attempt after a sharp sell-off, though additional downside remains possible if negative overnight flows persist.
1-Hour: The 1-hour chart portrays today’s price movement as a decisive liquidation wave.
Today's market decline was driven by three converging factors.
First, we saw a mix of valuation adjustments and crowded positioning. Sectors such as AI, semiconductors, and large-cap growth stocks had experienced significant upward momentum. As a result, profit-taking and forced de-leveraging became evident, especially when the largest index components corrected. This simultaneous adjustment made it challenging for the overall index to hold its ground.
Second, the narrative surrounding interest rates and policy has shifted. Recent commentary from the Federal Reserve has adopted a more cautious tone regarding the pace and scale of future interest rate cuts. With inflation remaining above target and some data being impacted by the government shutdown, policymakers appear hesitant to endorse the market's most optimistic expectations for easing. This recalibration towards a "higher for longer" mindset is detrimental to long-duration growth equities and affects the valuations assigned to market leaders.
Third, while the government shutdown has concluded, the subsequent rhythm of the economic calendar has been disrupted. Several critical data releases have been delayed or are now under scrutiny, prompting investors to navigate through somewhat erratic information. In this context, there has been a notable reluctance to take on risk at elevated valuations without clearer data confirmation. Consequently, we are witnessing a trend of de-risking, characterized by a swift rotation from expensive stocks into cash, defensive positions, and protective strategies.
The outcome has been a pronounced selloff, exhibiting broad downside movement and a surge in volatility. Importantly, this occurred without significant turmoil in credit or funding markets, suggesting that we are dealing with a valuation reset rather than a systemic crisis.
Looking ahead, the question arises: Is this the beginning of a more substantial downtrend or merely a temporary flush? From a structural perspective, the market has yet to breach the typical thresholds that signal the onset of a major downtrend. The previous daily higher low remains in place, the weekly uptrend is still intact, and we have not observed the combination of lower highs and lower lows that would signify a broader bearish phase.
Currently, we are witnessing a rejection from a weekly premium/supply zone, with momentum weakening at both daily and weekly levels. Additionally, there is a clear lower high alongside a liquidation move visible on the four-hour chart, which aligns with the expected behavior during the early stages of a significant correction following an extended rally.
As it stands, the prevailing view is that we are experiencing a sharp corrective phase or volatility spike within the upper range of the ongoing uptrend. While the risk of a more profound correction is heightened, particularly if the support range of 6,600 to 6,535 is breached, the current indicators do not yet suggest a completed market top or a fully developed bearish trend.
A genuine trend transition would likely require:
– a decisive break of S3 and a failed retest from below;
– a sustained period of weak breadth rather than a single-day air pocket;
– and, on the macro side, a clear deterioration in credit and funding conditions alongside a persistent inversion of the equity volatility term structure.
At present, those conditions are not fully in place.
Level-KZ Execution Framework for Tomorrow
Asia/London Participation: If overnight trade pushes the ES down into the 6,710–6,680 range and subsequently prints a rejection with a definitive 15-minute close above that zone, consider it a tactical bounce location. This could target a move back toward the 6,770–6,800 region. Given the event risk, participation should be smaller than usual and approached as preparatory rather than primary risk.
PPI Window (08:30–09:15 ET): The initial 15–30 minutes post-PPI release should be regarded as a discovery phase. If the first impulse upward drives the price into R1/R2 but then closes back below 6,780–6,800 with upper wicks and a failure of the 5-minute structure, it sets up a potential short from the underside of the shelf. Targets for this short could be at 6,720 and then 6,680. Conversely, if the initial market reaction results in a drop to S2/S3 that quickly wicks back and closes above that zone on a 15-minute chart, it presents a tactical bounce long toward the 6,740–6,780 area. The decisive 15-minute close after the data release will provide clarity on which side gains control for the session.
NY AM Kill Zone (09:30–11:00 ET): For short positions, the optimal area remains a rejection from 6,780–6,815 after the PPI reaction is digested. A long upper wick and a return close within that range on a 15-minute chart, paired with a failure in the 5-minute attempts to maintain above, supports a short position. Stops should be placed just above the rejection high, with profit targets initially toward 6,720 and subsequently toward 6,680. Conversely, for long opportunities, an ideal scenario involves a constructive reaction from the 6,700–6,660 support band. This would look for a higher low on the 15-minute chart, reclaiming and holding above 6,700, while sellers falter at S1. In this case, stops would belong below the reaction low, targeting 6,770 and 6,810. Standard A-tier protocol applies: anticipate at least 2R to the first target based on a 15-minute-anchored stop, limit attempts per level, and enforce daily risk guardrails.
NY PM Window (13:30–16:00 ET): Should the ES remain constrained between 6,700 and 6,800 by early afternoon, the trade dynamic typically shifts from discovery to mean-reversion. Thus, the afternoon should primarily focus on managing existing positions from the morning rather than initiating new aggressive plays. Fresh entries based on trending strategies should only be considered if there is a clear breakout from the established intraday range, whether below S3 or above R3, accompanied by confirmation.
Big-Picture Takeaway: Fundamentally, today’s decline indicates a reassessment of overly optimistic growth and AI valuations, along with near-term Federal Reserve easing, partly prompted by a complicated post-shutdown data environment. Technically, the ES is retreating from a weekly premium into various support zones while maintaining the core bullish structure. Stress indicators favored by large professional investors—such as volatility, options positioning, breadth, credit, and cross-asset behavior—suggest a serious risk-off event has occurred, but they don't exhibit the persistent stress and credit strain typically seen before a full bear market materializes.
As long as the ES decisively holds above the 6,600–6,535 zone and doesn’t reject that area from below, the higher-probability play in the coming sessions is a volatile corrective range, offering tactical opportunities to sell rallies into resistance and buy deeper, well-defined demand zones—always bearing in mind the heightened volatility and macro event risks on the calendar.

SPY & SPX Scenarios — Friday, Nov 14, 2025🔮 SPY & SPX Scenarios — Friday, Nov 14, 2025 🔮
🌍 Market-Moving Headlines
🚨 Shutdown disruption continues: The entire Retail Sales + PPI complex — normally one of the biggest monthly movers — is still at risk of nondelivery. Markets will trade on expectations, not prints.
📉 Volatility watch: With CPI, Claims, and Retail Sales all in backlog, positioning remains thin and reactive to yields + global risk sentiment.
💵 Bond market tone dominates: Without fresh inflation data, Treasury moves may guide SPX levels more than usual.
📊 Key Data & Events (ET)
All major data below is shutdown-risk flagged.
⏰ ⚠️ 8:30 AM — Retail Sales (Oct)
Forecast: -0.2%
Shutdown delay risk — high
⏰ ⚠️ 8:30 AM — Retail Sales ex-Auto (Oct)
Forecast: +0.2%
Shutdown delay risk — high
⏰ ⚠️ 8:30 AM — Producer Price Index (PPI, Oct)
Headline: +0.1%
Core: +0.3%
Shutdown delay risk — high
⏰ ⚠️ 10:00 AM — Business Inventories (Sept)
Forecast: +0.2%
Shutdown delay risk — medium
👉 All above data normally moves markets, especially Retail Sales + PPI.
Today, traders only get the reaction if the numbers publish.
⚠️ Disclaimer: Educational and informational only — not financial advice.
📌 #SPY #SPX #trading #inflation #PPI #RetailSales #macro #economy #Fed #markets #risk #shutdown
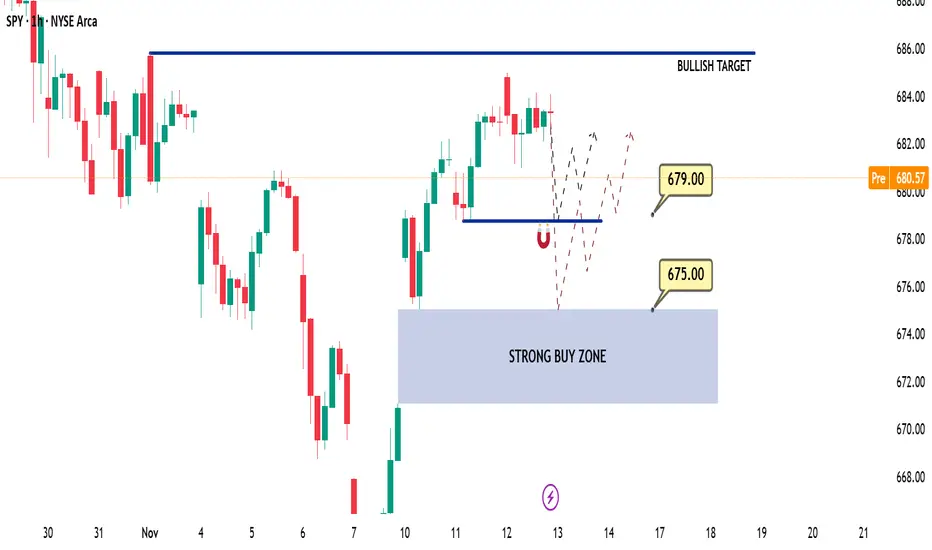
Daily SPY (US500-SPX) Outlook - Prediction (13 NOV)Daily SPY (US500-SPX) Outlook - Prediction (13 NOV)
📊 Market Sentiment
Market sentiment appears neutral, in my opinion. The U.S. government is expected to reopen soon; however, officials have decided not to release previous economic data. This adds uncertainty for traders without data, it becomes difficult to gauge the FED’s next policy decision.
📈 Technical Analysis
SPY experienced a range-bound session yesterday, consolidating between 680 and 685. On higher timeframes, price action still suggests a desire to expand higher, but momentum has temporarily slowed.
📌 Game Plan
In my opinion, the market may show slight bearish pressure early in the session, followed by a moderate bullish bounce.
Scenario 1: SPY may drop to 679 and bounce from there, returning to the 682–685 range.
Scenario 2: If SPY breaks 679 aggressively, I expect a retracement toward 675. At that level, I plan to load calls for a potential bullish move.
💬 For detailed insights and broader market context, please check my Substack link in profile.
⚠️ For educational purposes only. This is not financial advice.
Daily QQQ (US100-NQ) Outlook - Prediction (13 NOV)Daily QQQ (US100-NQ) Outlook - Prediction (13 NOV)
📊 Market Sentiment
Market sentiment appears neutral, in my opinion. The U.S. government is expected to reopen soon; however, officials have decided not to release previous economic data. This creates uncertainty for traders without key data, it becomes difficult to anticipate the FED’s next policy decision.
📈 Technical Analysis
QQQ experienced a range-bound session yesterday, while the Dow Jones carried most of the market’s momentum. Compared to SPY, QQQ showed more weakness throughout the session. However, the higher-timeframe structure remains bullish, and I will continue following that bias.
📌 Game Plan
Scenario 1: Price may dip to the 616–617 zone and bounce from there, returning to the 621–623 range.
Scenario 2: If price breaks 617 aggressively, it may retrace toward 613 before bouncing back into the 620–625 zone.
In my opinion, calls may work better on SPY today, while puts could perform better on QQQ.
💬 For detailed insights and broader market context, please check my Substack link in profile.
⚠️ For educational purposes only. This is not financial advice.

$SPY the final leg higher, then 20%+ correctionI know there are a lot of people calling for a crash right here, and while I do think we end up getting one, I think there's one last move higher above $700 first.
I think we need to squeeze out the shorts and convince everyone the next leg is starting before we see a move down.
I do think after we hit and reject one of the upper resistances, that it will set up a great short opportunity.
The trigger for the short will be UVIX to hit it's lower support levels combined with SPY hitting it's upper resistances.
Don't know what will cause the move, but I think it'll likely happen even faster than the April move.
So be prepared to exit as we approach the highs or set tight stop losses.

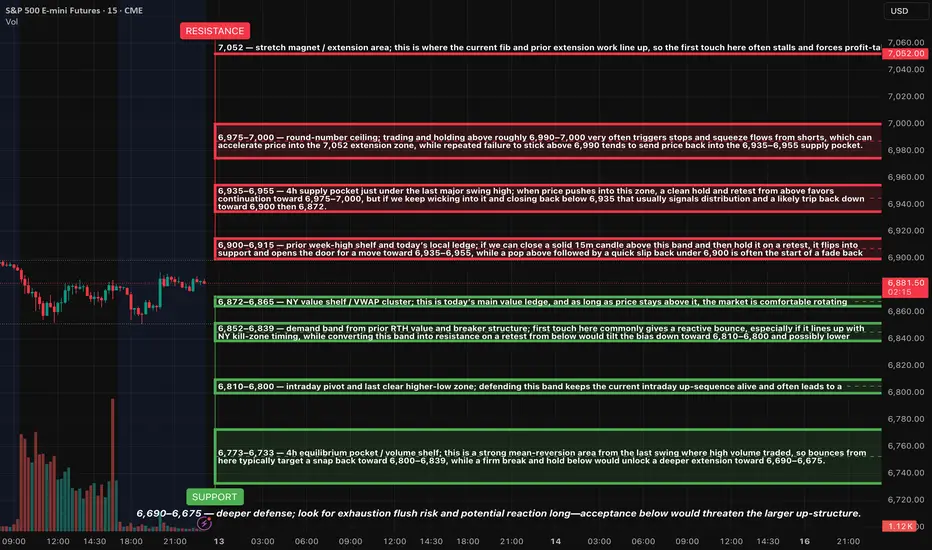
ES (SPX, SPY) Analysis, Levels, Setups for Thu (Nov 13th)HTF Analysis
Daily Chart: The overall trend remains bullish. Currently, the price is situated near the upper range, just below the previous swing high in the 6,960–6,980 zone. The market structure is characterized by a sequence of higher highs and higher lows, indicating that we are experiencing a temporary pause rather than a confirmed peak.
4-Hour Chart: We’re observing a robust V-shaped recovery from the 6,63x–6,66x support zone, with the price now consolidating sideways beneath overhead resistance. The recent 4-hour candles are overlapping within today’s range, suggesting a coiling pattern under resistance rather than a decisive breakout.
15-Minute to 30-Minute Charts: There’s a well-defined range forming. The highs are established around the 6,900–6,915 level, while the lows are consistently found between the 6,872–6,865 shelf, with further lower shelves below. Today's price action has effectively mapped out a framework for potential trading opportunities moving into tomorrow.
MACRO / EVENTS
The government shutdown has officially ended, and normal operations are resuming across agencies. This removes the associated headline risk. The market can now return its focus to the usual macroeconomic drivers: inflation data, the Federal Reserve's policy path, and corporate earnings.
However, there remains some uncertainty regarding the timing and form of upcoming inflation releases due to previous disruptions in data collection. The 8:30 AM ET time slot is still considered a potential source of market volatility. Aside from that, the economic calendar is relatively light, meaning that trading activity around our key levels will likely drive most of the intraday market movements.
SETUPS FOR TOMORROW (LEVEL–KZ STYLE)
Long setup 1 – bounce from 6,872–6,865
Idea: Look for Asia or London to probe into 6,872–6,865 and hold. If we see a clean rejection candle on 15m or 5m and then price reclaims 6,880 and holds above, that sets up a continuation long.
Trigger concept: Reclaim and hold above 6,880 after testing 6,872–6,865.
Risk anchor: Below 6,865, with a little room for noise depending on spread and volatility.
Initial target: 6,900–6,915.
Secondary target: 6,935–6,955.
Stretch idea: If 6,955 holds as new support and order flow remains strong, leave a small runner with eyes on 6,975–7,000.
Long setup 2 – deeper dip buy at 6,852–6,839 or 6,810–6,800
Idea: If 6,872–6,865 fails cleanly but overnight selling is controlled, watch for a fade into 6,852–6,839 or, in a stronger flush, 6,810–6,800. Look for exhaustion and quick reclaim of the upper edge of the band as a signal that buyers are stepping back in.
Trigger concept: Fast rejection wick through the band followed by a close back above the upper edge on 5m–15m.
Risk anchor: Below the lower edge of the chosen band (either under 6,839 or under 6,800).
Targets: First push back to 6,872–6,865, then 6,900–6,915 if momentum improves.
Short setup 1 – fade 6,900–6,915 pop-and-fail
Idea: If price rips into 6,900–6,915 during NY AM without first testing the lower shelves and then quickly fails to hold above 6,900, that is often a spot to fade the top of the range.
Trigger concept: Wick above 6,900–6,915 with a 5m–15m close back below 6,900.
Risk anchor: Above 6,915–6,920.
Initial target: 6,872–6,865.
Extended target: 6,852–6,839 if 6,872 cracks and holds below.
Short setup 2 – rejection from 6,935–6,955
Idea: If we get a clean breakout above 6,900–6,915 but the first test of 6,935–6,955 stalls with heavy wicks and no follow-through, you can look for a tactical fade of that 4h supply pocket.
Trigger concept: Failure to hold above 6,955, with a rotation back under 6,935 on a 15m close.
Risk anchor: Above 6,960–6,965.
Initial target: 6,900–6,915.
Secondary target: 6,872–6,865 if selling expands.
RISK NOTES
Avoid trading in the middle of the 6,872–6,865 and 6,900–6,915 band; let price push into the edges and then trade the reaction.
Size down if price is very slow and overlapping ahead of the 8:30 ET window; there is no need to swing full size into dead tape.
If you see a sudden spike around the data or headline window, focus first on how price behaves at the key shelves 6,872, 6,900, and 6,935 rather than trying to guess the news.
$SPY $SPX Scenarios — Thursday, Nov 13, 2025🔮 AMEX:SPY SP:SPX Scenarios — Thursday, Nov 13, 2025 🔮
🌍 Market-Moving Headlines
🚨 Inflation spotlight (⚠️ delay risk): October CPI and Jobless Claims — both subject to government shutdown delay — were originally scheduled for release this morning. Markets may stay cautious or reactive to leaks and private inflation trackers in the absence of official prints.
💬 Fed rotation continues: A packed Fed lineup — Mary Daly, John Williams, Kashkari, Hammack, and Bostic — will steer tone across the day, shaping expectations for December guidance.
📉 Budget check: A fresh federal deficit report (-$215B) adds to the fiscal backdrop narrative, though reaction may stay muted if major data doesn’t hit.
📊 Key Data and Events (ET)
⏰ 8:00 AM — Mary Daly (San Francisco Fed) speech
⏰ ⚠️ 8:30 AM — Consumer Price Index (Oct) | +0.3% MoM | +3.1% YoY (subject to delay)
⏰ ⚠️ 8:30 AM — Core CPI (Oct) | +0.3% MoM | +3.1% YoY (subject to delay)
⏰ ⚠️ 8:30 AM — Initial Jobless Claims (Nov 8) | 225,000 forecast (subject to delay)
⏰ 9:20 AM — John Williams (NY Fed) welcoming remarks
⏰ 10:25 AM — Neel Kashkari (Minneapolis Fed) opening remarks
⏰ 12:15 PM — Alberto Musalem (St. Louis Fed) speech
⏰ 12:20 PM — Beth Hammack (Cleveland Fed) speech
⏰ 2:00 PM — Monthly U.S. Federal Budget (Oct) | -$215B deficit vs -$257.5B prior
⏰ 3:20 PM — Raphael Bostic (Atlanta Fed) speech
⚠️ Note:
CPI and Jobless Claims carry the highest market impact this week — but both remain at risk of delay due to the ongoing federal data blackout. Fed speakers and any CPI proxies (like Cleveland Fed’s nowcast) will drive intraday volatility instead.
⚠️ Disclaimer: Educational and informational only — not financial advice.
📌 #SPY #SPX #trading #CPI #inflation #Fed #Williams #Bostic #Musanlem #Hammack #macro #markets #yields #shutdown
SPY QuantSignals V3 | 0DTE Scalper PlanSPY QuantSignals V3 | 0DTE | 2025-11-12
🎯 Direction: 🟩 BUY CALLS
📊 Confidence: 62% (Low Conviction)
🧭 Bias: NEUTRAL → Slight Bullish Tilt
⚠️ Risk: Moderate (Reduce Size)
💹 TRADE SETUP
Parameter Details
Expiry 2025-11-12 (same-day)
Strike $684.00
Entry $1.80 – $1.82
Target 1 $2.70 (~50% gain)
Stop Loss $1.20
Gamma Risk Low
🧠 QUICK ANALYSIS
Katy AI Forecast:
→ Neutral (50% confidence)
→ Range: -0.20% – +0.15%
→ Slight afternoon uptick → peak ~$685.43 @ 15:33
Tech Check:
SPY @ $684.42 > VWAP ($684.25) → Mild bullish bias
RSI 21.7 → oversold bounce zone
Trend Strength 76.7% → strong regime detected
Range: $682.43 – $685.88 (watch resistance at $685.88)
Flow Intel:
Put/Call Ratio = 1.55 → Bearish skew (contrarian long setup)
Heavy $696 puts → mostly hedging, not conviction selling
News Sentiment:
Mixed:
• Fed comments = neutral
• OpenAI headlines = slightly negative
• Gov. shutdown vote = potential bullish catalyst (PM session)
⚖️ RISK NOTE
High volatility + 0DTE decay → scalp only 🕒
Use small sizing; exit on failed bounce below VWAP.

US Re-Opening - Price Will Guide Us (Key Technicals and Tickers)The US House of Reps vote to re-open the government. A simple majority is needed
and it's very possible that by Thursday, the longest shutdown in history can officially end.
Will the price action use this positively or negatively?
US Inflation data is due Thursday and Friday, but with the long shutdown, it's difficult
to trust the number's relevance if it prints. My third party inflation metrics have
been showing a steady uptick in inflation since August 2025
Market seasonality has been nearly non-existent in 2025 post Liberation Day lows,
so I'm watching price action closely to see if the bulls can maintain a stable melt-up
into year end and avoid a deeper correction than 3-4% like we observed Oct 10 and
early November
Key Watchlist Items
SPX, SPY, QQQ, DIA, IWM
Gold, Silver, BTC
US10Y
DXY, CHF, JPY overall strength or weakness
Never a dull moment - I'll be watching!!!
-Chris Pulver

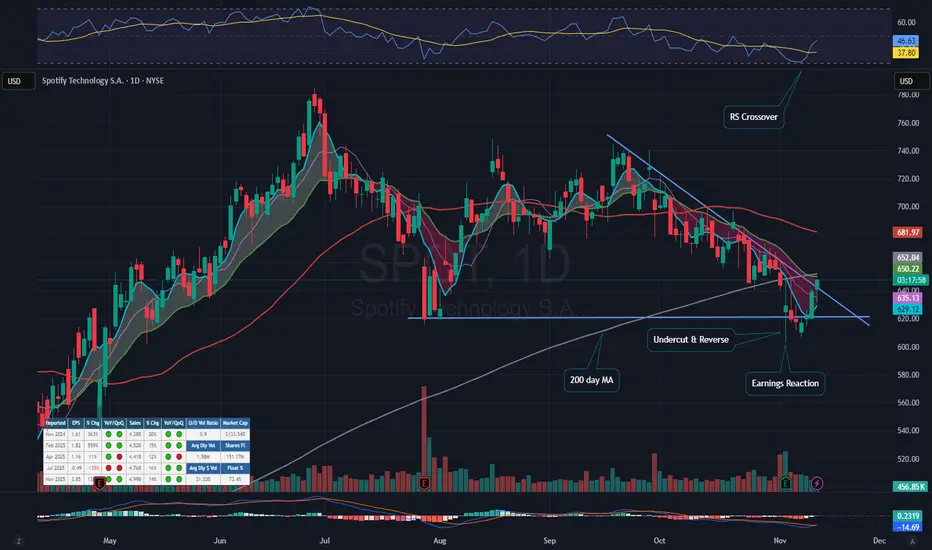
$SPOT Earnings Report and Technical Analysis OverviewSPOT Delayed Earnings Move
Earnings Report Summary
On the morning of November 4, 2025, Spotify Technology S.A. (SPOT) announced its earnings results for the third quarter, surpassing market expectations. The company reported earnings of $3.83 per share, notably higher than the consensus estimate of $1.87 per share. Revenue reached $4.99 billion, beating the expected $4.89 billion. This represented a 104.81% outperformance on earnings and a 13.93% increase in revenue year-over-year, with earnings growth at 140.9%. Despite this strong performance, Spotify provided guidance for fourth quarter revenue at approximately $5.17 billion, which is below the current consensus estimate of $5.32 billion for the period ending December 31, 2025.
Technical Analysis
Since mid-September, SPOT shares have been in a downtrend. A downward line of resistance had been identified, and as of today, the stock has broken above it. This movement also appears to form an undercut and rally pattern. However, several technical hurdles remain. Notably, the stock has not yet established a higher low or a higher high, which are key signals needed to confirm a reversal of the downtrend. Additionally, SPOT is currently trading below its 21-day exponential moving average (EMA), 50-day moving average (DMA), and 200-day moving average (DMA).
Criteria for Reversal Confirmation
While there are signs that a reversal may be underway, further evidence is required. The first indication would be the formation of a higher low, suggesting some retracement without returning to recent lows. Following this, the stock would need to move above both the 21 EMA and 200 DMA. Should these milestones be reached, it could present a favorable risk-reward trading opportunity, with a stop loss placed just below the most recent established low.
Investment Considerations
SPOT may be worth adding to your watchlist, though the current setup does not yet meet the criteria for action under this trading strategy. It is important for readers to conduct their own analysis and consistently apply personal trading rules. All investments involve risk, and informed decision-making is essential when committing capital.
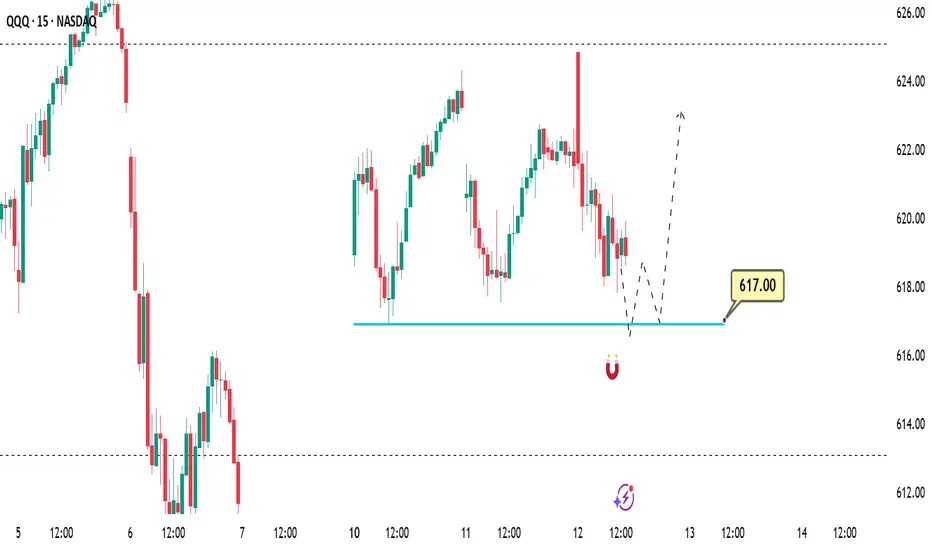
QQQ (NQ/US100) Quick Trade Idea - (12 NOV)📌 Prediction / Game Plan
In my opinion, the price is currently attempting to reprice the gap around the 617 level.
If the price reaches this zone, we may see a rejection-bounce toward 620 first, followed by 625.
I’ll be closely watching the 617 zone for a potential call entry setup.
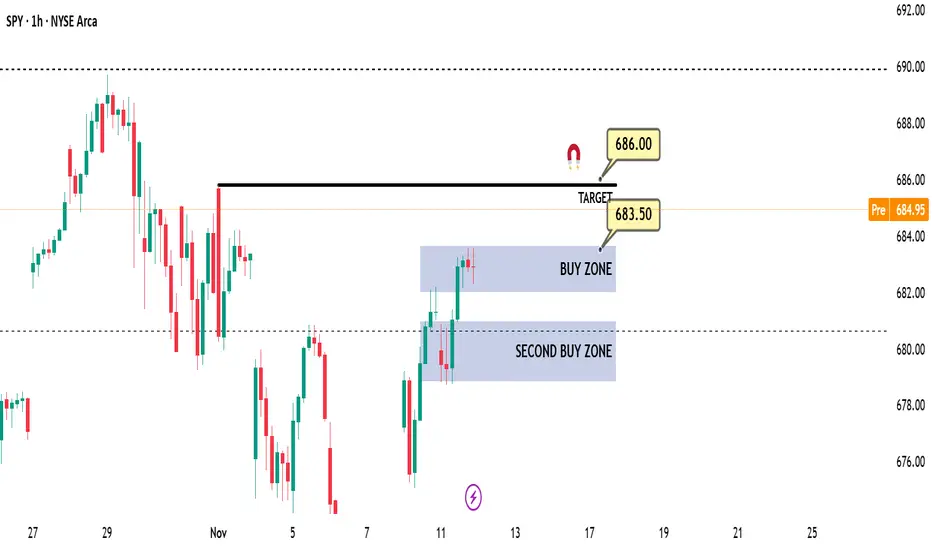
Daily SPY (US500) Outlook - Prediction (12 NOV)Daily SPY (US500) Outlook - Prediction (12 NOV)
📊 Market Sentiment
The market continues to lean bullish following the potential resolution of the U.S. government shutdown, along with the proposed $2,000 incentives for U.S. citizens. These developments could drive stronger inflows into equities and sustain short-term positive sentiment.
📈 Technical Analysis
Price moved higher overnight, likely targeting the 686 level, supported by strong momentum carried over from the Dow Jones (US30).
📌 Game Plan
In my opinion, I will look to buy if the price retraces to the 683.5–682 zone for a potential continuation move toward 686.
However, if we see a strong breakout below 682 and a 4H candle close beneath that level, I plan to exit my position. Another possible bounce could occur around 681, but confirmation would be required before entering such a trade.
💬For detailed insights and broader market context, please check my Substack link in profile.
⚠️ For educational purposes only. This is not financial advice.
$SPY $SPX Scenarios — Wednesday, Nov 12, 2025🔮 AMEX:SPY SP:SPX Scenarios — Wednesday, Nov 12, 2025 🔮
🌍 Market-Moving Headlines
💬 Fed marathon day: Six Fed officials speak across the day, led by Williams, Waller, and Bostic — giving markets multiple reads on the Fed’s reaction to soft labor data and upcoming inflation prints.
📉 Policy sensitivity rising: With no major macro releases this week, investors are hypersensitive to tone shifts in Fed commentary — especially regarding rate-cut timing and balance sheet guidance.
🧩 Positioning churn: After a light Tuesday session, liquidity normalizes as equities digest global risk appetite and pre-CPI setups.
📊 Key Data and Events (ET)
⏰ 9:20 AM — John Williams (NY Fed)
⏰ 10:00 AM — Anna Paulson (Philadelphia Fed)
⏰ 10:20 AM — Chris Waller (Fed Governor)
⏰ 12:15 PM — Raphael Bostic (Atlanta Fed)
⏰ 12:30 PM — Stephen Miran (Fed Governor)
⏰ 4:00 PM — Susan Collins (Boston Fed)
⚠️ Note:
No economic data releases today — markets will key off Fed tone and Treasury yield movement ahead of Thursday’s CPI and jobless claims (both still at risk of delay).
⚠️ Disclaimer: Educational and informational only — not financial advice.
📌 #SPY #SPX #trading #Fed #Williams #Waller #Bostic #Miran #Collins #macro #inflation #yields #markets

ES (SPX, SPY) Analysis, Levels, Setups for Wed (Nov 12)Price closed near the prior week’s highs after a clear four-hour impulsive leg from last Friday’s low. Momentum appears constructive while the 15-minute swing structure holds higher lows above the New York value shelf.
Setups:
Play A — Acceptance Long: Wait for a 15m full-body close ≥6,900 and a 5m pullback that holds ≥6,892–6,895. Enter on a 1m HL reclaim. Hard SL = 15m trigger-wick low minus 0.25–0.50. TP1 6,915. TP2 6,935. TP3 6,955–6,975. Viability gate: TP1 must be ≥2.0R versus the 15m stop.
Play B — Rejection Fade: If 6,900–6,915 rejects with a 15m close back inside ≤6,889, enter on a 5m re-close lower and a 1m LH. Hard SL = 6,905–6,912 (above rejection wick). TP1 6,872. TP2 6,852. TP3 6,839→6,810 if momentum accelerates.
Bias & Invalidation: Bias is mildly bullish while 6,865–6,872 holds on 15m closes. Bias flips neutral-to-bearish on decisive 15m body-through below 6,839.
Kill-Zones (ET): NY AM 09:30–11:00 for entries. Manage through Lunch. NY PM 13:30–16:00 for follow-through or fades into exhaustion.
News & Events (tomorrow): No CPI risk on the docket. Watch the U.S. 10-Year Note auction around 13:00 ET and headline risk from the OPEC and IEA monthly oil reports in the morning; both can sway rates and index tone.

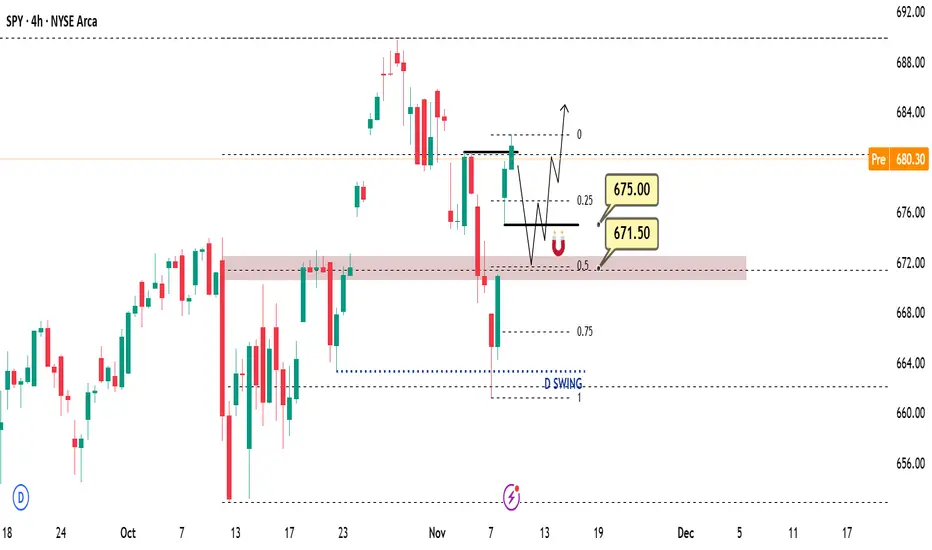
Daily SPY (US500) Outlook - Prediction (11 NOV)Daily SPY (US500) Outlook - Prediction (11 NOV)
📊 Market Sentiment
The market is turning bullish following the potential resolution of the U.S. government shutdown, along with the proposed $2,000 incentives for U.S. citizens. These factors could create strong inflows into equities and improve short-term sentiment.
📈 Technical Analysis
Price moved sharply higher on Monday, reaching the 681 level as expected (see my previous SPY outlook). The 681 level remains a strong resistance zone, and we have already seen a rejection from that area.
📌 Game Plan
In my opinion, the market may turn short-term bearish today. After rejecting 681, the price could target the 675 level and possibly though not necessarily reach 671.5.
My plan is to short the market toward 675 and observe if a bounce occurs. If it does, I will look to buy calls, expecting a move toward new highs around 685.
💬For detailed insights and broader market context, please check my Substack link in profile.
⚠️ For educational purposes only. This is not financial advice.
S&P 500 Extreme Breadth Reading! Caution!Why It Matters
Strong breadth = healthy rally, broad participation → more sustainable trend.
Weak breadth = top-heavy rally, fragile momentum → prone to correction.
Think of it like an airplane:
If all four engines (hundreds of stocks) are pushing, you can climb easily.
If one engine (a few mega-caps) is doing all the work, you can stay aloft — but not for long!
CAUTION! is in order!
Click boost, follow, comment nicely for more authentic, no BS, raw analysis. Let's get to 6,000 followers. ))

$SPY $SPX Scenarios — Tuesday, Nov 11, 2025🔮 AMEX:SPY SP:SPX Scenarios — Tuesday, Nov 11, 2025 🔮
🌍 Market-Moving Headlines
🇺🇸 Veterans Day — U.S. bond market closed, equities open but expect thin liquidity and lower volume.
💬 Fed focus: Fed Governor Michael Barr headlines the day’s lone major event, speaking mid-morning on financial stability and supervision.
📉 Small-business sentiment dips: The NFIB Optimism Index slipped to 98.2 from 98.8, reflecting softer hiring plans and higher cost concerns.
⚠️ Shutdown delays: Broader federal data remains constrained this week — investors will continue watching Fed commentary for policy cues.
📊 Key Data and Events (ET)
⏰ 6:00 AM — NFIB Small Business Optimism (Oct) | 98.2 vs 98.8 prior
⏰ 10:25 AM — Michael Barr (Fed Governor) speech
📉 Bond market closed for Veterans Day; expect quieter sessions and possible afternoon drift in equities.
⚠️ Note:
No Tier-1 data today. With lighter volume and no Treasury trading, price action will likely be headline-driven. Keep an eye on Barr’s tone for any hints on post-shutdown policy or liquidity support.
⚠️ Disclaimer: Educational and informational only — not financial advice.
📌 #SPY #SPX #trading #Fed #MichaelBarr #NFIB #VeteransDay #markets #macro #liquidity #bonds

QQQ : Stay heavy on positionsQQQ : Stay heavy on positions (QLD, TQQQ)
Risk-on Phase 1, high-volatility zone
Risk-on Phase 2, high-volatility zone.
Critical Sensitivity Zone
In stay light on positions zones, I hold QQQ and reduce exposure.
In stay heavy on positions zones, I increase allocation using a mix of QLD and TQQQ.
** This analysis is based solely on the quantification of crowd psychology.
It does not incorporate price action, trading volume, or macroeconomic indicators.
