ES (SPX, SPY) Analysis, Key Levels, Setups for (Nov 11th)S (Dec) Plan for Tue, Nov 11 — Level-KZ Protocol (15/5/1).
Bias is constructive while trading above the 6,838–6,845 range; the first test into 6,880–6,900 serves as a decision point. Thinner liquidity is expected around the U.S. holiday, so execute trades only within NY kill zones.
Setups (trade the level → next level; 15m→5m→1m sequence)
Long — Bounce at 6,838–6,845: sweep/quick-reclaim → 5m re-close → 1m HL entry. Hard SL below 6,830 wick. TP1 6,872–6,880, TP2 6,900, TP3 6,930. Viability gate: TP1 ≥ 2.0R.
Long — Acceptance above 6,900: full 15m body close >6,900 → hold the retest → 1m HL. SL below trigger wick. TP1 6,930, TP2 6,955–6,970, runner eyes weak-high cleanup.
Short — Rejection fade 6,900–6,930: wick through → 15m close back below 6,895 → 5m LH. SL above session high. TP1 6,872, TP2 6,845, TP3 6,805; lose 6,805 and momentum can slide toward 6,770 then 6,733.
News & session conditions (ET)
U.S. Veterans Day — equities open; U.S. bond market closed; U.S. macro slate is light. Overnight focus: NZ inflation expectations (evening ET), U.K. Labour Market (pre-London), Germany ZEW (pre-NY). Expect patchy liquidity around the holiday; be strict with the 2R viability gate and trade only inside NY AM/PM kill-zones.
SPDR S&P 500 ETF (SPY)

S&P 500 (ES1!): Is This The Dip We Were Waiting For? Yes!Welcome back to the Weekly Forex Forecast or the week of Nov. 10-14th.
In this video, we will analyze the following FX market: S&P 500 (ES1!)
The S&P500 is respecting the Weekly +FVG... barely! Friday's rally may indicate the pullback is over and the resumption of the bullish momentum is upon us.
Look for valid buy setups only! Sells are not valid unless there is a bearish break of structure!
Enjoy!
May profits be upon you.
Leave any questions or comments in the comment section.
I appreciate any feedback from my viewers!
Like and/or subscribe if you want more accurate analysis.
Thank you so much.
Disclaimer:
I do not provide personal investment advice and I am not a qualified licensed investment advisor.
All information found here, including any ideas, opinions, views, predictions, forecasts, commentaries, suggestions, expressed or implied herein, are for informational, entertainment or educational purposes only and should not be construed as personal investment advice. While the information provided is believed to be accurate, it may include errors or inaccuracies.
I will not and cannot be held liable for any actions you take as a result of anything you read here.
Conduct your own due diligence, or consult a licensed financial advisor or broker before making any and all investment decisions. Any investments, trades, speculations, or decisions made on the basis of any information found on this channel, expressed or implied herein, are committed at your own risk, financial or otherwise.

Trades with B – Daily Recap (Nov 10 2025)Ticker: QQQ / NQ1!
Strategy: ORB Pro with Filters + 5 min / 15 min Multi-Timeframe Confluence
Result: Green day ✅ (+$97.78 total gain)
🧭 Market Context
The market opened inside an early consolidation range with mixed momentum. The 5-minute chart gave the first confirmation through a clean ORB signal rejection, while the 15-minute held the higher-timeframe structure and kept the EMA slope intact.
The plan today was simple — trade the first valid signal from ORB Pro, confirm with the higher timeframe trend, and respect stops.
🎯 Trade Execution Recap
9:37 AM: First Call entry (ORB signal + fib retest) — caught the initial push before stall. + $172.94
9:44 AM: Locked profits on strength into EMA resistance.
11:14 AM: Put entry after ORB Pro signaled a short on the 5 min matching 15 min trend.
11:40 AM: Exit for + $194.94 after momentum follow-through.
Cumulative Options P/L:
QQQ $618 Put (11/10/25) → + $67.89
QQQ $621 Call (11/10/25) → + $29.89
Net: + $97.78
💡 What Went Right
Followed the ORB signal with confirmation from the higher-timeframe trend filter.
Perfect execution on the Put trade — clean entry and timely exit.
Didn’t overstay the welcome once the move completed.
⚠️ What to Improve
Stay patient for stronger confluence before taking early entries.
Avoid re-entries once price returns to mid-range (less edge after initial break).
🧘♂️ Reflection
“The 5 min showed me the trigger, the 15 min confirmed the story. ORB Pro did its job — I just had to listen.”

NVDA (NVIDIA) – Buy PlanNVDA (NVIDIA) – Buy Plan
📊 Market Sentiment
On October 29, the FED lowered rates by 25bps as expected. However, Powell’s remarks introduced uncertainty around further cuts in December, emphasizing that future policy will depend on incoming data.
One FED member dissented, preferring no cut this cycle — a notable shift from September’s unanimous decision.
Additionally, ADP Non-Farm Employment Change came at 42K versus 32K expected. It’s slightly higher, but since other macro data are missing due to the U.S. government shutdown, the overall sentiment remains mixed.
For now, macro sentiment leans bearish, as rate cuts may be delayed into 2026.
However, with NVDA earnings approaching, we could see a short-term bullish sentiment building around the stock.
📈 Technical Analysis
NVDA is currently trading around the 0.5 equilibrium zone, which aligns with the HTF bullish trendline.
This area could provide temporary support and a potential bounce setup.
However, it’s crucial to watch the SPY structure as it may influence NVDA’s short-term movement.
📌 Game Plan / Expectations
I’ll be watching the $185–$180 range as a key HTF support zone.
This area also aligns with a possible trendline deviation, where price could manipulate below the trendline to trap sellers before reclaiming it.
I plan to buy call options within this range, targeting a continuation of the bullish leg post-earnings.
💬 If this breakdown aligns with your outlook, like and comment below.
For deeper sentiment and strategy insights, subscribe to my Substack — free access available.
⚠️ Disclaimer
This analysis is for educational purposes only and does not constitute financial advice. Always conduct your own research before trading or investing.

SPY (S&P 500 ETF) – Game PlanSPY (S&P 500 ETF) – Game Plan
📊 Market Sentiment
On October 29, the FED lowered rates by 25bps as expected. However, Powell’s remarks introduced uncertainty around further cuts in December, emphasizing that future policy will depend on incoming data.
One FED member dissented, preferring no cut this cycle — a notable shift from September’s unanimous decision.
Additionally, ADP Non-Farm Employment Change came at 42K versus 32K expected. It’s slightly higher, but since other macro data are missing due to the U.S. government shutdown, the overall sentiment remains unclear.
For now, sentiment leans bearish, as rate cuts may be delayed into 2026.
📈 Technical Analysis
SPY recently touched the 670 level an important support zone representing the equilibrium of the current daily range and an area with significant liquidity.
However, with bearish macro sentiment, I don’t expect this level to hold for long. The structure suggests that price wants to seek lower liquidity zones.
📌 Game Plan / Expectations
My primary scenario is a short move targeting 663, which aligns with the 0.75 max discount zone. From there, a potential rally toward all-time highs could begin.
Scenario 2: If the 663 level fails to hold, I will look for another bounce opportunity near 657.
Overall, I don’t see this as a start of a bear market — rather a healthy correction within the broader bullish structure. I’ll be positioning for buys once the downside liquidity objectives are met.
💬 For deeper sentiment and strategy insights, subscribe to my Substack — free access available.
⚠️ Disclaimer
This analysis is for educational purposes only and does not constitute financial advice. Always conduct your own research before trading or investing.

Weekly SPY (US500) Outlook - Prediction (09 NOV)Weekly SPY Outlook - Prediction (09 NOV)
📊 Market Sentiment
Market sentiment remains slightly bearish as expectations for a December rate cut may be pushed into 2026. We have seen some sell-offs, likely due to hedging or profit-taking activity. However, the market experienced a healthy bounce last Friday, as anticipated in my previous Daily SPY Outlook on November 7.
Today, Trump announced that American citizens, excluding high-income individuals, will receive a $2,000 payment. This news could inject additional liquidity into risk assets, similar to what occurred during his first term. In my opinion, this development may create a short-term bullish narrative for the markets.
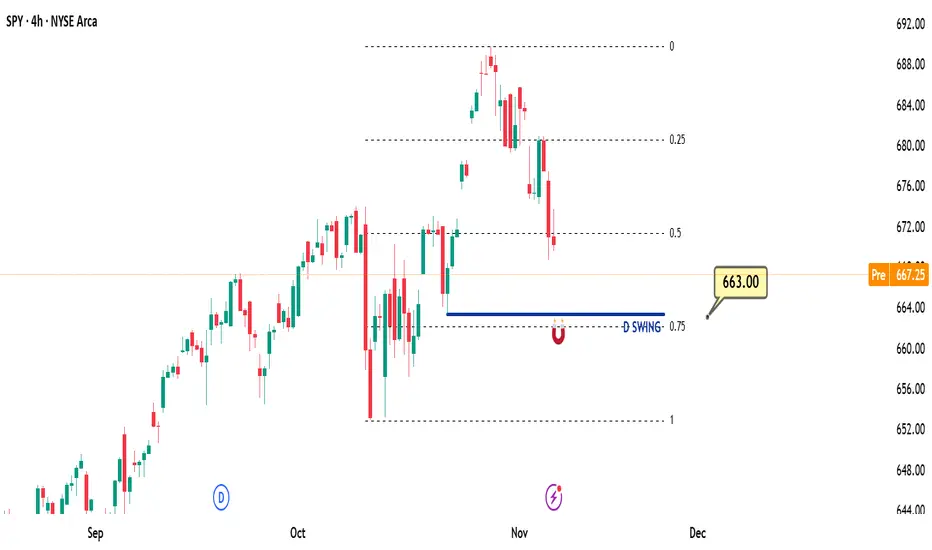
📈 Technical Analysis
Price retraced throughout the week and reached the 663 level, where it bounced as expected from my November 7 outlook. The 663 zone represents the most discounted range (based on my quarterly range theory, 0.75 fib level), which I consider an optimal buy area. This level also coincides with daily swing liquidity, and the reaction suggests a potential move toward new all-time highs.
📌 Game Plan
I’m considering two possible scenarios for this week:
Scenario 1 (Black Line):
In my opinion, the price now has enough momentum to extend higher and create new all-time highs. Therefore, I’ll be watching for a daily close above the 671 level. If confirmed, I plan to buy SPY calls targeting new highs.
Scenario 2 (Red Line):
If the price fails to close above 671, it may indicate that more accumulation is needed before another upward move. In that case, I’ll look to short (buy puts) toward the 657 level and observe whether we can bounce from there. Should that happen, I’ll then switch to calls and target higher levels.
💬For detailed insights and broader market context, please check my Substack link in profile.
⚠️ For educational purposes only. This is not financial advice.

UBER Stock Analysis: Trading Range and Earnings ReactionEarnings Report and Market Reaction
On November 4th, Uber ( NYSE:UBER ) reported its latest earnings, surpassing expectations by an impressive 338%. The company’s earnings growth reached 159%, and revenue increased by 20.4%. Despite these strong financial results, the stock price closed lower compared to the previous day. This outcome highlights the often unpredictable nature of the market, where investor reactions to news can differ significantly from initial expectations. In this case, it appears that investors were anticipating even higher numbers.
Establishing a Trading Range
Since late September, Uber’s stock has been trading within a defined range. Recognizing this pattern, I initiated a position on November 4th at $93.33 per share and set a stop order just below that day’s low. To date, the stop has not been triggered, and I continue to hold the stock. My analysis of the stock’s behavior today confirmed the existence of this trading range.
Position Management and Risk Assessment
Based on my observations, I decided to add to my position in anticipation of the price moving toward the top of the established range. There is also the potential for a breakout, which could lead to new highs. For now, I am maintaining my original stop just below $90 per share, establishing a risk of 3.8%. This risk-reward profile is favorable, as I am targeting an upside move of approximately 8%.
Important Considerations for Investors
Readers are strongly encouraged to analyze this trading idea independently and consistently apply their own trading rules. It is crucial to remember that all investments carry risk, and making informed decisions with your own capital is essential.

US500 Intraday Technical Analysis📊 US500 Intraday Technical Analysis - 10 Nov 2025
S&P 500 at 6,792 (4:45 PM UTC+4) — Major breakout setup with confluence
━━━━━━━━━━━━━━━━━━━━━━━━━━━━━━━━━━━━
🔍 MARKET STRUCTURE
🔸 Wyckoff Phase D re-accumulation; Dow Theory primary uptrend intact
🔸 Gann Square-of-9 targets: 6,950 (resistance) / 6,650 (support)
🔸 Elliott Wave (3) extension in progress toward 6,950-7,050
━━━━━━━━━━━━━━━━━━━━━━━━━━━━━━━━━━━━
📈 TIMEFRAME MATRIX
Daily (1D): Rising channel 6,700-6,900; RSI 62 (bullish); Ichimoku cloud support 6,550
4H: Broadening wedge 6,750-6,900; EMA21>EMA50>EMA200 (golden cross); VWAP 6,680
1H: Cup-and-handle pattern; BB expanding; VWAP slope bullish
30M: Symmetrical triangle 6,780-6,850; hidden bull divergence on RSI; volume contracting
15M: Bull flag above 6,790; Tenkan>Kijun bullish; stochastic reset ready
5M: Falling wedge retest 6,800; hammer shows demand; watch false breakout
━━━━━━━━━━━━━━━━━━━━━━━━━━━━━━━━━━━━
🎯 PRIMARY LONG (HIGH PROBABILITY)
Entry: 6,790-6,820 (flag support + VWAP confluence)
SL: 6,750 (below triangle base)
TP1: 6,880 (+90 pips)
TP2: 6,950 (+160 pips — channel resistance)
TP3: 7,050 (+260 pips — harmonic extension)
Confirmation: RSI >55, volume +20%, VWAP holding
⚡ MOMENTUM SCALP
Add above 6,950 ONLY if RSI >65 + volume surge; trail stop 6,920
🔻 REVERSAL SHORT
Entry: 6,950-7,000 (supply resistance)
SL: 7,050 (above wedge)
Targets: 6,900 → 6,820 → 6,750 (Gann support)
Trigger: Bearish engulfing + RSI divergence on 5M/15M
━━━━━━━━━━━━━━━━━━━━━━━━━━━━━━━━━━━━
🚨 BREAKOUT ALERTS
✅ BULL: 1H close >6,950 confirms breakout → target 7,150; move SL to BE+25
✅ BEAR: 1H close <6,780 with volume → retest 6,650 cloud support
━━━━━━━━━━━━━━━━━━━━━━━━━━━━━━━━━━━━
📊 INDICATOR SNAPSHOT
BB Squeeze (30M) expanding | MACD histogram positive | VWAP slope up | EMA21 = trigger line | Hidden bull divergence confirmed on RSI
⚠️ PATTERN RECOGNITION
Harmonic Bat PRZ: 7,050 | Rising Wedge failure <6,790 = Wyckoff spring | H&S risk if 6,700 breaks | Bull trap risk above 6,950 without volume
📈 TIMING & VOLATILITY
Gann 90° window 21:00 UTC (US close) | ATR(14) ≈100 pts | Earnings whispers elevate risk | Risk ≤1% per setup; lock TP1; avoid chasing sub-avg volume
Educational analysis only. Follow your plan, manage risk, adapt to live price action.
━━━━━━━━━━━━━━━━━━━━━━━━━━━━━━━━━━━━
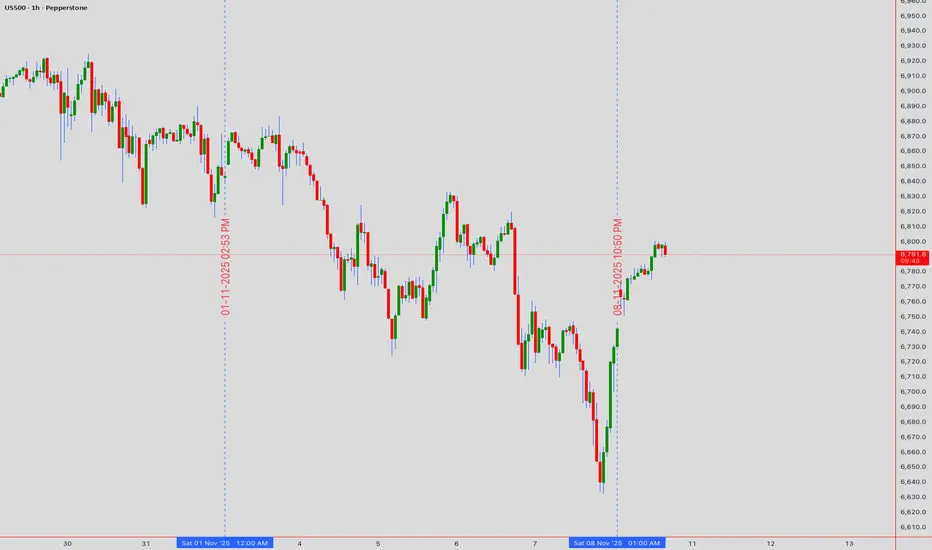
ES (SPX, SPY) Week Ahead Analysis, Levels (Nov 10th - 14th)Context (HTF)
Price action has shown a notable rebound from the 6655 level, currently approaching the 6800 to 6810 range, which is characterized by recent supply identified on the 1-hour and 4-hour charts. Despite the ongoing lower-highs structure observed on the 4-hour timeframe, momentum appears to be shifting positively following Friday’s significant low. Traders should anticipate a period of two-way trading early in the week, likely within the 6650 to 6850 corridor, until mid-week economic data provides clearer direction.
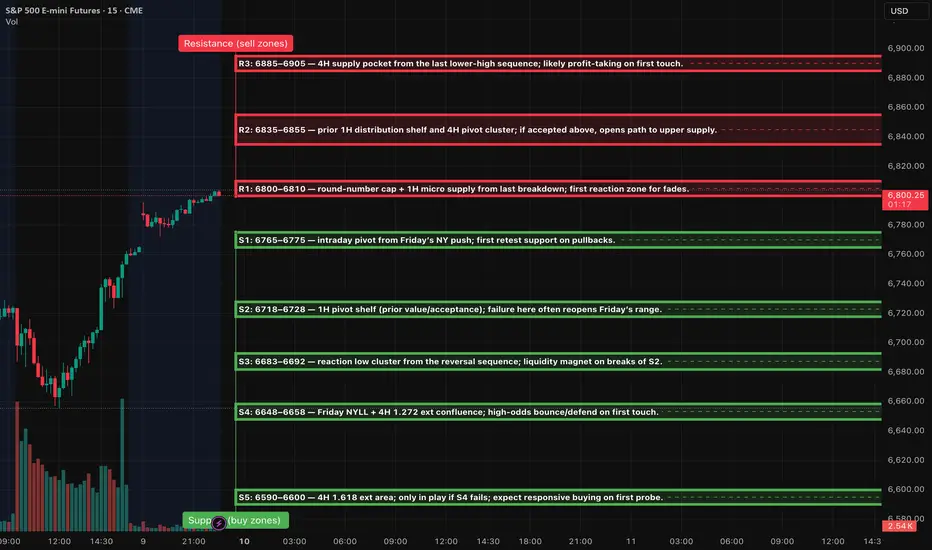
Setups (Level-KZ Protocol 15/5/1)
1) Rejection Fade @ 6800–6810 (Tier-1 if first touch)
15m rejection back inside → 5m re-close below with LH → 1m first pullback fail.
Entry: 6798–6808 on 1m fail. SL: 15m wick-high +0.25–0.50.
TP1: 6768–6775 (S1). TP2: 6723 (S2). Viability gate: TP1 ≥ 2.0R using the 15m-wick stop.
2) Acceptance Continuation > 6810
15m full-body close above → 5m pullback holds 6805–6810 → 1m HL entry.
Entry: 6808–6812. SL: 6794–6798 (15m wick).
TP1: 6838–6848 (R2). TP2: 6885–6905 (R3). No trailing before TP2; at TP1 close ~70%, set runner to BE.
3) Quick-Reclaim Bounce @ 6765–6775 (Tier-2)
Sweep S1 → instant reclaim on 5m → 1m HL.
Entry: 6767–6774. SL: 6756–6759.
TP1: 6798–6810. TP2: 6835–6845.
4) Exhaustion Flush Bounce @ 6648–6658 (Tier-3)
Capitulation wick into S4 → 5m reversal signal → 1m HL.
Entry: 6651–6657. SL: 6639–6642.
TP1: 6686–6692. TP2: 6718–6728.
What can move ES this week (keep risk light around release windows)
• Tue (Nov 11): Veterans Day — equities open, U.S. bond market closed; liquidity can be thinner.
• Thu (Nov 13, 8:30 ET): October CPI.
• Thu (Nov 13, 8:30 ET): Initial jobless claims (weekly).
• Fri (Nov 14, 8:30 ET): October PPI and Advance Retail Sales.
• Fed speakers/boards: See the Fed’s official calendar for any added talks this week.
• Earnings of note: Several large caps report mid-week (e.g., Cisco; Disney). Expect single-name volatility spillover.
Notes for execution: mark the zones on 15m; wait for your 15→5→1 confirmation sequence; enforce the 2.0R viability gate using the 15m wick stop; no partials before TP1; max two tries per level.
$SPY $SPX Scenarios — Week of Nov 10–14, 2025🔮 AMEX:SPY SP:SPX Scenarios — Week of Nov 10–14, 2025 🔮
🌍 Market-Moving Headlines
🚩 Shutdown overhang persists: Key October inflation and retail reports remain at risk of delay due to limited government data releases. Market direction may rely on Fed commentary and positioning shifts more than fresh data.
📉 Inflation in focus: The CPI (Thursday) remains the main event — if it releases — as traders gauge whether cooling prices justify the market’s aggressive rate-cut bets.
💬 Fed blitz: Nearly a dozen Fed officials speak this week, including Waller, Williams, Miran, and Bostic, providing clues on how close the Fed feels to easing.
🏦 Veterans Day week rhythm: With Tuesday’s bond market closure, liquidity may thin until the CPI print, creating potential for sharp post-data reactions.
📊 Friday volatility setup: Retail Sales and PPI (if released) will shape the final inflation read-through for Q4 spending momentum.
📊 Key Data and Events (ET)
MONDAY, Nov 10
— No major releases scheduled
TUESDAY, Nov 11 (Veterans Day, bond market closed)
⏰ 6:00 AM — NFIB Optimism Index (Oct)
⏰ 10:25 AM — Michael Barr (Fed Gov) speech
WEDNESDAY, Nov 12
⏰ 9:20 AM — John Williams (NY Fed) speech
⏰ 10:00 AM — Anna Paulson (Philadelphia Fed) speech
⏰ 10:20 AM — Chris Waller (Fed Gov) speech
⏰ 12:15 PM — Raphael Bostic (Atlanta Fed) speech
⏰ 12:30 PM — Stephen Miran (Fed Gov) speech
⏰ 4:00 PM — Susan Collins (Boston Fed) speech
THURSDAY, Nov 13 — CPI Day (High Impact)
⏰ 8:30 AM — Consumer Price Index (Oct) ⚠️ Subject to shutdown delay
• Headline CPI: +0.2% expected
• Core CPI (YoY): TBD
⏰ 8:30 AM — Initial Jobless Claims (Nov 8) ⚠️ May be delayed
⏰ 9:20 AM — John Williams (NY Fed) speech
⏰ 12:15 PM — Alberto Musalem (St. Louis Fed) speech
⏰ 12:20 PM — Beth Hammack (Cleveland Fed) speech
⏰ 2:00 PM — Federal Budget Statement (Oct) | $257.5B deficit
⏰ 3:20 PM — Raphael Bostic (Atlanta Fed) speech
FRIDAY, Nov 14 — Retail & PPI (High Impact)
⏰ 8:30 AM — Retail Sales (Oct) ⚠️ May be delayed
⏰ 8:30 AM — Producer Price Index (Oct) ⚠️ May be delayed
⏰ 10:05 AM — Jeff Schmid (Kansas City Fed) speech
⏰ 2:30 PM — Lorie Logan (Dallas Fed) speech
⚠️ Note:
All starred data (CPI, Jobless Claims, Retail Sales, PPI, Business Inventories) remain subject to delay under the continuing government shutdown. Markets may trade on Fed tone and yield movement in the absence of these releases.
⚠️ Disclaimer: Educational and informational only — not financial advice.
📌 #SPY #SPX #trading #Fed #CPI #RetailSales #inflation #bonds #macro #yields #markets #shutdown #Bostic #Waller #Williams #Logan

SPY FREE SIGNAL|SHORT|
✅SPY is currently retesting a premium supply zone after clearing buy-side liquidity. If the retest confirms rejection with displacement, a bearish continuation toward imbalance below is likely.
—————————
Entry: 670.89$
Stop Loss: 674.31$
Take Profit: 666.68$
Time Frame: 2H
—————————
SHORT🔥
✅Like and subscribe to never miss a new idea!✅

SPY: Forecast & Trading Plan
The analysis of the SPY chart clearly shows us that the pair is finally about to go up due to the rising pressure from the buyers.
❤️ Please, support our work with like & comment! ❤️

Stock Market Forecast | TSLA NVDA AAPL AMZN META MSFTStock Market Forecast | CME_MINI:NQ1! CME_MINI:ES1! SP:SPX NASDAQ:NDX
Mag 7 | TSLA NVDA AAPL AMZN META MSFT

SPY Massive Long! BUY!
My dear followers,
I analysed this chart on SPY and concluded the following:
The market is trading on 670.89 pivot level.
Bias - Bullish
Technical Indicators: Both Super Trend & Pivot HL indicate a highly probable Bullish continuation.
Target - 678.65
About Used Indicators:
A super-trend indicator is plotted on either above or below the closing price to signal a buy or sell. The indicator changes color, based on whether or not you should be buying. If the super-trend indicator moves below the closing price, the indicator turns green, and it signals an entry point or points to buy.
Disclosure: I am part of Trade Nation's Influencer program and receive a monthly fee for using their TradingView charts in my analysis.
———————————
WISH YOU ALL LUCK

SPY Free Signal! Sell! (For Monday)
Hello,Traders!
SPY has tapped into a premium supply zone, triggering a potential bearish delivery after a clean liquidity grab above equal highs. Expect continuation toward sell-side imbalance.
---------------------
Stop Loss: 674.31$
Take Profit: 666.68$
Entry Level: 670.89$
Time Frame: 2H
---------------------
Sell!
Comment and subscribe to help us grow!
Check out other forecasts below too!
Disclosure: I am part of Trade Nation's Influencer program and receive a monthly fee for using their TradingView charts in my analysis.

Did You Buy The Dip? Heres What we bought!Today the SPX had an incredible morning selloff - met with and even more incredible rally.
The markets were in turmoil today up until the bulls stepped in and made a red to green reversal.
Days like today often create the biggest portfolio gains when you can buy stock at depressed levels.
We accumulated 6 position longs today.
Massive technicals were tested and defended today.

Daily SPY Outlook - Prediction (07 NOV)Daily SPY Outlook - Prediction (07 NOV)
📊 Market Sentiment
Market sentiment is slightly bearish as expectations for a December rate cut may be delayed into 2026. We have seen some sell-offs, likely due to hedging or profit-taking activity.
📈 Technical Analysis
Price is currently pulling back from the all-time high and moving within the equilibrium zone near the 670 level, which acts as short-term support. This is where I think accumulation may occur.
📌 Game Plan
In my opinion, price could reach the 663 level before showing a potential rebound. Therefore, I plan to stay short-biased toward 663, as puts might perform well today — unless I see a strong 4H candle close after the market open.
💬For detailed insights and broader market context, please check my Substack link in profile.
⚠️ Disclaimer: For educational purposes only. This is not financial advice.
$UPS Post Earnings Pullback TradeTrade Setup and Rules
Before UPS's earnings report, I already held a position in the stock, as indicated by my notations on the chart. However, my personal trading rules require a minimum profit margin of 10% to maintain any position through an earnings announcement. Since my trade did not meet this threshold, I chose not to hold it through the event.
Earnings Reaction and Market Behavior
Following the report, UPS experienced a notable gap up in price. My usual approach is to wait several days after an earnings release to observe how the market responds. Often, this period brings a pullback in the stock, and that pattern has occurred here.
Technical Analysis and Trade Execution
On my chart, I identified what appeared to be a Flag pattern, and I drew a line to track its progression. I set an alert to notify me if UPS broke out above this pattern. This breakout occurred this morning, even as the broader market remained weak.
In response, I initiated a half-size position according to my plan. To manage risk, I placed my stop-loss order just below the most recent low, resulting in a risk exposure of less than 4% on this trade.
Risk Disclaimer
Readers are strongly encouraged to analyze this trading idea independently and consistently apply their own trading rules. It is important to remember that all investments carry risk, and making informed decisions with your own capital is essential.

S&P 500: Multiple Bearish Signals AlignS&P 500 index chart shows multiple bearish signals on the weekly time frame
1. The price has hit the upside of the long-term uptrend and it was rejected
2. Bearish Reversal Evening Star Candlestick pattern appeared on the top
3. RSI has built the Bearish Divergence as it did not confirm the new peak
There are 3 support levels:
1. Double support of trend channel's mid-line and previous top around $6,147
2. Bottom of the channel between $5,300 and $5,400
3. "Die-hard" multiple support that was built since 2021 around $4,819
What are your thoughts?

ES (SPX, SPY) Key Levels, Analysis and Setups for Fri (Oct 7th)EVENTS (ET, unaffected by shutdown): 3:00am NY Fed Williams speech; 7:00am Fed Vice Chair Jefferson speech; 10:00am Univ. of Michigan Consumer Sentiment (prelim); 2:00pm Fed G.19 Consumer Credit. Employment Situation report is postponed due to the shutdown (treat as no 8:30am print).
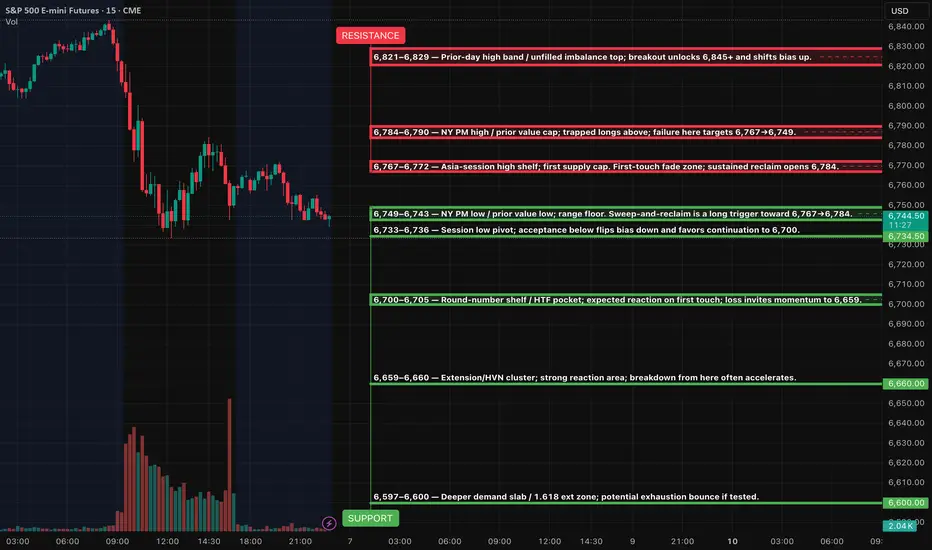
SETUPS (Level-KZ Protocol 15m→5m→1m)
ES LONG (A++) — 6,767 reclaim → 6,784 → 6,821
Entry: 6,768–6,772 after a 5m close and hold above 6,767 with 1m HL confirmation.
Hard SL: 6,755.
TP1: 6,784. TP2: 6,821. TP3: 6,845 if momentum persists.
ES SHORT (A++) — 6,784–6,790 pop-and-fail → 6,749 → 6,733
Entry: 6,782–6,789 on a 15m rejection close back inside the band followed by a 5m re-close down.
Hard SL: 6,796.
TP1: 6,767. TP2: 6,749. TP3: 6,733.
ES LONG (A+ Bounce) — 6,742–6,749 sweep & instant reclaim → 6,767 → 6,784
Entry: 6,750–6,753 after a swift reclaim and 1m HL.
Hard SL: 6,740.
TP1: 6,767. TP2: 6,784. TP3: 6,821.
ES SHORT (A+ Continuation) — 6,733 breakdown & retest → 6,700 → 6,659
Entry: 6,732–6,728 on 15m acceptance below 6,733 and a 5m LH retest.
Hard SL: 6,744.
TP1: 6,700. TP2: 6,659. TP3: 6,597.
KILL-ZONES & MANAGEMENT
Asia 20:00–00:00 optional and lighter size, London 02:00–05:00 optional, NY AM 09:30–11:00 primary for entries, Lunch 12:00–13:00 manage only, NY PM 13:30–16:00 allows second push or reversal plays. Daily guardrails: stop at −2R net or lock in ≥+3R net.
TESLA PT-2 TRILLION DOLLAR PAY CHECKI hope everything is clear now. I have exited all positions here and I am not going into news.
Elon is not going to tell me where my money is going
NOTE:NOT TRADING TSLA

TESLA NOV 6 TRILLION DOLLAR PAY CHECKToday is the day for a lot of people with hope. Be careful & trade smartly.
I have explained the price action here.
YES I AM LONG
NOTE:IV IS HIGH SO STAY AWAY FROM OPTIONS

S&P500 index weekly logarithmic chart hitting 2,618 extensionI have meticulously tagged every turn and twist since 2009 on this chart. Using elliottwave theory I believe that this structure is ending. Bear market next? I do not know, what I do know is that it's been a fabulous run since 2009. I'm short NQ futures December contract. Good luck
