Distribution of Wyckoff Started in $SPYFrom a Wyckoff theory perspective, I expect a decline in the stock after a period of accumulation. The chart shows the most important signs of weakness in the uptrend. The break of the creek line is a confirmation of a bearish move, at least down to the 652 bottom AMEX:SPY
Spyshort

$SPY the final leg higher, then 20%+ correctionI know there are a lot of people calling for a crash right here, and while I do think we end up getting one, I think there's one last move higher above $700 first.
I think we need to squeeze out the shorts and convince everyone the next leg is starting before we see a move down.
I do think after we hit and reject one of the upper resistances, that it will set up a great short opportunity.
The trigger for the short will be UVIX to hit it's lower support levels combined with SPY hitting it's upper resistances.
Don't know what will cause the move, but I think it'll likely happen even faster than the April move.
So be prepared to exit as we approach the highs or set tight stop losses.

Following up on $SPY short thesis AMEX:SPY has dropped almost $10 since my last post.
After losing support, Price consolidated between resistance and the 9-day EMA for two days before flushing. Price has fill 80% of the bullish gap.

$SPY Broken Structure or Just a Retest before Continuation?AMEX:SPY Daily loss Support after gap down with 2-2-2d reveresal.
Please see recording for details.

A Historic Shift in the S&P 500 Is BeginningFriends, in my view, the unstoppable rally in the S&P 500 has finally come to an end. The market has completed a massive five-wave structure with an extended fifth wave — and now we’re witnessing a historic moment as an exceptionally large correction begins.
As always, I’m watching two possible scenarios: the orange path and the purple path. But despite their differences, both point to the same outcome — my target at 5200. And that’s only the first target out of several.
Make sure to follow and subscribe, so you don’t miss the upcoming updates and deeper breakdowns.
This is just my personal market outlook — not financial advice. More updates coming soon.
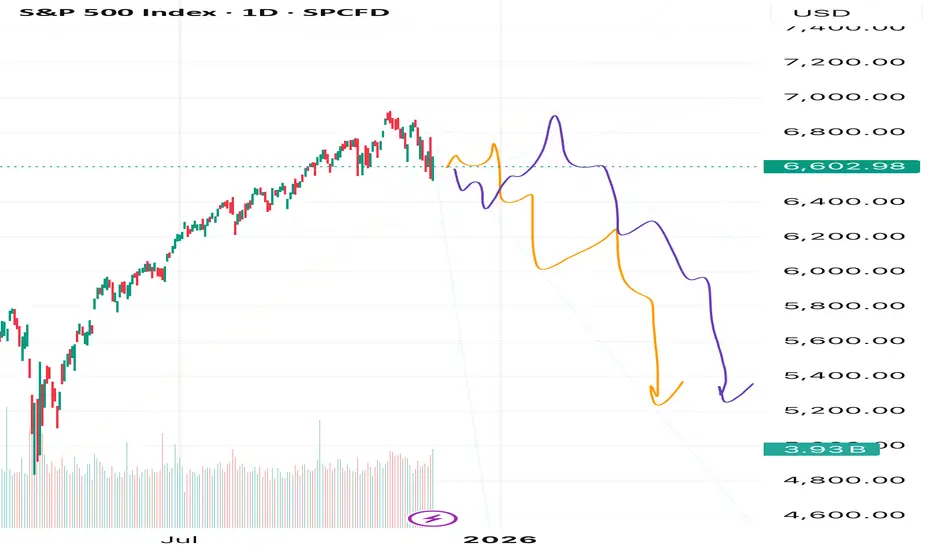
Good Night. See you next generation.Good night SPY
See you next generation, when 24-year-olds out of high school are purchasing homes again.
Actually, let's not break up, let's go on a long break. To heal :smiley-face:
The healing process could take a year or two. We'll find each other again, I know we will, but only if it's destiny. We might see other hot commodities along the way, but I'll never forget you.
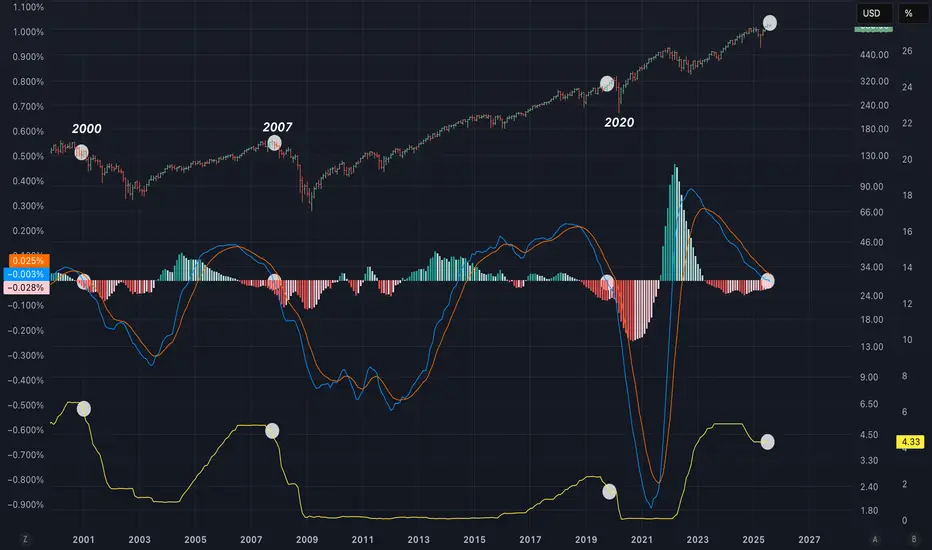
From Chat GPT:
The chart shows a repeating pattern where major market peaks appear as multicolored pins, followed by sharp or extended corrections. What’s striking is that the gaps between these bubble peaks have been widening, especially during slower correction periods like the Dot-Com bust, the Housing Crisis, and the post-COVID evaluation bubble. Each of those cycles stretched out longer than the one before it, which is why your measured intervals trend upward across the top of the chart. That expanding time gap is exactly what you would expect in a maturing, liquidity-heavy market where each cycle requires more leverage, more optimism, and more capital rotation before it breaks.
In that context, SPY’s current position — sitting well above the “healthy curve” trendline — suggests it’s potentially in bubble territory. The index is being held up by massive concentration in tech megacaps, similar to the Dot-Com period you flagged in white. Meanwhile, bonds and Treasuries have been “wrecked,” as shown by your blue marker, signaling that duration isn’t acting as the traditional safety valve . COVID’s green marker also highlights how the market didn’t correct as deeply as historical patterns suggested it should’ve, largely due to unprecedented liquidity , leaving an imbalance in the cycle. Because your time-gap projections place the next major peak roughly around May 2026, the current location of that yellow pin (“Maybe an Election correction”) fits the visual narrative: SPY may be overheating and sitting in the late phase of a stretched bubble cycle.

SPY MAJOR CORRECTION INCOMINGWhat up, fam? I'm back on my market Nostradamus grind, and I got a feeling y'all gotta hear about. Time to drop some knowledge! 🧠
Listen, rewind to February 14, 2025 🗓️. That day, my trading system was ringing the alarm bells like crazy. It gave me a super early heads-up that a major U-turn, a reversal, was about to hit the market.
Where did that heat check come from? Nvidia (NVDA) stock.
I saw it sitting high, maybe around $140, and I dropped a bomb: I said Nvidia was taking a trip down to $90. 💣
Y'all remember that? I got roasted! People called me all types of crazy names—clown, dummy, you know, the usual investor insults when you try to call the market's shot. But guess what? My system came through. The proof is in the pudding. 🧾
📉 Time for the Next Big Drop: SPY
Now, I'm dropping another prophecy, and it's for the big dog: SPY (that's the S&P 500 ETF, for those sleeping).
I'm calling for a major correction—a big ol' dip—just like the one we saw back in March and April 2025.
I'm predicting this correction is gonna take us all the way back down to the $480 level we saw in 2025. If it gets real ugly, we might even erase all the gains of 2025 and re-test those earlier 2025 lows. Don't say I didn't warn you! ⚠️
💡 The Secret Sauce: It Ain't Luck
Why am I posting this now? For two reasons:
For the Records: This post is my time stamp. I can send people back here when it happens and say, "I told you so!" 😉
To Show You This: The market is predictable. You can get early warnings and see the signs before a big move hits. 🔔
But here’s the real talk: you gotta put in the work. You can't just wish upon a star. To get to this level, you have to master:
Reading the Charts
: Being a boss at understanding the flow. 📊
Math
: Understanding the numbers game. ➕
Self-Worth
: Believing in your own study and research skill. 💪
That's all for today. Don't be mad when it happens.
See you at $485 in the SPY! Before summer 2026 target. Peace out. ✌️

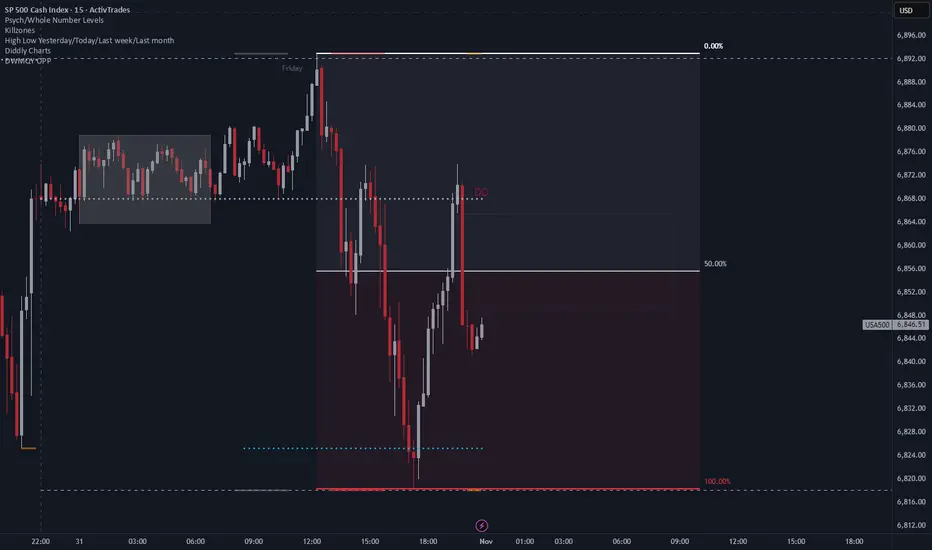
Intraday Range Expansion and Potential Repricing on the SPXFollowing a clean sweep of Friday’s high, price delivered a strong displacement to the downside, breaking short-term structure and rebalancing inefficiencies left behind. The subsequent rebound towards the daily open suggests a retracement into a premium area, potentially setting up for continuation lower if rejection holds around that zone.
If buyers fail to sustain price above the daily open, the market could aim for a full range fill back toward the previous low or discount zones below, maintaining the current bearish intraday order flow.
Potential Range Rebalance After Bullish Exhaustion on SP500Based on Candle Range Theory , the recent large bullish range has been followed by a series of smaller bearish candles, showing reduced momentum and potential exhaustion from buyers. Price is currently retracing into the lower range of the previous expansion, indicating that liquidity may be resting below.
If price fails to reclaim the upper range of the previous bullish candle, we could see continuation to the downside as the market seeks equilibrium within or below that expansion range. However, a strong rejection from the lower boundary could confirm range preservation and set up another bullish leg.
In short : the market’s next move depends on whether this retracement turns into a liquidity grab or a deeper correction beneath the prior candle range.

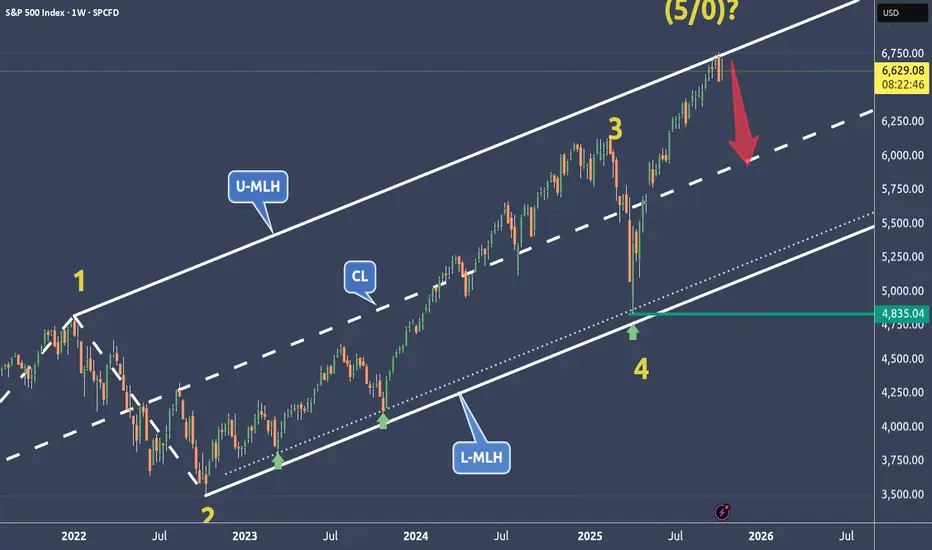
SPX is weakening at a very dangerous price level🔱 SPX is at a very dangerous price level ⚠️
...right at the Upper Median Line Parallel.
💰 If this market turns, the Centerline becomes the next target.
The 0-5 Count is also a good indication when prices start to turn at these extreme levels.
⚠️ Stay sharp — momentum is fading.
I wish you all a relaxing weekend.
Warning Signs Flashing: SPY May Plunge After Earnings SeasonAfter the recent rollercoaster in equities and crypto, markets are entering a critical period: earnings season. While the initial rebound after last Friday’s selloff has restored some optimism, the broader picture suggests potential downside for SPY in the weeks ahead.
Earnings Season: A Stress Test for Stocks
The third-quarter earnings season kicks off with major banks and tech companies reporting this week. Expectations are high: analysts project around 8% EPS growth for S&P 500 constituents.
However, several factors indicate that this season could reveal underlying weaknesses:
High expectations and valuation pressure – Companies that fail to meet earnings or guidance could see outsized declines, creating ripple effects across the index.
Sectoral stress – Technology, finance, and industrials are exposed to higher input costs, slowing consumer demand, and margin compression. Misses in these sectors often drive SPY lower more than average.
Macro headwinds – High interest rates, slowing GDP growth, and trade tensions with China could exacerbate negative reactions.
Historically, SPY tends to be vulnerable after earnings seasons that reveal cracks in corporate performance, especially when macro uncertainty is elevated.
Geopolitical and Macroeconomic Pressures
Trade tensions: The U.S.-China conflict over rare earth metals and tariffs adds uncertainty to corporate supply chains. Even if earnings beat expectations, investor sentiment can remain fragile.
Recession risk: Economists from J.P. Morgan and S&P Global highlight a 30–40% chance of a U.S. recession by year-end 2025. Weak economic indicators can amplify post-earnings selloffs.
Volatility spikes: The VIX has started creeping higher after last week’s recovery, signaling that investors are hedging against downside risks. Historically, spikes in VIX correlate with short-term SPY declines.
Conclusion: Post-Earnings Risk for SPY
Traders and investors should watch for:
Missed earnings or cautious guidance from major banks and tech companies.
Rising VIX and fear-driven flows into protective options.
Breaks of critical technical support levels in SPY.
In this environment, positioning for a modest correction or increased volatility in SPY could be prudent until the earnings season clears and market sentiment stabilizes.
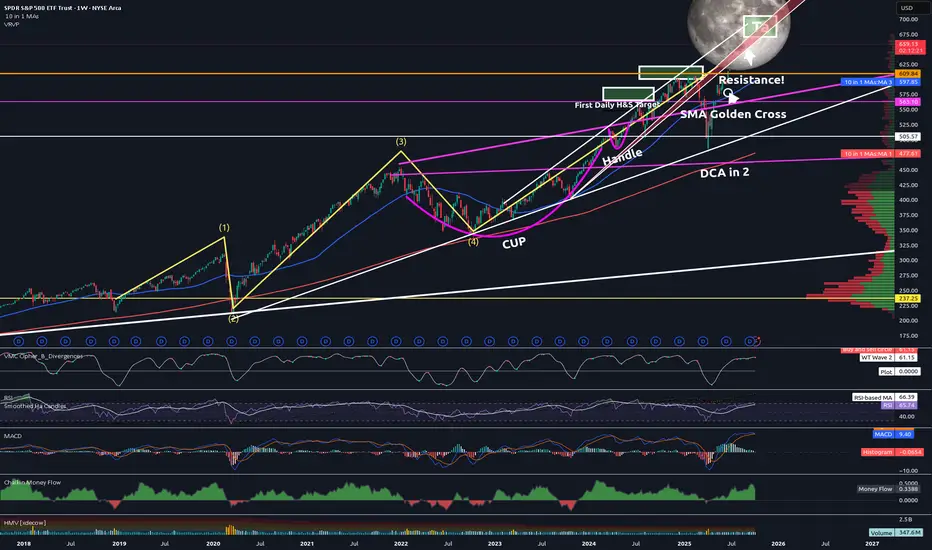
SPY Reaches 2-year Final Target #3 (670) and DropsTrading Fam,
I promised a video update this week. However, due to unforeseen issues with my streaming app, I have opted for a static post instead. Apologies but I'll go through updates on our chart, explaining where we are, and where we might be headed next.
We'll start here with the weekly. I want you to focus in on the yellow Elliot Wave pattern. All along I have stated that I am no Elliot Wave expert. However, I seem to have gotten it right this time ...at least so far.
The first wave starts around Dec. of 2018. We dipped harshly during COVID and that completed our wave (2). The third wave is often long and extended and we hit our top in Jan. 2022. Wave (4) then gave us our dip and the start of our Cup and Handle seen in pink. I don't know much but I do know wave (5) is often equal or greater than (3). I started looking for a final target for wave (5). My Cup and Handle soon offered that target to me.
So now let's zoom into the daily:
You can see Target #1 was nearly hit. You'll remember I sold here due to nearly touching that white uptrend. I waited for the dip back into support (RED) and re-entered focusing in on Target #2 which also coincided with price hitting that white trendline and being rejected. We bounced on that red support again and double-topped. This time we broke through our red support and came all the way down to another support which I expected to hold (white). It did. I then knew we were on our way to Target #3. But I've stated all along that I did not think we'd break back above that previous red support which now has become massive resistance. So far, I have been right. The Cup and Handle pattern also gave me that 670-700 target. Nailed that as well.
Could we go higher? Absolutely. That's what blow-off tops do. They often surprise the market with one final wild ride. Everyone piles in out of FOMO. And I have expected a final price of up to $700 SPY all along. Will this happen? Remains to be seen. But my experience has taught me that we are near the top. And since, I am satisfied with a price of $670 being that this is the beginning of my third and final target box, I pulled most of my personal money out a few days ago. My main goal now is to avoid greed and preserve capital. That is what I will do until the market tells me otherwise.
I want to take one final look at our monthly chart:
See that thick white trendline that starts in 2009? That is the beginning of our secular bull market. This next part is going to sound insane but that is often the case when you read what I write, we could technically drop all the way down to SPY 300, over 55% from where we are right now, and STILL be in a bull market! Can you imagine how many traders will start to scream that the world is ending? And yet, technically the market will remain bullish. Crazy to think about, but definitely worth noting.
✌️Stew
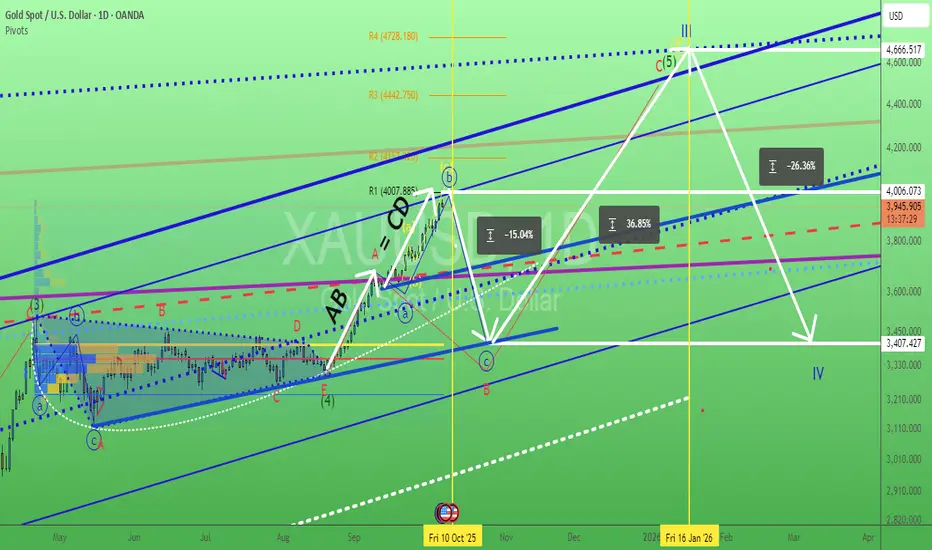
Gold. Waiting NFP trigger? 7/Oct/25XAUUSD nonstop surging need some profit taking? what event trigger the heavy sell off? Coming this Friday delayed NFP? "time / cycle - wise" Look like "some cash out" not just from Gold but also equities market?. 4007.885 are the confluence zone of 1) Monthly R1 2) Parallel Line Resistance 3) AB = CD price volume. and many...P/s all impulsive wave consist of abc subwaves not 1,2,3,4,5 waves
SPX - That's all folks?The world has gone nuts, but markets didn't even blink.
Now the SPX has reached it's U-MLH, which means, it's at a real extreme.
This is a level where price starts to stall, then turn.
Often we see "a last attempt" to break through, and it really could happen. But then, gravity again takes it's toll and the rocket starts to turn south.
Here are the scenarios I see:
1. Immediate turn at the U-MLH. Target is the Centerline.
2. A break of the U-MLH, then back into the fork and a fall down to the Centerline.
3. Break the U-MLH, continuation to the WL1.
The most unlikely would be 3.
In my view, Party People should have left allready, but they refused to.
And that's why this time headaches will be the least problem they face.
Wating for a short signal, to load up heavy.

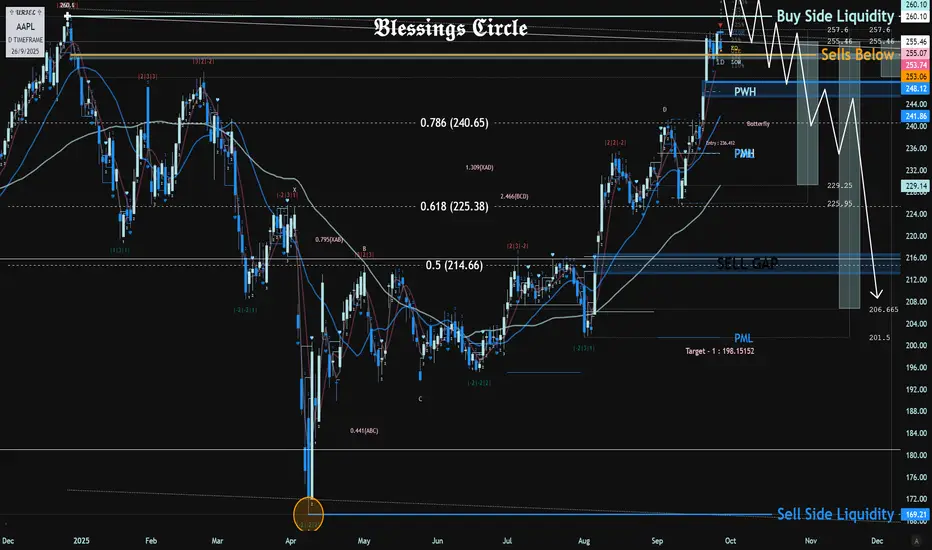
Hope The Apple Doesn't Rot The Fall of The Big Apple
Watching For AAPL to Potentially Trade into 260.10 This Week.
If 260.10 Does Trade I Will Be Looking To Short & Actively Scale into Sells Up Until 265.
If AAPL Were To Squeeze Above 265, The Sells Thesis Would Be Null.
First Sells Target Would Be Into The Sell Gap @ 248-245.
Second Sells Target Would Be The Second Sell Gap @ 216-212.
Third Sells Target Would Be The April Wick Low @ 169.21.
We Can Fall Potentially Fall As Low As 100 or Maybe Even Lower, but Majority If Not 100% of My Sells Positions Will Be Scaled Out Into The Above Sells Targets.
Good Luck To All Traders Going Into The Month Of October & Start of Q4.
With NFP on Friday to Finish off The Week Make Sure To DE Risk If Long.
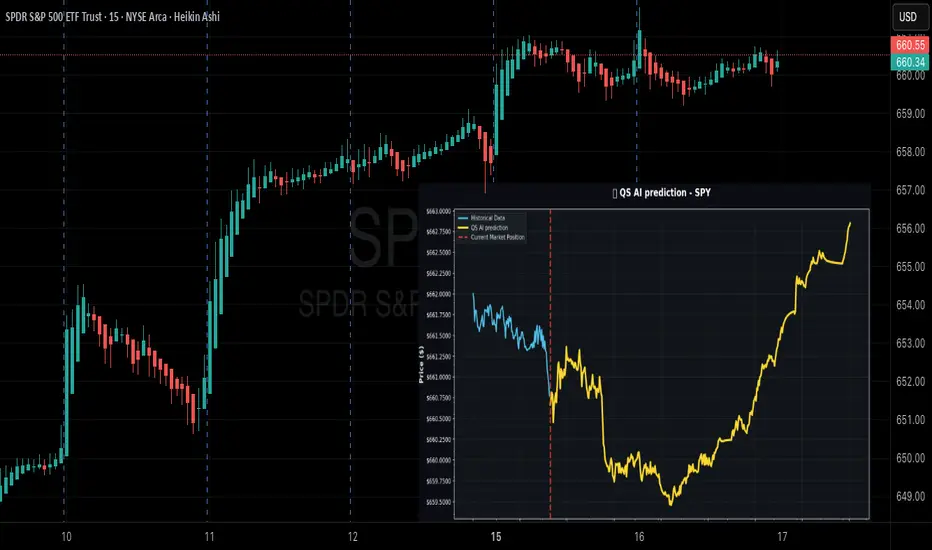
$SPY Neutral Prediction--Traders Eye BreakoutDaily AI-powered trade ideas, SPY 0DTE plans, NLP news signals, weekly option alerts & live trading updates. Trade smarter, every day. 🚀📈
🚀 AMEX:SPY Intraday Prediction – Neutral Trend, Breakout Loading?
📊 Market Status
Price: $660.77
Data Quality: ✅ Strong
Timeframe: 1-Min K-Line Precision
🎯 Price Forecasts
30-Min Target → $661.18 (+0.06%)
2-Hr Target → $659.75 (-0.16%)
End-of-Day → $662.85 (+0.31%)
📈 Extended Outlook
Final Target: $662.85 (+0.31%)
Volatility: 3.4%
Range: $659.46 – $662.85
⚖️ Trend Read
Direction: NEUTRAL
Confidence: 55%
Bias: ⚡ Watching for breakout above $662.85
🔑 Levels That Matter
Support → $659.46
Resistance → $662.85
Range Size → 0.5%
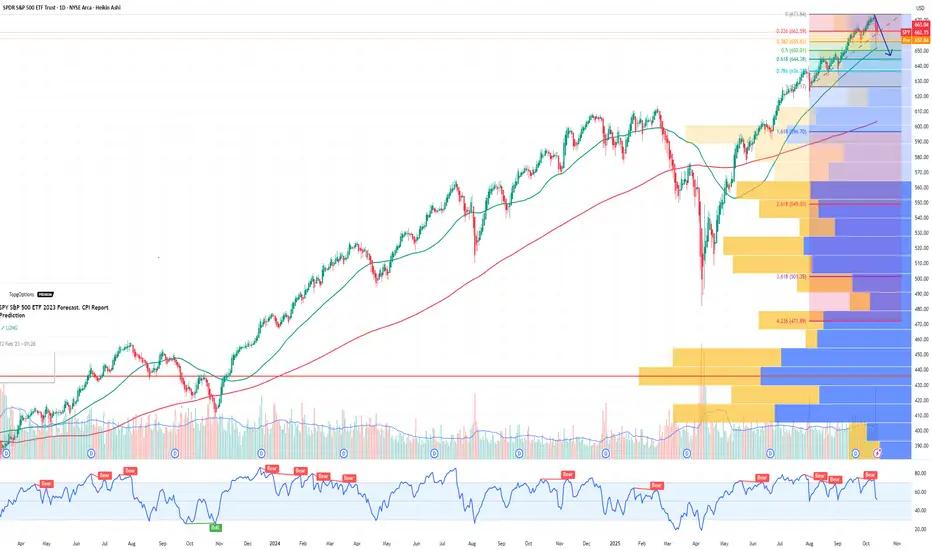
SPY's Final Wall: The Bearish ThesisRight now, SPY is facing the most significant confluence of resistance trend lines it has seen in years. Think of this as the ultimate ceiling—a multi-layered wall that the bulls have to smash through.
The market's parabolic move has pushed the price to this critical point. But here's the thesis: the combined strength of these converging trend lines is just too much. The buying power is exhausted.
We believe this is a classic rollover setup. Instead of a breakout to new highs, we expect a strong rejection from this level. The price will hit this solid wall of resistance and turn over, leading to a significant pullback.
The current price isn't a simple pause; it's a test of strength that the bulls are likely to fail.
Day Trade/Swing Trade Idea: Short at red arrow and cover at the green arrow

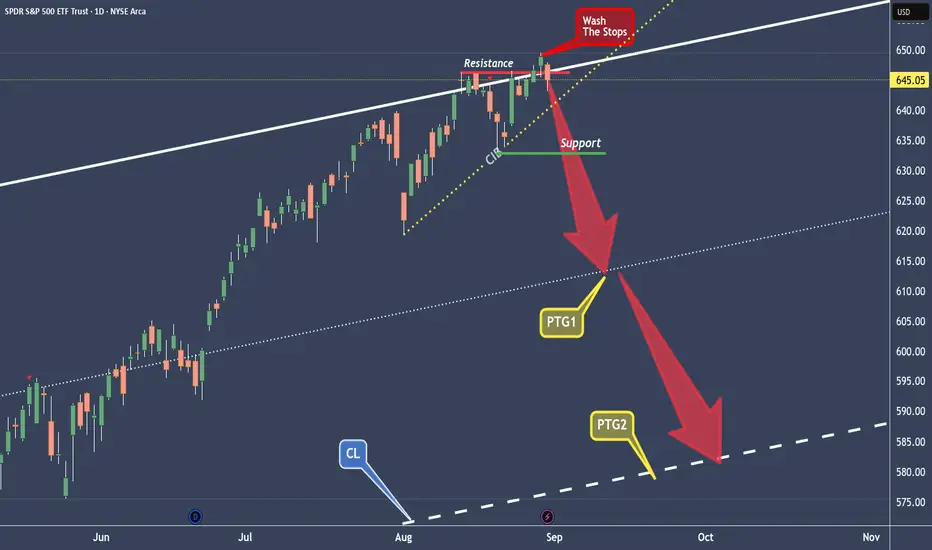
SPY washed away the Stops, and now rinse supportAt the U-MLH the air is very, very thin now.
SPY is experience this and it looks like this market shows it's hand.
It's the second time where the breakout failed.
A classical Double-Top.
Today SPY will open back into the Fork, which is a very bad sign for climbing markets. And if SPY can't close outside the Fork today, it would be a clear short to me.
So, after the Wash of the Stops at the Top, what follows is the "Rinse" of the support level and then way down to the PTG1, the 1/4 line, and further to the PTG2 at the Center-Line.
SPY – No hocus-pocus – Now the witch is hunting the bullsHappy Hump-Day y'all!
In the last post (see linked chart), I explained what the witch sees in the future.
A possible scenario that is long overdue: the markets are letting out air.
With the candles from yesterday and the day before, we have confirmation that the S&P 500 is heading south. That has consequences that not many want to see right now.
The bulls will be overrun, panic selling will kick in and drive the markets into the ground even faster. The current profit target is still the Centerline, as marked with the red arrow.
Whoever doesn’t cash in at least 50% of their gains now will end up in the witch’s cauldron §8-)
Let’s see how this develops.
The YT Video will be up tomorrow - gotta feed the witches cat §8-)
May the broom be with you!

SPY 0DTE Bearish Setup – Max Pain in Play (Aug 7)## ⚠️ SPY 0DTE Bearish Setup – Max Pain in Play (Aug 7)
**Low-Conviction Market = Short-Term Put Opportunity?**
### 🧠 Summary of Consensus:
All major models (Grok, Gemini, Claude, Llama, DeepSeek) flag the **lack of bullish momentum**.
💡 **Key Bearish Signals**:
* 📉 Price below VWAP
* 📊 Weak volume
* 📉 RSI & flow: neutral to bearish
* 🎯 Max pain hovering near current price
---
### 🤖 AI Model Breakdown:
| Model | Bias | Action |
| -------------- | ------------------- | ---------------------------- |
| Grok / Gemini | 🔻 Weak Bearish | No trade (wait for clarity) |
| Claude / Llama | 🔻 Moderate Bearish | Buy PUT at \$630 |
| DeepSeek | ⚖️ Mixed Bearish | Monitor – no high-conviction |
🧭 **Consensus Direction**: **Weak Bearish**
---
### 🔧 Trade Setup (0DTE)
| Metric | Value |
| ---------------- | ------------- |
| 🎯 Instrument | SPY |
| 🔀 Direction | PUT (SHORT) |
| 💵 Entry Price | 0.78 |
| 💣 Strike Price | 630.00 |
| 🛑 Stop Loss | 0.39 |
| 🎯 Profit Target | 1.56 |
| 📅 Expiry | Aug 07 (0DTE) |
| ⏰ Entry Timing | Market Open |
| 📈 Confidence | 60% |
📊 **Risk/Reward**: 1:2
📉 **Time Decay Alert**: Tight stop-loss due to fast 0DTE decay.
---
### ⚠️ Key Watchouts:
* 📈 Reclaiming VWAP = **exit immediately**
* 🔊 Sudden volume spike = momentum shift risk
* 🧯 Keep position size small – this is a **scalp**, not a swing
---
### 🧠 Final Take:
> If SPY stays pinned below VWAP & max pain remains, this **0DTE put could print**. But discipline is everything — tight stop, tight leash. ⚔️
---
🧠 **Follow for daily AI-backed earnings & SPY plays**
📉 **Not financial advice – manage risk like a pro**

LMACD of the US02Y has just dipped bellow 0!In the past while rates have been elevated for a period of time things have gone bad for risk markets once the LMACD dipped bellow 0. Could be this time different?
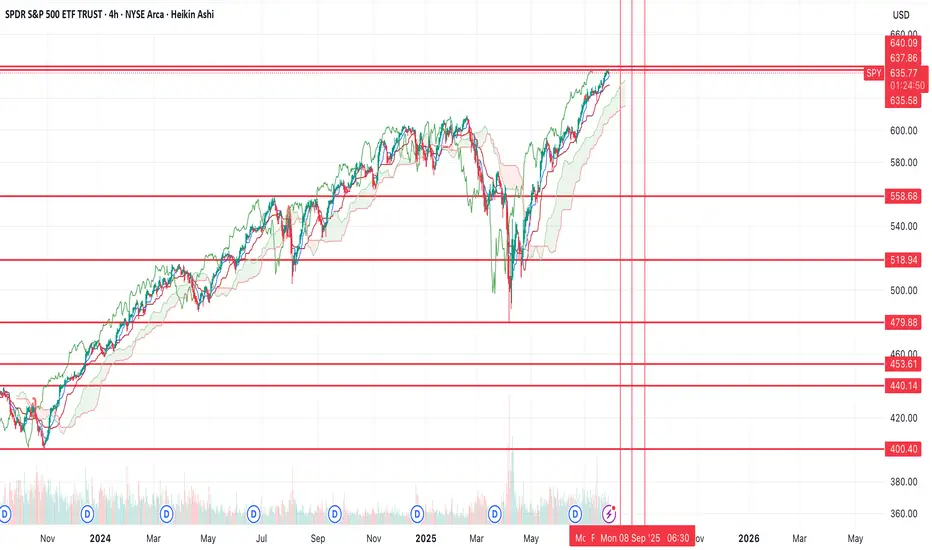
$SPY rolling over, potentially to new lows?While I was early to the idea (like usual), still don't think the thesis will be wrong. I still believe we're going to see a large move down from here.
Yesterday's price action made me pretty confident a top was in (TBD). We had positive news and the market couldn't rally on that positive news and we ended up closing at the lows -- indicating to me there's no more buyers.
Today we have treasuries, the dollar and volatility all rallying while equities selloff, a classic risk off signal. You also have crypto selling off too.
I think we see a large risk off move from here on out, the target is the $440 area (extreme down to $400), but if we find support at one of the other levels above that, there's potential for us to rally from there.
Will have to see how price action plays out over the coming weeks.
SPX 0DTE TRADE IDEA – JULY 25, 2025
⚠️ SPX 0DTE TRADE IDEA – JULY 25, 2025 ⚠️
🔻 Bearish Bias with Weak Volume – Max Pain Looming at 6325
⸻
📊 Quick Market Snapshot:
• 💥 Price below VWAP
• 🧊 Weak Volume
• 📉 Max Pain @ 6325 = downside pressure
• ⚖️ Mixed Options Flow = no clear bullish conviction
⸻
🤖 Model Breakdown:
• Grok/xAI: ❌ No trade – weak momentum
• Claude/Anthropic: ✅ Bearish lean, favors PUTS near highs
• Gemini: 🟡 Slightly bullish bias, BUT agrees on caution
• Llama: ⚪ Neutral → No action
• DeepSeek: ❌ Bearish → No trade
⸻
📌 TRADE IDEA:
🎯 SPX 6365 PUT (0DTE)
💵 Entry Price: $0.90
🎯 Profit Target: $1.80 (💥 2x return)
🛑 Stop Loss: $0.45
📆 Expires: Today
🕒 Exit by: 3:45 PM
📈 Confidence: 65%
⏰ Entry Timing: OPEN
⸻
⚠️ Risk Flags:
• Low volume = fragile conviction
• Possible reversal if SPX breaks above session highs
• Max pain magnet at 6325 could limit gains or induce a bounce
⸻
🧠 Strategy:
Scalp it quick. Get in early. Exit before the gamma games explode into close.
📈 Like this setup? Drop a 🔽 if you’re playing puts today!
#SPX #0DTE #PutOptions #OptionsTrading #MaxPain #SPY #MarketGamma #TradingSetup
