[LOI] - CRCL - CRCL
Key points :
Regulatory Clarity Boosts Stablecoin Legitimacy : Recent U.S. laws like the GENIUS Act and the proposed Digital Asset Market Clarity Act suggest a more supportive environment for stablecoins, potentially driving mainstream adoption while acknowledging debates over interest-bearing features.
USDC's Market Dominance and Growth : As the second-largest stablecoin with circulation around $73.7 billion, USDC benefits from high transaction volumes and integrations, positioning Circle for revenue expansion amid global digital asset trends.
Absence of U.S. CBDC Creates Opportunities : With U.S. retail CBDC efforts halted, private stablecoins like USDC could fill payment gaps, especially in cross-border and instant payments, though this relies on evolving interoperability with Fed systems.
Potential Fed Leadership Shift [ /b]: The upcoming change in Fed Chair in May 2026 may introduce pro-innovation policies, enhancing crypto-friendly guidance, but outcomes depend on the nominee's stance.
Undervalued at Current Market Cap : At approximately $16.5 billion, CRCL appears undervalued given projections for significant upside. Asset backed issuance at $73.7 billion makes a 3x gap which could be bridged quickly upon greater regulatory clarify + Pro-innovation FED
Notes on how I personally use my charts/NFA:
Each level L1-L3 and TP1-TP3 (Or S1-S3) has a deployment percentage. The idea is to flag these levels so I can buy 11% at L1 , 28% at L2 and if L3 deploy 61% of assigned dry powder. The same in reverse goes for TP. TP1: 61%, TP2:28% and TP3:11%. If chart pivots between TP's, in-between or in Between Sell levels these percentages are still respected. I like to use the trading range to accumulate by using this tactic.
Just my personal way of using this. This is not intended or made to constitute any financial advice.
This is not intended or made to constitute any financial advice.
NOT INVESTMENT ADVICE
I am not a financial advisor.
The Content in this TradingView Idea is for informational purposes only, you should not construe any such information or other material as legal, tax, investment, financial, or other advice. Nothing contained within this idea constitutes a solicitation, recommendation, endorsement, or offer to buy or sell any securities or other financial instruments in this or in in any other jurisdiction in which such solicitation or offer would be unlawful under the securities laws of such jurisdiction.
All Content on this idea post is information of a general nature and does not address the circumstances of any particular individual or entity. Nothing in the idea/post constitutes professional and/or financial advice, nor does any information on the idea/post constitute a comprehensive or complete statement of the matters discussed or the law relating thereto. You alone assume the sole responsibility of evaluating the merits and risks associated with the use of any information or other Content on the idea/post before making any decisions based on such information.
Sir. Galahad - QUANT
Disclaimer
The information and publications are not meant to be, and do not constitute, financial, investment, trading, or other types of advice or recommendations supplied or endorsed by.
Stablecoin

Stablecoin Dominance Pullback = Risk ReturningChart: STABLE.D (Crypto Stablecoin Dominance) vs OTHERS.D
Timeframe: 1D
Context: Crypto market risk appetite
Thesis
Stablecoin dominance has rolled over after an extended uptrend, while OTHERS.D has stabilized and begun to base. This suggests capital is rotating out of stables and back into risk assets, particularly altcoins.
🔍 What the Chart Shows
STABLE.D put in a strong impulsive move higher, signaling prior risk-off behavior
Recent price action shows loss of momentum and a pullback from local highs
At the same time, OTHERS.D stopped making lower lows and is attempting to stabilize
This inverse relationship often marks a transition phase in market structure.
📈 Why This Matters
Rising stablecoin dominance = capital sidelined, defensive positioning
Falling stablecoin dominance = capital redeploying into crypto assets
If STABLE.D continues to trend lower, it supports:
Improved risk appetite
Better conditions for alts to outperform
Less demand for “parking capital” in stables
❌ Invalidation
This view would weaken if:
STABLE.D reclaims recent highs with expansion
OTHERS.D loses its current base and breaks down
That would signal a return to risk-off behavior.
🎯 Takeaway
Stablecoin dominance is a macro sentiment gauge.
This pullback suggests the market may be shifting from defensive to selective risk-on, especially outside BTC.
Watch follow-through — rotations take time.

STABLEUSDT | Perfect C&H FormationHello traders,
A perfect C&H formation is always welcome to see on our charts. Pretty simple with a very good R:R
What you want to look for as a TP target is the same depth of the cup.aka.distance from SH to SL.
Good Luck!
All our analysis is shared with honesty, care, and real effort. If you find value in it, a like or comment means a lot to show your support🙏📊

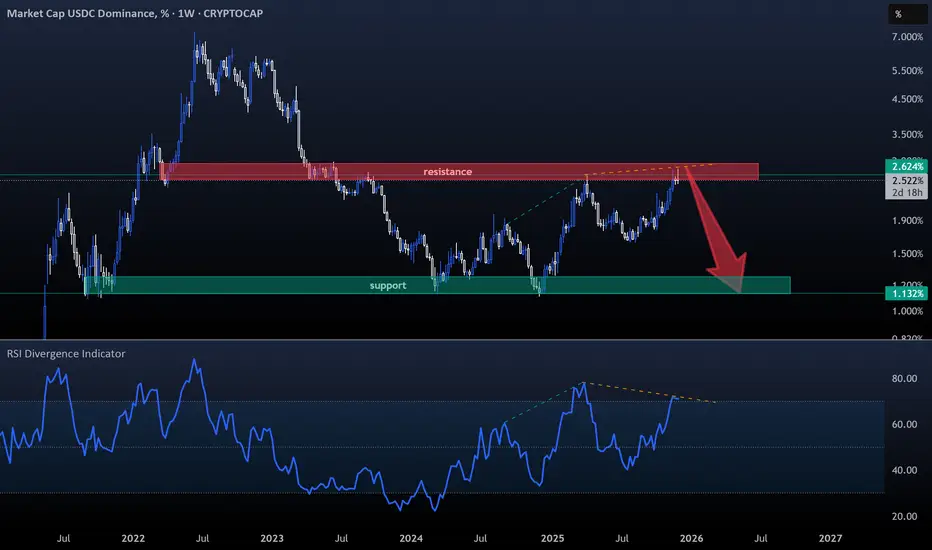
USDC DOM- I haven’t covered Circle’s stablecoin recently. Tether's USDT remains the clear leader at 6% Dom, but with USDC rising back to 2.5% Dom, it’s definitely worth watching again.
- The chart is simple, focus on the Weekly RSI and you’ll see a clear divergence developing on the weekly timeframe.
- So just keep an eye on USDC’s support around 1.1% (green zone) and it's resistance near 2.8% (red zone).
One Simple Rule : Stablecoins down = Bitcoin up.
Happy Tr4Ding !
FireHoseReel | USDT.D : The Next Major Crypto Wave Is Starting🔥 Welcome to FireHoseReel!
Let’s dive into the USDT Dominance (USDT.D) market structure.
👀 USDT.D – 4H Overview
After a strong bullish rally, USDT Dominance has fully retraced its entire move and is now losing a key support zone. This is one of those levels you shouldn’t pass without a position — it’s a critical decision area.
🧮 RSI Analysis
The USDT Dominance RSI has formed an oversold zone around the 33 level. A breakdown and sustained move below this zone could trigger mass USDT selling and strong buying pressure in Bitcoin and altcoins.
✍️ Current Scenario for USDT Dominance (Simple Setup)
🟢 Long Scenario for the Crypto Market:
A clear break and candle close below 5.934%, ideally accompanied by RSI breaking below the 33 level, would confirm momentum. In that case, the move is expected to accelerate, and we’ll likely spend less time inside the position due to high volatility.
❤️ Risk Management & Emotional Discipline
Crypto trading is highly risky. Without proper risk management and emotional control, trading becomes no different from gambling.
Logic must always come before emotions. Learn to manage your trades and enjoy the process with control and discipline.

CRCL: watching for final leg downAnother leg down into the ideal macro support zone at 91–85/75 would be ideal to complete the corrective structure from the June highs.
A confident move above 120 would shift the odds toward the correction being complete, opening the door for at least a larger-degree bounce — or potentially the beginning of a new uptrend.
Chart:

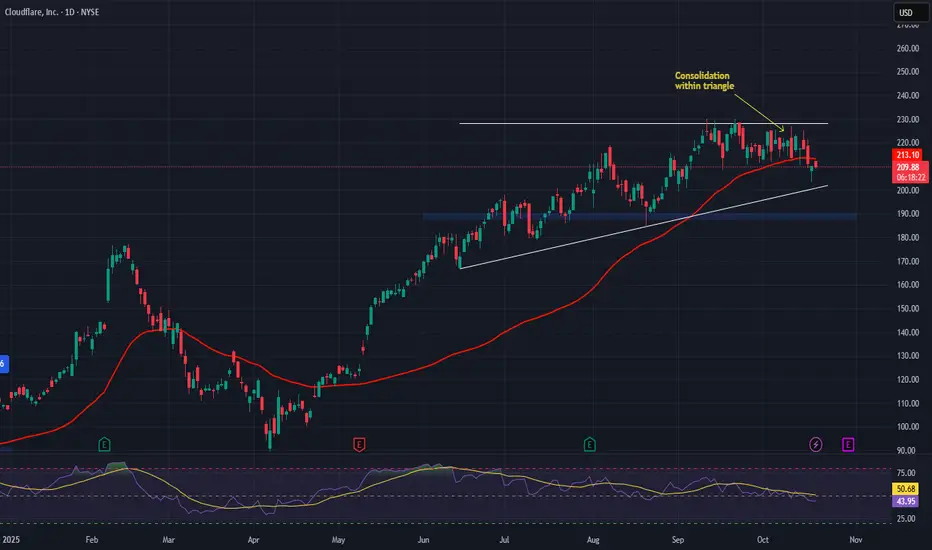
NET — AI Infrastructure Leader Launches Stablecoin InnovationCompany Overview:
Cloudflare, Inc. NYSE:NET is a global leader in cloud connectivity and cybersecurity, delivering secure, scalable, and high-performance infrastructure for the modern internet. The company is evolving into a key enabler of AI-driven applications, with its Workers platform gaining strong enterprise traction to power large-scale intelligent workloads.
Key Catalysts:
Fintech breakthrough: The launch of the NET Dollar stablecoin bridges AI, cloud, and financial infrastructure, enabling automated machine-to-machine (M2M) payments and introducing new recurring revenue models.
Enterprise growth: Added 219 new large customers in Q2 2025, highlighting accelerating adoption and market leadership.
AI ecosystem expansion: Increasing integration of Cloudflare’s edge computing network within enterprise AI frameworks positions it at the core of the next-generation digital economy.
Investment Outlook:
Bullish above: $188–$190
Upside target: $380–$390, supported by AI infrastructure dominance, fintech innovation, and accelerating enterprise demand.
#Cloudflare #AI #Stablecoin #Cybersecurity #Fintech #DigitalInfrastructure #EdgeComputing #Investing #NET
Can USDT.D break its high ? | USDT.D 4H Analysis🥳 Hey everyone! Hope you’re doing great! Welcome to SatoshiFrame channel .
✨ Today we’re diving into the 4-Hour Ethereum analysis. Stay tuned and follow along!
💵 Can USDT.D break its high & cause crypto drop again ? Tether Dominance is hovering near the 5% zone after the Trump tariff rumors — a key resistance that perfectly aligns with the crypto market’s bottom. A breakout here could trigger another leg down across altcoins.
👀 4-hour timeframe of Tether Dominance and we can see that after breaking the 4.6% area, it gave us a confirmation for an uptrend, and in this area, it also formed a higher low compared to its previous low. It easily broke through several resistance levels and reached its top at the 5.16% area, where it is now rejected. Since we are in the holiday period, we have faced weak downward momentum, and now several breakout triggers have formed on the Tether dominance chart which, with Tether volume passing through these areas, the market can start its next move. Note that this top that has currently formed is the same as the bottom of the altcoins that we see on various charts, so breaking this top will not be easy.
🧮 The RSI oscillator can be a great help to us in this analysis, as it allows us to better identify the tops and bottoms of Tether dominance. If the oscillation passes through those desired areas, we can take positions on coins contrary to the direct supply and demand of the chart itself. The 74 oscillation zone is slightly above the overbought boundary, and crossing this area can increase the oscillation volume of Tether buy trades and cause the crypto market to lose its bottom. The next important area is the 50 zone, where a reaction to this area or passing the oscillation limit from this area can form a lower top for Tether dominance and then give us confirmation to start a bullish leg in the market.
🕯 The size of the Tether dominance candles during the rise was significantly smaller but closed with more strength, while during reactions and pullbacks, the size and number of candles increased, which informs us of the weakness of the Tether sellers' trend. A noteworthy point for Tether dominance is the rejection it received from the top and then moved downward, facing weak upward momentum. If the market bottom is in this area and the Tether dominance top is also in this area and this top does not break, the market can soon tend toward a trend change and a drop in dominance may occur.
❤️ Disclaimer : This analysis is purely based on my personal opinion and I only trade if the stated triggers are activated .

Can USDT.D break the Taker Seller Zone ? | USDT.D 1H Analysis👋 Hey everyone! Hope you’re doing great! - ❤️ Welcome to Satoshi Frame .
📅 Today we’re diving into the 1-hour Bitcoin analysis. Stay tuned and follow along!
👀 On the 1-hour timeframe of USDT.D, we can see that after the news of Trump imposing tariffs on China, USDT.D experienced an extremely sharp pump — rising from below 4.3% to near 5%. After that, it formed a trading-range box in this zone. The top of this box lies around 4.89%, overlapping with a “taker-seller” resistance zone where Tether’s market share is currently capped. There’s a key midline at 4.74% and a bottom at 4.59%, completing this trading-range pattern. Price has tested the top three times but failed to break it, meaning USDT.D remains trapped below resistance. A 15-minute multi-timeframe Low has also formed at 4.83%, creating a new structure that, if broken, could trigger Tether selling.
🧮 Looking at the RSI oscillator, since October 12 it has tried three times to enter its 1-hour OverBuy zone but failed each time. Each rejection from around the 70 level led to selling pressure and movement back toward its 50 support zone. This 50 level is a very important static resistance — a breakout above it could push USDT.D toward higher resistance levels. The 50 RSI zone also overlaps with the 4.83% price level, meaning if that area is lost, selling pressure and volume decline could begin.
🕯 The size and volume of recent USDT.D candles show weakness every time it reaches the 4.89% top. Breaking the taker-seller zone will require a large “whale” candle — a strong, high-volume bullish move that can fully absorb the sell orders placed there. In short, breaking this level needs a strong price surge and maximum buying pressure.
🧠 To manage or open new positions using USDT.D as a guide, we can consider these scenarios:
🟢 Breakout of the taker-seller zone: This breakout could be triggered by news or even a Trump tweet :) From a technical standpoint, this area needs a massive, high-volume “whale” candle so that all sell orders in this zone get filled instantly. Once price surges and holds above it, the next resistance would be around 5.1%.
🔴 Break of the 15-minute multi-timeframe Low: This Low sits at 4.83%. A confirmed close below it could signal the start of selling and volume decline. In this scenario, the next support for USDT.D would likely be the box midline — around 4.74%.
❤️ Disclaimer : This analysis is purely based on my personal opinion and I only trade if the stated triggers are activated .

Concordium payments infrastructure adoption will launch $CCDThe previous CCD idea played out nicely. Now it's time for real performance.
Ultimate goal: 1CCD = 1USD (x50).
New set-up
End of Q3 2025, the CCD chart has proven heartbeat with signs of volume and decisive price action.
New targets are mapped in the chart as Private Presale (PP) levels.
Expectation: at least a reclaim of these levels based on strong fundamentals.
Fundamentals supportive of case
💳 PayFi and stablecoin narratives are focal for the next level of crypto market growth and adoption
🌐 Outstanding new management team with deep industry connections
💱 >10 stablecoin issuers confirmed to launch on Concordium: transactions and TVL will grow tremendously
🤝 >20 partnerships secured in the last 4 months
📈 Hilbert Capital (NASDAQ-listed) confirmed CCD as a strategic investment, next to CRYPTOCAP:ETH and CRYPTOCAP:BTC
🔧 Q4 2025 protocol upgrade unlocks unique features for institutional adoption in blockchain payments:
1) Programmable stablecoins without smart contract risk
2) Geofenced & age-gated payments (via ID/KYC)
3) Concordium ID: portable KYC across platforms, integrated with payment programmability

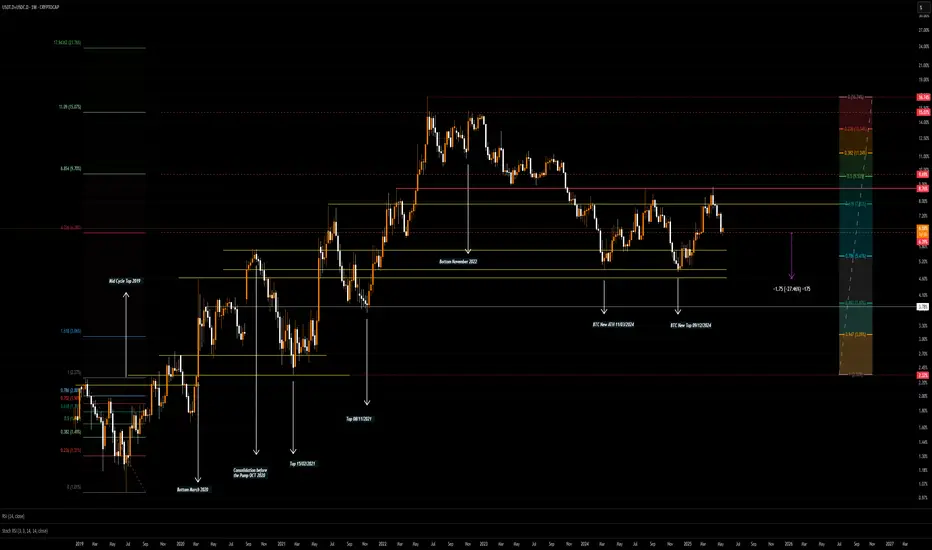
Finding BTC Top by Stable coin dominaceI think the next leg could be the final push of BTC in this cycle. However, it seems every time the Dominance of stable coins (in this case USDT+USDC) is dropping to certain point in larger timeframe can be relative to find the next top.
I think at least we can come back to 4.92% which it has been touched numerous time in this cycle such as 11/03/2024 and 09/12/2024.
It has the potential to fall a bit further to 4.64% or even 3.87 to 3.67% as well/
USDT.D 1H Analysis - Key Triggers Ahead❄️ Welcome to the cryptos winter , I hope you’ve started your day well.
⏰ We’re analyzing CRYPTOCAP:USDT.D on the 1-Hour timeframe .
👀 On the 1-hour timeframe, Tether Dominance moved upward after breaking above the 4.46% level. However, buyers were unable to push through the 4.72% resistance, and the market reacted (rejected) at that zone. This reaction formed a multi-timeframe consolidation box. The top and bottom of this box now act as key levels to determine the next market direction:
Break above 4.72% ➝ Potential for deeper correction in the crypto market.
Break below 4.46% ➝ Possible trend reversal and confirmation of renewed upside momentum.
The market is currently in a low-volume weekend phase, and price action is range-bound. With the start of the new week, there’s a higher probability of breaking out of this consolidation.
🧮 The RSI oscillator shows that after reaching the overbuy zone, price couldn’t sustain time there and was quickly rejected, forming the current market floor. Another key RSI level is around 44, which aligns with the 4.46% support. If momentum crosses below this zone, volatility could increase and trigger the next leg of movement.
🕯 On the 1-hour chart, there have been numerous green candles, indicating a deeper market correction as earlier buyers take profit and sell. This move continued until the 4.72% resistance, and the current range structure shows:
Red candles slightly larger
Green candles more frequent but smaller
This signals weakening bullish momentum, increasing the likelihood of a break below the 4.46% support.
🧠 With the current sideways structure, two main scenarios are in play:
1️⃣ Breakdown of the lower boundary (4.46%)
Could trigger a strong bullish leg in crypto, pushing the market upward.
If this happens, it could be an ideal scenario, supporting a broader crypto rally.
2️⃣ Breakout above the upper boundary (4.72%)
Would likely lead to a deeper correction across the market.
This scenario could result in significant drops in Bitcoin and Ethereum.
Keep both the ceiling and floor of Tether Dominance in mind as the new week begins. The current range is relatively narrow, meaning a breakout could even occur as early as tomorrow during the New York session.
❤️ Disclaimer : This analysis is purely based on my personal opinion and I only trade if the stated triggers are activated .

USDT.D 1H Analysis - Key Triggers Ahead👋🏻 Hey everyone! How’s it going? Hope you’re all doing well.
❄️ Welcome to Crypto Winter.
⏰ Today, we’ll be analyzing USDT.D and exploring its potential opportunities.
👀 On the 1H timeframe of USDT dominance, we noticed that after touching the support zone, we were expecting a breakdown. However, with a fake-out, it reversed and is now correcting upwards. The next resistance for USDT dominance could be around 4.34%.
🧮 The RSI oscillator is approaching the key level around 70 (overbuy zone). If USDT dominance enters this area, it could trigger a deeper correction in the market.
🕯 The green candles in USDT dominance (profit-taking and closing of long contracts) are gradually increasing. We should watch closely how these candles react as we approach the 4.34% resistance level.
🧠 Since we don’t want to open shorts here, the best strategy is to wait and see how USDT dominance reacts before entering any positions. This is very important. In the meantime, we can build a watchlist and focus on other setups.
❤️ Disclaimer : This analysis is purely based on my personal opinion and I only trade if the stated triggers are activated .

Why Altcoins Are Weak in This Bull Run?The crypto market is in a bull run, but something feels different this time. While Bitcoin and Ethereum are setting new highs, many altcoins are struggling to keep up. In previous cycles, altcoins often outperformed once Bitcoin found stability — but this round looks weaker. Here are a few reasons why altcoins are underperforming:
✅ Bitcoin Dominance Is Rising
Capital flows in crypto follow a cycle. Early bull phases usually start with Bitcoin, as institutions and large investors prefer its liquidity and reputation as a "safer" crypto asset. Bitcoin dominance has been climbing, signaling that capital is consolidating into BTC instead of spreading into smaller, riskier altcoins.
✅ Liquidity Is Thinner Across the Market
Unlike previous cycles, global liquidity conditions are tighter. With interest rates higher and risk appetite lower, speculative capital isn’t flooding into altcoins at the same pace. Most investors would rather deploy into BTC or ETH than gamble on small-cap tokens with uncertain narratives.
✅ Regulation & Exchange Listings Matter More
This cycle is also shaped by increased regulatory scrutiny. Many altcoins face delisting risks or uncertainty around whether they qualify as securities. This discourages both retail and institutional investors from rotating heavily into alts.
✅ Narratives Are Narrower
In past cycles, new sectors (DeFi in 2020, Metaverse in 2021) created explosive altcoin rallies. This time, the strongest narratives are Bitcoin ETFs and Ethereum staking. Without a fresh, sector-wide altcoin narrative, capital rotation is limited to a few selective themes like AI coins or Real-World Assets (RWA), rather than lifting the entire alt market.
✅ Market Maturity & Survivorship Bias
The crypto market has matured. Many speculative altcoins from past cycles have faded or collapsed. Survivors now trade more in line with fundamentals and adoption, meaning the era of every token pumping in unison is over.
Conclusion
Altcoins are weaker in this bull run because the cycle is more institutional, more selective, and more Bitcoin-focused. That doesn’t mean altcoins won’t have their moment, but traders should be more careful this time. Instead of chasing every low-cap token, focus on strong narratives, liquidity, and projects with real adoption.
Altseason may come, but it won’t look like the ones of the past.
Cheers
Hexa
BINANCE:BTCUSDT BINANCE:ETHUSDT CRYPTOCAP:BTC CRYPTOCAP:ETH CRYPTOCAP:XRP CRYPTOCAP:BNB
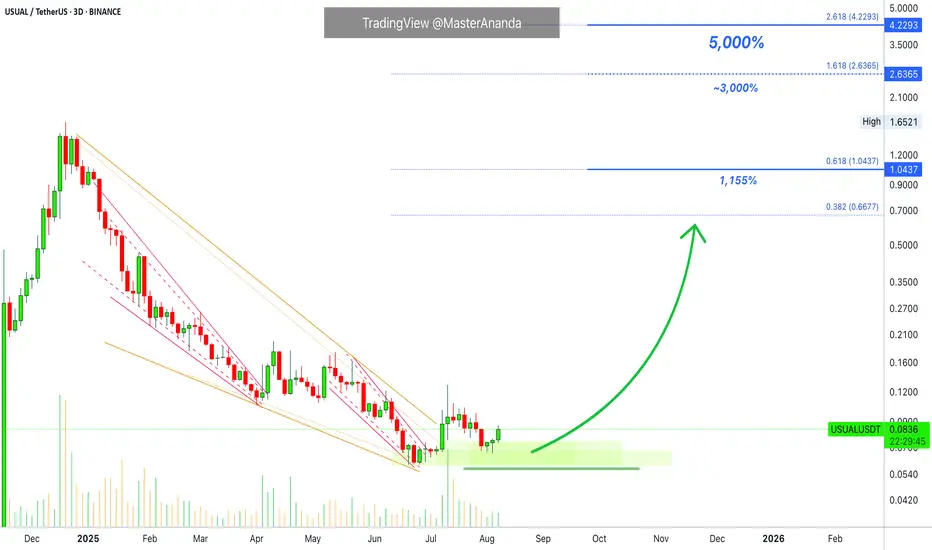
Usual Protocol 5000% Bullish Potential ExposedThe highest volume since December 2024 happened last month, July. This is a high volume bar that signals the bulls are back in the game.
As USUALUSDT was moving lower volume was also dropping. After the bottom was hit, volume did rise but on the buying side. The bearish wave lost its momentum and ran its course.
This is going to be a huge project. I should say, this trading pair will produce big gains. You can see with me the huge growth potential shown on the chart. These numbers are based on the 2024 high, and we have 3,000% and 5,000% potential for growth. Imagine what numbers we would get if we had data coming from 2021.
Some pairs I mention more than others because they are safe and have huge potential for growth. It is easier to choose if you see a pair often.
When in doubt, keep reading.
If you don't know what to choose and there are too many options, then you need to read some more. There is always time and the market always offers a second chance. Keep reading and everything becomes clear.
It is normal to not understand at first. It is normal to start understanding things after several weeks. It is very normal to have a map of what is happening after just a few months. You will be able to tell the difference easily from when you are reading and when you are not. The market is not going away. But, if you want to know what the market is actually doing, read @MasterAnanda
Thank you for your continued support.
Namaste.
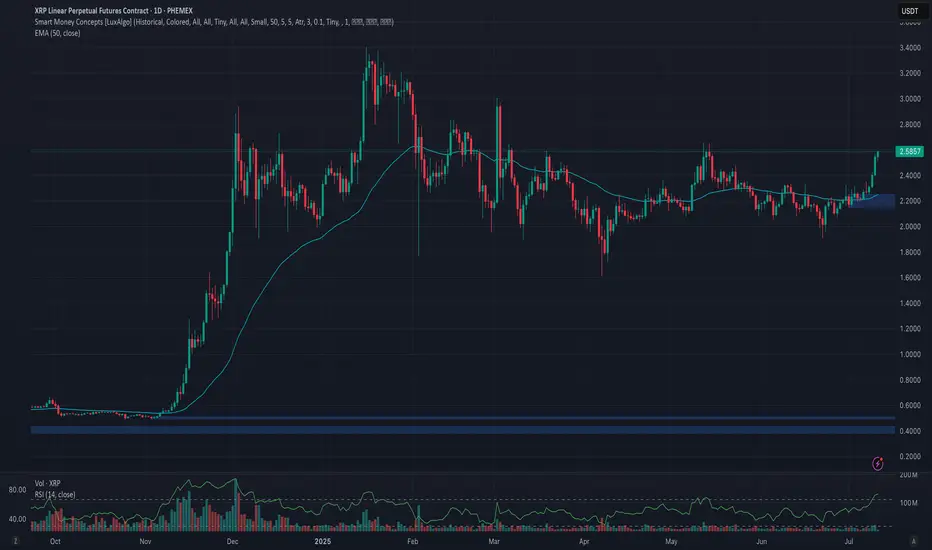
Phemex Analysis #96: Pro Tips for Trading Ripple (XRP)Since our previous analysis on XRP , Ripple’s native token [ PHEMEX:XRPUSDT.P ] successfully broke above the significant $2.45 resistance level, subsequently establishing a higher low around $1.90 on June 22nd. Encouragingly, XRP has surged 10% over the past two days, once again decisively breaking the $2.45 barrier, and is currently trading at around $2.57.
Given XRP’s recent bullish performance and evolving market dynamics, let's explore several potential scenarios that traders should closely monitor.
Possible Scenarios
1. Continued Bullish Momentum (Breakout Scenario)
If XRP maintains its current bullish strength, it’s likely to break above its recent high at $2.65. Such a breakout would signal strong buying interest and may push the price further toward the resistance zones at $2.96 and $3.12.
Pro Tips:
Entry Strategy: Consider entering or scaling positions upon confirmation of a breakout above $2.65, supported by increased trading volume.
Profit-Taking: Strategically take partial profits as XRP approaches the next resistance levels at $2.96 and especially $3.12 to secure gains effectively.
2. Rejected by Strong Resistance Levels (Pullback Scenario)
While the recent rally is promising, broader market conditions currently exhibit limited bullish momentum, indicating caution. XRP may face strong selling pressure at resistance levels like $3.12, leading to a potential price rejection.
In this scenario, XRP could retreat to establish a higher low above the important support at $2.15.
Pro Tips:
Buying Opportunities: Long-term investors might consider gradually accumulating positions if XRP forms a confirmed higher low above the critical support zone around $2.15.
Patience: Wait for clear stabilization signs at support before increasing positions, rather than rushing entries during active retracements.
3. Consolidation within Defined Range (Neutral Scenario)
XRP might enter a period of price consolidation, oscillating between support at $1.91 and resistance at $2.65. This scenario is common when market sentiment is uncertain or awaiting clearer directional cues.
Pro Tips:
Grid Trading Strategy: Utilize grid trading bots to profit systematically from predictable range-bound price movements. Initiate Long Grid bots near support at $1.91 and Short Grid bots near resistance around $2.65.
Stop-Loss: Always set clear stop-losses outside the consolidation range, ensuring protection against unexpected breakouts or breakdowns.
Conclusion
Ripple (XRP) currently offers compelling trade opportunities across different market scenarios. By closely monitoring bullish breakout signals above $2.65, potential pullbacks toward $2.15, and consolidation opportunities within $1.91–$2.65, traders can strategically position themselves to capitalize effectively while managing risks prudently. Always maintain a disciplined approach, pay close attention to broader market trends, and carefully execute trades based on well-defined scenarios.
🔥 Tips:
Armed Your Trading Arsenal with advanced tools like multiple watchlists, basket orders, and real-time strategy adjustments at Phemex. Our USDT-based scaled orders give you precise control over your risk, while iceberg orders provide stealthy execution.
Disclaimer: This is NOT financial or investment advice. Please conduct your own research (DYOR). Phemex is not responsible, directly or indirectly, for any damage or loss incurred or claimed to be caused by or in association with the use of or reliance on any content, goods, or services mentioned in this article.
ETH: Buying in the DipCME: Micro Ether Futures ( CME:MET1! ), #microfutures
On May 22nd, #Bitcoin reached a new all-time high of $111,814. The king of cryptos rallied as bullish sentiment built up behind the most pro-crypto U.S. administration. As of last Friday, bitcoin realized a one-year return of +90.8%. For comparison, holding S&P 500 only yields 11.8% for a year, even after the US stock index made its ATH last week.
Meanwhile, #Ethereum, second only to Bitcoin in the cryptocurrency world, experienced a dramatic decline in 2025. ETH is currently trading around $2,500, down 40% since December. It is a far cry from its ATH of $4,815 on November 9, 2021.
Why Is Ethereum (ETH) Falling?
The most significant challenge facing Ethereum is the proliferation of Layer 2 scaling solutions. Networks such as Arbitrum, Base, and Optimism were developed to address Ethereum's scalability issues, but they've created a revenue problem for the main chain.
When users conduct transactions on these Layer 2 networks, transaction fees flow to third-party organizations rather than to the Ethereum network itself. Revenue diversion has weakened Ethereum's economic model.
Ethereum could counter the revenue erosion by implementing a fee on Layer 2 transactions. However, it would undermine the very purpose of these networks. Layer 2 solutions were designed specifically to reduce transaction costs by processing operations off-chain and submitting only batched results to the main network. Adding fees would increase costs and diminish their competitive advantage.
Increased competition in the blockchain space has further eroded Ethereum’s dominance. Investors have been withdrawing funds from Ethereum and redirecting them to competing projects with potentially better returns or technological advantages.
Future Outlook
Ethereum’s path forward appears challenging. While the platform still hosts thousands of decentralized applications and maintains a large developer community, its economic model is under pressure from multiple directions. Without finding new ways to generate value, Ethereum may continue to lose market share to more nimble competitors.
The platform’s supporters point to upcoming technical improvements and the maturation of the proof-of-stake consensus mechanism as potential catalysts for recovery. The recent approval of staking enabled ETF for Ethereum in Hong Kong is one of the ways forward. However, with increasing competitive pressures, Ethereum faces an uphill battle to reclaim its former status as the undisputed leader in smart contract platforms.
While the future remains challenging, Ethereum still has upside potential at the current price level. As ETH dropped below $1,500 in April, bargain hunters came in to scoop it up. As a result, ETH had a spectacular rebound of 70% in the last three months, outrunning Bitcoin’s 25% gain for the same period.
There are over 17,000 cryptocurrencies in existence, according to Coin Gecko. However, only a handful of them have proven to have a lasting investment value. We could refer to Bitcoin and Ethereum as the digital form of Gold and Silver. Historical trend shows that the spike in gold prices would likely prompts investors to buy silver at a lower cost, helping maintain a stable Gold/Silver price ratio. The same could be true for the BTC/ETH relationship.
For extensive reading, please refer to my Editors’ Picks, The Gold-Silver Ratio Explained, published on TradingView on April 28th.
Recent regulations on #stablecoins in the US and Hong Kong are good news to the crypto space. It legitimates crypto offerings from mainstream financial institutions. Bitcoin is positioned for another big lift as investors reallocate assets into cryptos.
On July 4th, President Trump signed into law the “Big and Beautiful Bill”. Above all, this massive package funds deficit spending and raises the national debit by $5 trillion. While we will carry the debt burden for many years, in the short run, injecting huge liquidity into the economy and the financial market would pop up asset prices.
The latest CFTC Commitments of Traders report shows that, as of June 24th, the total open interest for Micro Ether futures are 128,500 contracts.
• Leverage Fund has 94,167 in long, 112,442 in short, and 1,854 in spreading
• The long-short ratio of 0.84 does not provide a good indication of what the “Smart Money” views about Ethereum.
In summary, I hold the view that ETH may regain ground above 3,300 before year end. Investors sharing this bullish view could explore CME’s Micro Ether Futures ( NYSE:MET ).
Long Futures with Stop Loss
Last Friday, the August Ether Futures contract (METQ5) was settled at 2,518. Each contract has a notional value of 0.1 ETH, or a market value of $251.8. To buy or sell 1 contract, a trader is required to post an initial margin of $84. The margining requirement reflects a built-in leverage of 3-to-1. It’s cost-effective to invest with CME MET futures, vs. buying ETH from the spot market.
Let’s use a hypothetical trade to illustrate how the long futures with stop loss strategy would compare with buying spot ETH.
Hypothetical Trade:
• Buy 1 METQ5 contract at 2,518, and set a stop loss at 2,400
• Trader pays $84 for initial margin
High Price Scenario: Ethereum rises to $3,000
• Futures gain will be $48.2 (= (3000-2518) x 0.1)
• Futures return will be +57.4% (= 48.2 / 84)
• This compares to a 19.1% for investing in spot ETH. (= (3000 /2518) – 1)
Low Price Scenario: Ethereum drops to $2,000
• Futures stop loss at 2,400, and the maximum loss is $11.8 (= (2518-2400) x 0.1)
• Futures return will be -14% (=11.8 /84)
• This compares to a 20.6% loss for investing in spot ETH. (= (2000 /2518) – 1)
The above scenarios show that
• When ETH goes up, futures will have higher returns due to its leverage nature.
• When ETH falls, the stoploss will kick in to reduce losses.
Happy Trading.
Disclaimers
*Trade ideas cited above are for illustration only, as an integral part of a case study to demonstrate the fundamental concepts in risk management under the market scenarios being discussed. They shall not be construed as investment recommendations or advice. Nor are they used to promote any specific products, or services.
CME Real-time Market Data help identify trading set-ups and express my market views. If you have futures in your trading portfolio, you can check out on CME Group data plans available that suit your trading needs www.tradingview.com

Stablecoins will Supercharge Cryptos AdoptionCME: Micro Bitcoin Futures ( CME:MBT1! ), #microfutures
On June 5th, Circle Internet Group ( NYSE:CRCL ), issuer of the #USDC #stablecoin, debuted its initial public offering at $31 per share. By June 23rd, NYSE:CRCL prices peaked at $298.99, up nearly ten folds in just 13 trading days.
At Friday's closing of $180.43, Circle has a market cap at $40.2 billion. Wall Street gave a mindboggling price earnings ratio of 234, based on Circle’s $0.77 earnings per share.
How to Invest in Stablecoins
Stablecoins are cryptocurrencies that aim to maintain price stability. Both USDC and #USDT (issued by #Tether) peg their value to the US dollar. Paying $1 for 1 stablecoin, you will get exactly $1 back in one month, one year, or ten years. Unlike buying Bitcoin, there is no investment return for holding stablecoins. So why would anyone want them?
Because stablecoins are not investment instruments, instead, they are payment methods. Like PayPal and Apple Pay, USDT and USDC enable users to move money fast and cheaply globally, but now in the crypto world.
How do stablecoin issuers make money? They generate revenue through interest on reserves, transaction fees, lending, and partnerships with financial institutions.
• The biggest source of revenue is interest income. When it comes to stablecoin issuers, size matters, and the Fed matters.
• Based on a study by Artemis, Castle Island Ventures, and Dragonfly on May 29th, USDT and USDC have a combined market capitalization of over $214 billion.
• With the Fed Funds rate averaging above 5% last year, the $214 billion reserve investing in Treasury and other high-quality bonds could yield at least $12 billion between Tether and Circle.
• Tether reported 2024 profit of $13 billion, while Circle generated $1.68 billion last year.
Investing in stablecoins means buying Circle stock, not converting cash into USDC. The difference is like buying Apple stock vs. adding money in your Apple Pay account.
Headwinds and Tailwinds
On June 17th, the US Senate passed the GENIUS Act of 2025. It establishes a regulatory framework for the $250 billion market for stablecoins. “Stablecoins are a paradigm-shifting development that can bring our payment system into the 21st century", declared Sen. Bill Hagerty of Tennessee, who introduced the bill.
With regulatory certainty, real-world utility and adoption will quickly follow. The future for stablecoins is very bright, and I expect the market size to double soon. However, market leaders Tether and Circle both face strong headwinds going forward.
• Real world utility brings in fierce competition. Big banks and credit card issuers will create their own stablecoins to keep customers on the book. This will slow down Tether’s and Circle’s efforts to attract mainstream financial investors.
• I expect the Fed to cut interest rates by a lot during the remaining 3-1/2 years of the Trump Administration. Some cuts will happen under the current Fed Chair. A lot more will come by his successor beginning June 2026. Lowering interest rates by 100-200 basis points will cripple stablecoin issuers’ main income.
In my opinion, the high dependency in growth and interest rate policies make NYSE:CRCL a very risky investment at the current lofty valuation.
Bullish Signal for Bitcoin
In the past, stablecoins were mainly used by crypto investors. Going forward, mainstream investors will find compelling offerings from their banks, stockbrokers and credit card companies. When mainstream financial intermediaries begin making serious inroad into cryptos, there will be a paradigm shift.
In my opinion, the new development in stablecoins will supercharge the growth of crypto market size. Bitcoin, being well established as a Digital Gold, will benefit the most from the global asset reallocation to cryptocurrencies.
An investor sharing a bullish view on bitcoin could explore the CME Micro Bitcoin Futures ( LSE:MBT ).
Last Friday, the August MBT contract (BTCQ5) was settled at 108,640. Each contract has a notional value of 0.1 bitcoin, or a market value of $10,864. To buy or sell 1 contract, trader is required to post an initial margin of $2,598. The margining requirement reflects a built-in leverage of 4-to-1, which is more cost-effective that buying bitcoins from any ETF fund.
A long MTC strategy with a stop-loss would enhance the returns while limiting the potential losses. Below is a hypothetical trade for illustration purposes only:
On Day T+0, buy 1 BTCQ5 at 108,640 and set a stop loss at 105,000
• The portfolio value is 10,864
• Upfront margin is $2,598
Rising Bitcoin Scenario: On Day T+N, Bitcoin goes up 20% to $130,368
• Futures gain will be $2,172.8 (= (130368-108640) x 0.1)
• Investment return will be +86.6% (= 2172.8 / 2598), excluding transaction fees
• This compares to a 20% gain with bitcoin ETF, with no leverage
Falling Bitcoin Scenario: On Day T+N, Bitcoin drops 20% to $86,912
• With a stop-loss at 105,000, losses will be capped at $364 (= (108640-105000) x 0.1)
• Investment return will be -14% (= -364 / 2598)
• This compares to a 20% loss with bitcoin ETF, with no stoploss provision
Happy Trading.
Disclaimers
*Trade ideas cited above are for illustration only, as an integral part of a case study to demonstrate the fundamental concepts in risk management under the market scenarios being discussed. They shall not be construed as investment recommendations or advice. Nor are they used to promote any specific products, or services.

Mastercard and Visa Shares Decline Due to Stablecoin BillMastercard (MA) and Visa (V) Shares Decline Due to Stablecoin Bill
Yesterday, we reported that the US Senate had passed the GENIUS stablecoin bill, which establishes a legal framework for regulating the stablecoin market. This development led to a sharp rise in the share price of cryptocurrency exchange Coinbase (COIN), while simultaneously putting pressure on Mastercard (MA) and Visa (V) shares.
According to media reports, market participants are concerned that stablecoins could pose serious competition to these companies, which earn revenue primarily from transaction fees. This serves as an example of how blockchain technology, with its low-cost features and high speed, could disrupt leaders in the traditional finance sector.
Technical Analysis of Mastercard (MA) Stock Chart
In May, MA shares formed an upward trend (shown in blue), but this was already broken by a strong downward move, accompanied by a wide bearish gap in the $575–$585 range.
Near the lower boundary of the channel, a contracting triangle pattern (shown in black) can be observed – this can be interpreted as a temporary balance between buyers and sellers. However, it didn’t last long: the widening spread of bearish candles (1 and 2) indicates growing selling pressure.
It’s possible that following a drop of over 9% from the June high, Mastercard (MA) shares might attract buyers betting on a short-term rebound. Nevertheless, in the longer term, developments related to the GENIUS bill could contribute to a continued downward trend.
This article represents the opinion of the Companies operating under the FXOpen brand only. It is not to be construed as an offer, solicitation, or recommendation with respect to products and services provided by the Companies operating under the FXOpen brand, nor is it to be considered financial advice.

Phemex Analysis #91: Pro Tips for Trading Ethena (ENA)Launched in 2024, Ethena ( PHEMEX:ENAUSDT.P ) has swiftly risen as a powerful innovator in decentralized finance (DeFi). Its flagship synthetic dollar stablecoin, USDe, has achieved remarkable growth—ballooning from a mere $100 million supply at the beginning of 2024 to an impressive $5.8 billion, securing the third position among stablecoins by market capitalization. Concurrently, the ENA token itself delivered an astounding 550% price surge over the last five months, placing Ethena firmly among the top 10 DeFi protocols by total value locked (TVL), currently at approximately $5.8 billion.
In December 2024, Ethena expanded its stablecoin offerings by launching USDtb, a stablecoin backed 1:1 by cash and cash equivalents, with a remarkable 90% of reserves held in BlackRock’s USD Institutional Digital Liquidity Fund via Securitize. Ethena’s innovative USDe and the newly introduced USDtb represent crypto-native alternatives to established stablecoins such as USDT and USDC, promising censorship resistance and enhanced on-chain transparency.
Given USDtb's institutional-grade backing and advanced risk mitigation, it stands to substantially impact the broader stablecoin ecosystem, particularly as traditional USD-backed stablecoins face heightened regulatory scrutiny.
With Ethena’s significant innovations and market momentum in mind, let's carefully examine several potential price scenarios traders should be prepared for.
Possible Scenarios
1. Breakout Rise (Bullish Scenario)
Technical analysis indicates that ENA has formed a notable "triple bottom" around the $0.25 area, suggesting robust buying interest at this support level. If this support further solidifies, ENA could soon experience a bullish breakout above the immediate resistance at $0.37.
However, traders should exercise patience as the $0.50 zone represents strong resistance. It is expected that ENA’s price may fluctuate considerably before breaking confidently above this key psychological level.
Pro Tips:
Entry Strategy: Look to enter positions upon a confirmed breakout above $0.37, ideally with increasing trading volume.
Risk Management: Place stop-losses slightly below recent lows around $0.24–$0.25 to safeguard against false breakouts or reversals.
Profit-Taking: Consider partial profit-taking as the price approaches the critical resistance zone near $0.50.
2. Bearish Drop (Caution Scenario)
In a bearish scenario, potentially driven by broader negative market sentiment, ENA’s price could experience renewed downward pressure. A decisive, high-volume breakdown below the crucial support at $0.25 would strongly signal this bearish trend continuation.
Pro Tips:
Short Opportunities: Advanced traders might explore short-selling opportunities if ENA convincingly breaks below the $0.25 support.
Risk Mitigation: Set tight stop-losses to manage exposure, particularly if trading in volatile conditions.
3. Accumulation Phase (Neutral Scenario)
If the key $0.25 support successfully withstands selling pressure, Ethena’s price may enter a period of consolidation, bouncing between $0.25 (support) and $0.37 (resistance). Such consolidation typically reflects market indecision and accumulation before a substantial directional move.
Pro Tips:
Range Trading: Consider employing strategies such as grid trading to benefit from regular price oscillations within this trading range.
Observation and Patience: Stay observant for changes in volume or price momentum, as these could signal an imminent breakout or breakdown.
Conclusion
Ethena (ENA) is positioned at an intriguing crossroads, supported by impressive fundamentals, innovations, and growing market influence. Traders should closely monitor the outlined technical scenarios—recognizing key support and resistance levels, employing disciplined risk management, and capitalizing strategically based on evolving market conditions. With careful planning and timely execution, traders can confidently navigate Ethena’s current volatility and capture potential upside opportunities.
🔥 Tips:
Armed Your Trading Arsenal with advanced tools like multiple watchlists, basket orders, and real-time strategy adjustments at Phemex. Our USDT-based scaled orders give you precise control over your risk, while iceberg orders provide stealthy execution.
Disclaimer: This is NOT financial or investment advice. Please conduct your own research (DYOR). Phemex is not responsible, directly or indirectly, for any damage or loss incurred or claimed to be caused by or in association with the use of or reliance on any content, goods, or services mentioned in this article.

Stablecoin Dominance vs Altcoins – Final Altseason Loading?This chart visualises a powerful relationship — stablecoin dominance (USDT.D + USDC.D) versus OTHERS dominance (i.e. altcoins excluding BTC and ETH).
Put simply:
When this chart moves down, stablecoins are flowing into altcoins — risk-on behavior, altseason ignites.
When it moves up, capital rotates back into stables — risk-off behavior, weakness across alts.
This has nailed every major altseason impulse and correction cycle over the past few years.
Right now, we’re seeing this pair push higher into a key supply zone — the same distribution range it previously broke down from. My expectation is a retest of that breakdown zone, which should align with a short-term correction in the altcoin market.
📉 Once this retest plays out and we see signs of weakness at supply, I anticipate continuation bearish in this pair — leading to stablecoins flowing back into altcoins.
That next leg down into higher time frame demand could mark the final altseason push, before the broader market tops out. If we follow the usual cycle pattern, that last alt impulse will likely drag retail back in for the top — just before distribution takes over and the bear phase begins.
🧠 In short:
Push into supply → altcoin correction
Breakdown → capital rotation back into alts
Final altseason + market top → bottoming of this chart + reversal bullish
This will be a key chart I’ll track closely over the next few months — it offers one of the cleanest reads on altcoin liquidity flow and timing for top formation.
1W:

World Liberty Financial STABLECOIN | Everything YOU Need to KnowWorld Liberty Financial (WLFI), a DeFi lending protocol launched in 2024 and notably associated with the Trump family, is currently executing a key operational test for its new stablecoin, USD1.
This U.S. dollar-pegged stablecoin was introduced in March 2025 and backed by Treasuries and cash equivalents. It has already seen rapid adoption, surpassing $2.1 billion in circulation.
To validate their on-chain distribution systems ahead of a wider rollout, WLFI is conducting a test airdrop, proposing to send a small and fixed amount of USD1 to all existing $WLFI token holders on the Ethereum Mainnet. A governance vote on this proposal, set to conclude this Wednesday, May 14th shows overwhelming community support, with over 99.9% approval which is signalling confidence in the initiative's technical goals and community reward aspect.
Investors should note that while the vote seems assured, critical details like the exact USD1 amount per wallet and the precise airdrop date are yet to be announced, pending the vote's finalization. Also, WLFI retains discretion to modify or cancel this test distribution. This operational step occurs against a backdrop of significant scrutiny surrounding WLFI, stemming from its high-profile political connections, reported investigations, and potential conflicts of interest highlighted in various media outlet.
this test airdrop represents a practical infrastructure check and a community engagement tactic for WLFI as it builds out the ecosystem for its rapidly growing USD1 stablecoin. For current $WLFI holders, it presents a small token distribution contingent on final details announced after May 14th. For prospective investors, it's an operational milestone to observe, weighing the technical progress and market adoption of USD1 against the unique regulatory and political risks associated with the World Liberty Financial project.
____________
BYBIT:WLFUSDT

Steibles dominance: USDT.D+USDC.DThe graphic shows Kryptan blood and tears - in red variant. And bullish crypto - triumph in blue!
I am of course counting on the blue variant, as:
1)There has been no normal bulls with the fall of bitcoin dominance.
2)The American newly elected tech team hasn't shown anything meaningful except loud populist statements and family memes.
3)Stimulus with rate cuts, QE, M2 and other liquidity releases haven't really kicked in yet
So I'm waiting for an epic risk on and exit pamp!
Translated with DeepL.com (free version)
