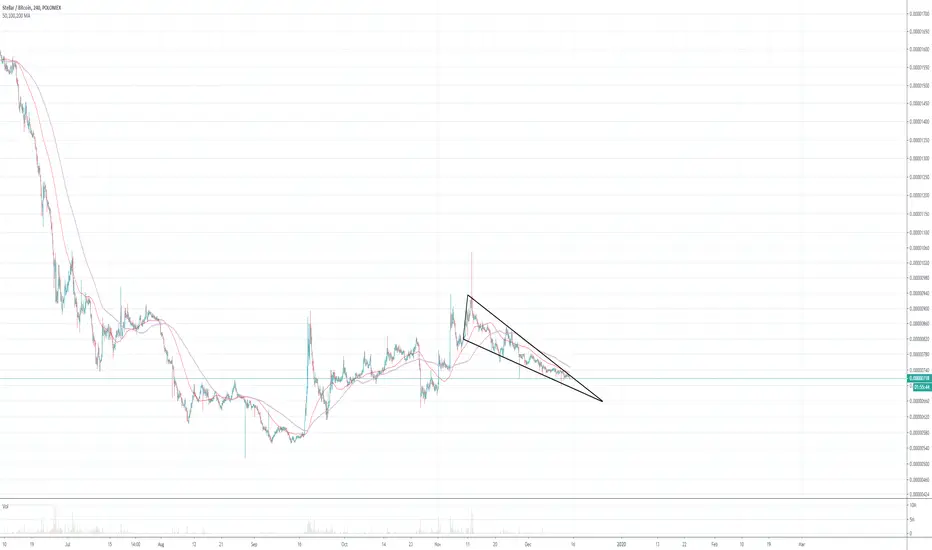
XLM / USD - LOOKING AT DOWNWARD CHANNEL - CryptoManiac101XLM / USD TA
Here we clearly se descending channel which will encounter support around $0.012 and can only be considered bullish on break above $0.065 - $0.07
Partial entry for long term holders is recommended, however it is not recommended to enter into any short term positions.
Stellarusd

XLMUSD is forming bullish Butterfly for upto 129% big moveXLM is forming bullish buttefly for upto 129% plz use the stop PRZ level as stop loss.
Targets are:
Buy between: 0.0454 to 0.0335
Sell between: 0.0546 to 0.0770
enjoy and regards,
Atif Akbar (moon333)


Stellar Lumens possible 120% increase over the next 2 monthsBased on RSI and wavetrends lining up with what looks like to be a bullish pennant.
Just collecting ideas to learn. Any feedback appreciated.

XLMUSD forming bullish Crab | Upto 98% bullish move expectedPrice action of Stellar / US Dollar is forming bullish Crab pattern and soon it will be entered in potential reversal zone.
This PRZ area can be used as stop loss point in case the complete candle stick closes below this area.
I have used Fibonacci sequence to set the targets:
Buy between: 0.048953 to 0.038544
Sell between: 0.057035 to 0.076600
Enjoy your profits and regards,
Atif Akbar (moon333)

XLMUSD Has Formed Crab Within BAT And Competed The Bullish SetupIn my previous post I elaborated that how the price action of Stellar has formed a very big bullish BAT pattern on month chart and completed the bullish setup for upto 596% gains.
But the recent bearish move of price line that was started since Nov 2019 to Dec 2019 and leaded the price action more than 53% down.
The above bearish move pushed the forced the price action to hit the support of potential reversal zone of this big bullish BAT pattern even now the price action is hitting the spike beyond this PRZ support.
But now the price action of Stellar has shown another positive move that it doesn’t move down straight even it is moved down in another Fibonacci sequence which can be clearly seen on 2 day chart with Heikinashi candle sticks setup and it has formed bullish Crab pattern within this potential reversal zone of bigger bullish BAT pattern. For last leg the price action was required to retrace between 1.27 upto 1.618 Fibonacci sequence and if we measure its move then it has retraced upto 1.283 and full filled the requirement and confirmed that it is a bullish Crab:
The above harmonic move of Crab pattern has confirmed that the price action is ready to move up again and the next candle on month chart will be moved again within the potential reversal zone of big Bullish BAT pattern or sideways with the current candle and the fear of breaking down the support of this PRZ level is decreased even finished.
Now the targets can be two:
For mid term trade on 2 day bullish Crab pattern:
Buy between: $0.048953 to $0.038544
Sell between: $0.057035 to $0.076600
This trade setup has potential to give upto 98% profit.
For Long term trade on month chart bullish BAT pattern:
Buy between: $0.110241 to $0.059381
Sell between: $0.231517 to $0.413568
This trade setup has potential to give upto 596% profit.
But if the candle stick closes above the 0.786 Fibonacci projection of A to D leg of bullish BAT which is at $0.413568 then the price action may achieve the highest price ever in the history of xlm or atleast it will hit the final resistance of 0.41 dollar.
In both trades we can use the support of potential reversal zone as stop loss in case of complete candle stick closes below this PRZ level.
Regards,
Atif Akbar (moon333)

XLM - IN FREE FALL WITH SUPPORT AT 20 CENTS - CryptoManiac101XLM / USD TA
Quick overview of XLM shows us the next closest strong support is only around 20 cents with current position being in free fall. That does not mean that we do not bounce from one of the weaker short term support zone in coming month, however strictly TA speaking overall pattern is highly bearish in this case. With that said we would not exit our positions at this phase if we held any and would be watching that 40 cents weak short term support closely.

Stellar breach of falling wedgeBreach of falling wedge may lead to upsides, prices often drop out of falling wedges to the downside, this is a good time to add to your position if faith is kept in the falling wedge.

STRBTC Falling wedgeStellar is in a falling wedge pattern, breach of the bottom of the falling wedge may signal an immediate upside.
XLMUSD formed bullish Crab | A long opportunityPriceline of XLM / US Dollar cryptocurrency has formed a bullish Shark pattern and entered in potential reversal zone.
This PRZ area should be used as stop loss point in case of complete candle stick closes below this area.
I have used Fibonacci sequence to set the targets:
Buy between: 0.052774 to 0.051811
Sell between: 0.053524 to 0.055333
Regards,
Atif Akbar (moon333)

XLM/USDT Good Entry PointChart has strong daily support and high credit ratings.
butterfly harmonic pattern
and 31 dec funda upgrade
SydTechnical - December 2019


XLMUSD formed bullish Crab | A buying opportunityPriceline of XLM / US Dollar cryptocurrency has formed a bullish Crab pattern and entered in potential reversal zone.
This PRZ area should be used as stop loss point in case of complete candle stick closes below this area.
I have used Fibonacci sequence to set the targets:
Buy between: 0.056838 to 0.055971
Sell between: 0.057510 to 0.059134
Regards,
Atif Akbar (moon333)


XLMUSD formed bullish Gartley | Upto 23% expectedPriceline of XLM / US Dollar cryptocurrency has formed a bullish Cypher pattern and entered in potential reversal zone.
This PRZ area should be used as stop loss point in case of complete candle stick closes below this area.
I have used Fibonacci sequence to set the targets:
Buy between: 0.07214152 to 0.06784270
Sell between: 0.07552560 to 0.08360964
Regards,
Atif Akbar (moon333)

XLMUSD formed bullish Cypher | A log opportunityPriceline of XLM / US Dollar cryptocurrency has formed a bullish Cypher pattern and entered in potential reversal zone.
This PRZ area should be used as stop loss point in case of complete candle stick closes below this area.
I have used Fibonacci sequence to set the targets:
Buy between: 0.078361 to 0.077317
Sell between: 0.079354 to 0.081503
Regards,
Atif Akbar (moon333)

XLM BATTLING RESISTANCE - 75% PROFIT POSSIBLE - CryptoManiac101XLM / USD TA
We have been observing arc like pattern for XLM for a while now. We also see points of extreme resistance in eight cent ranges which wasn't even broken upon 50% Supply burn.
At this point we will continue to keep a close eye on XLM with possible entry on strong and convincing resistance break which should be tested again this month.

The BAT Always Pushed The Stellar To Achieve Highest Price EverThe XLM token started with the opening price of $0.002251 in Jan 2017 as per Kraken exchange and reached at $0.06700 within 4 months on May 2017 that was more than 2,876% huge bullish move which brought the Stellar in lime light and in a very short period of time the token came among the top cryptocurrenices list.
The market cap was increased from 17,173,226 to 585,609,334 which was more than 3310% difference.
Then after May 2017 to July 2017 the XLM faced strong bearish trend and the price action dropped from $0.067 to $0.0122 and that was a really huge loss of more than 81%.
For more than 3 months this bearish trend was continued and on week chart every candle stick was being closed lower than the previous candle stick and the people were expecting more worst situation for future.
Upto July 2017 the Stellar was not as that much older that the traders would get signals from different indicators on week chart even the first exponential moving average with time period of 20 was appeared in May 2017.
The Nature's Role:
But in the meanwhile the nature was playing its role and the supply and demand of traders formed a harmonic pattern that was a bullish BAT harmonic pattern. After initial leg which was from Mar 2017 to May 2017 the B leg was retraced upto 0.50 Fibonacci and B to C leg projected between 0.382 to 0.886 Fibonacci and this was the projection of A to B leg as exactly required for BAT. Then the last C to D leg retraced between 0.786 to 0.886 and this was the potential reversal zone as per bullish BAT, then from July to Aug 2017 the consolidation period started and the price action moved sideways. Then in all of a sudden the exponential moving average 10 which was likely to cross down the EMA 20 to form a death cross, moved aggressively up and in very next week the price action hit the 51 cents which is the all time high sofar by Lumens.
This time the Stellar is making almost similar move and this move is more broader than the previous move of 2017, and we also have more indicators and moving averages available to measure the priceline moves.
After Feb 2018 we had a strong bear move which leaded more than 69% loss then in the month of April 2018 the bulls took the charge again and brought the XLM price upto $0.46200 and recovered more than 59% loss but this move was not for making another high therefore after hitting the $0.46200 the bears took the charge again and leaded the price action upto $0.052 in Sep 2019 which was more than 89% loss from the highest ever price of $0.5100.
1st sign of breakout:
Since Feb 2018 the price action was moving within a pennant and after a year on Feb 2018 the priceline hit the second time on pennant support and this hit produced a bounce which leaded the price to hit the resistance of pennant and broke out on May 2019, during this the exponential moving average 10 was likely to cross up the EMA 20 but could not make this golden cross then a price correction period started which leaded the price again down upto $0.0542, this time the RSI went in oversold zone and now the EMA 10 is again moving up to make another attempt to form a golden cross with EMA 20 if this golden cross will be successfully formed then it can again lead the price action for all time high as it took place in Aug 2017. We have the MACD strong bullish.
Stochastic upto month chart has given bull cross.
The Nature Is Again Playing Its Role:
Again the buying and selling trend from the humans has given the price action some certain directions and the Stellar has formed again a very big natural bullish BAT pattern on month chart.
After initial leg the A to B leg is almost retraced upto 0.50 Fibonacci and B to C leg is moved the projection area of A to B leg between 0.382 to 0.886 Fibonacci and now again the last leg is retraced between 0.786 upto 0.886 Fibonacci And this time the Stellar price is again entered in potential reversal zone of BAT like it was in July 2017 and now we can expect another very strong bullish divergence which can lead the price action to achieve higher than the previous high 51 cents.
Even though this move can lead to the highest ever price in the history of XLM but realistically we can sell between 0.382 ot 0.786 Fibonacci projection of A to D leg, so the targets can be as below:
Buy between: $0.110241 to $0.059381
Sell between: $0.231517 to $0.413568
Regards,
Atif Akbar (moon333)

XLM/STELLAR - CUP AND HANDLE FORMATIONStellar can start climbing up again when its went through the dt channel. There is a potential to get the cup and handle formation after long time..
But up on there is a strong resistance which has to be broken as first.

XLMUSD forming bullish BAT | Upto 22% expectedThe priceline of XLM / US Dollar cryptocurrency is forming last leg of bullish BAT pattern and soon it will be entered in potential reversal zone insha Allah.
This PRZ area should be used as stop loss in case of complete candle stick closes below this zone.
I have used Fibonacci sequence to set the targets:
Buy between: 0.072350 to 0.070104
Sell between: 0.077704 to 0.085743
Regards,
Atif Akbar (moon333)

Stellar Lumens (XLM) nearing breakout in USD termsBased on previous breakout of downward trendline the potential for huge gains over the next month or so are great. The Meridian conference over the next couple of days will likely provide a huge clue as to the scale of the next move higher.

XLMUSD formed Shark | A good buying opportunityPriceline of XLM / US Dollar cryptocurrency has formed a bullish Shark pattern and entered in potential reversal zone.
This PRZ area should be used as stop loss point in case of complete candle stick closes below this area.
I have used Fibonacci sequence to set the targets:
Buy between: 0.068239 to 0.067357
Sell between: 0.069275 to 0.071303
Regards,
Atif Akbar (moon333)
