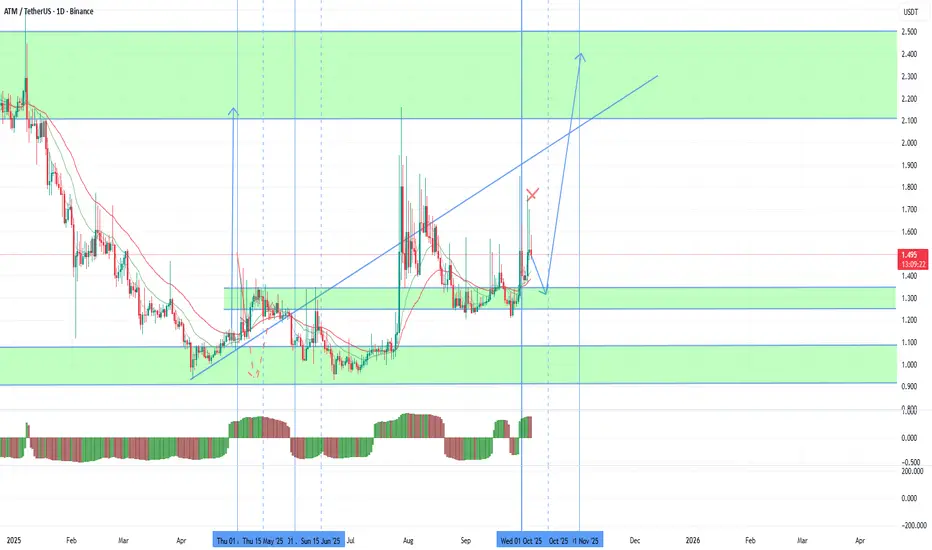
ATM CITY JUV ACM will retain the potential of the X's in quarterAs I mentioned in the last market review, the probability of sales for most coins and disruptions of ETH remains predominant. Against this background, the oversold ATM CITY ACM JUV fantokens are extremely interesting for speculators. The quarter opened above the supports, which gives a strong bullish signal. Quite large purchases are immediately observed against this background. When selling on ETH, there is an opportunity to shadow on CHZ to a retest of 0.041-425, which so far prevents x on fantokens. This can create new favorable prices for scalping. In particular, for ATM, there is a possibility of a pullback to a retest of the 1.25-35 range, which is the main support in this monthly candle. Next, you can have a new stable bullish reversal of the monthly candle from the middle of the month and consolidate the formed trend line. In the absence of a drawdown on ETH and CHZ, continued growth is possible from the middle of the week. CITY JUV and ACM did not give significant impulses to retest the resistances, which is why the probability of growth from current levels is slightly higher for them.
STO
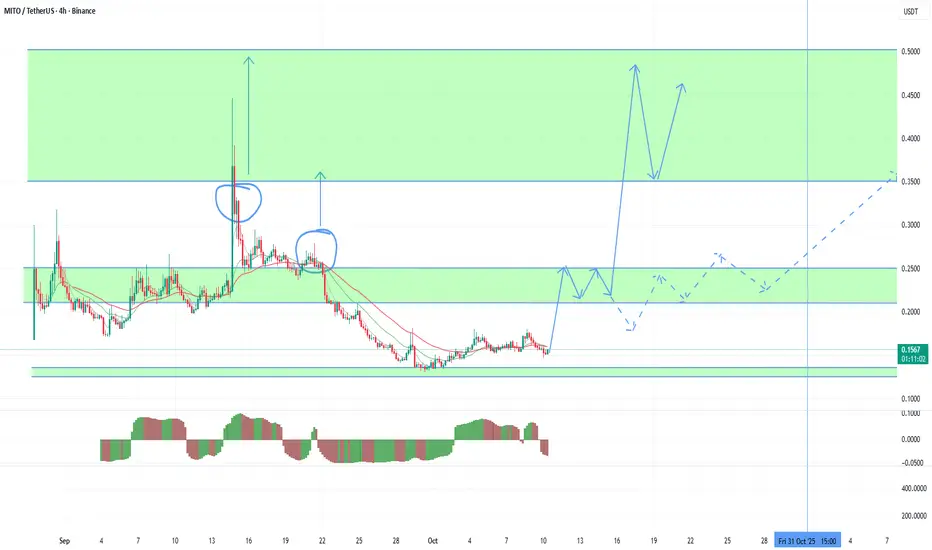
MITO is ready to repeat the achievements of STOStarting this weekend, the probability of new waves of growth in alcoins is growing, and I want to consider the situation with the coins that I keep in mind for work.
First of all, I will consider more reliable options for working in the mid-range, where you can hold a position from current levels and top up in case of a test of lower support in a falling market, such as the MITO VIC HOOK BMT. In this review, I will pay attention to MITO, which can repeat the STO picture this month. With the current issue, the main support is the range of 0.125-35, below which a fall is possible only if ETH falls to 3500-3750, which will create a good opportunity for additional confident earnings. This week, the 4750 level was re-broken for ETH, which is a signal for a second attempt to break 5000. It is more likely that this attempt will be made as early as next month. However, reducing the threat of a further drop in ether is already giving rise to purchases on MITO. And so purchases can be kept from the current levels, as there has been a rebound from the main support. In an optimistic scenario, a sharp increase may begin as early as this weekend with the closing of the weekly bullish candle and the continuation of the trend in the new week. The immediate goal is to return to the resistance in the range of 0.21-25, after the rebidding, which will open the possibility for a test of 0.35-50. This range is the main target for current emissions. With the negative dynamics of ETH, there is a possibility of a decrease in growth rates. In this case, we can see a significant pullback from 0.25 with the continuation of the trend after the opening of a new monthly candle above 0.21.
Among the weak coins, PIVX proved to be the main option for working with the greatest growth potential. There was an open zone until the 0.35-50 test, however, the breakdown occurred against a rather negative opening of the quarter, which is highly likely to lead to sharp disruptions in growth. Also, this token is essentially a dummy and carries only speculative interest, being a potential contender for adding the monitoring and delisting tag. I will consider it back to work only after returning to the range 0.100-125. However, this weekend the trend may still hold against the background of the absence of further decline in ETH.
Among similar coins with weak dynamics, the probability of assigning the monitoring tag, but high undeveloped targets are chess with a probability of growth up to 100%+ from current levels and ADX FIO with a potential for growth up to 50%+ from current levels, but also an additional drawdown before rising to 20-25%.
ATM ACM CITY JUV fantokens have a similar growth potential to PIVX. However, it is worth bearing in mind the extremely low liquidity and long accumulation of these instruments when choosing a position size.
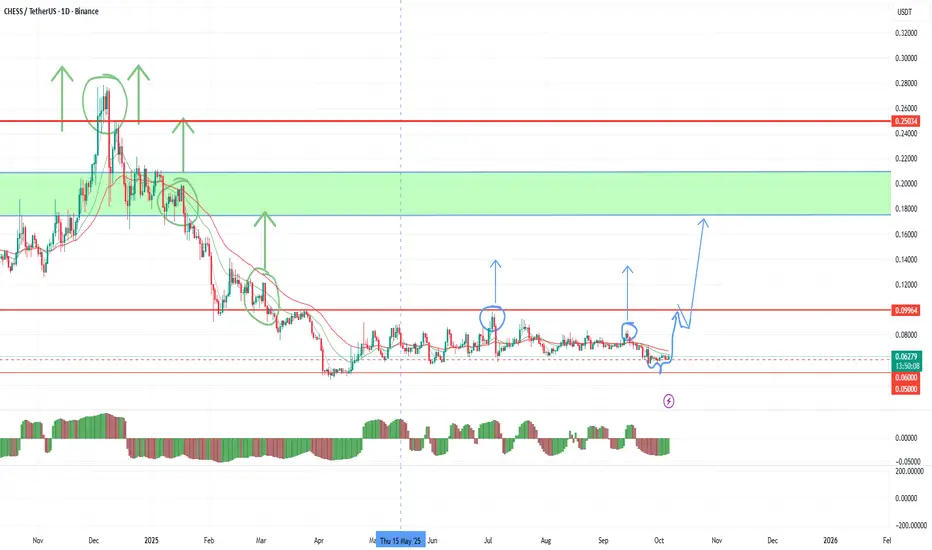
Positive opening of the quarter by CHESSToday I want to pay special attention to CHESS. Against the background of the growth of STO, CELO and KERNEL, there is a possibility of purchases of other DEFI group coins, among which CHESS is the most oversold. The quarter for this token opened above the long-term strong support of 0.05, which is a confident bullish signal in the medium term. This week opened above the intermediate resistance of 0.06, which gives a signal for the start of the trend and an attempt to work out an inverted head and shoulders pattern with an attempt to test the next strong long-term level of 0.1, consolidation above which makes it possible to increase the scale of price movement up to 0.25. For this token, very large volumes of purchases were left on the market for a retest of 0.25. If the market breaks down, there is a possibility of new tests of 0.05, but given the medium-term bullish mood, you can keep a constant position from current levels and scalp in case of lower impulses.
The overall picture of the market this week also contributes to the maintenance of the crypt. ETH opened the week below the strong resistance of 4500, which gives rise to the failure of new attempts to storm 4750, but oil opened the week with a strong bullish gap, which supports the currency market and still leaves room for retests of 4750 on ETH, as I wrote in the last review. Taking advantage of this flat in the market, CHESS has every chance of successfully consolidating above 0.1 before a possible fall in ETH.
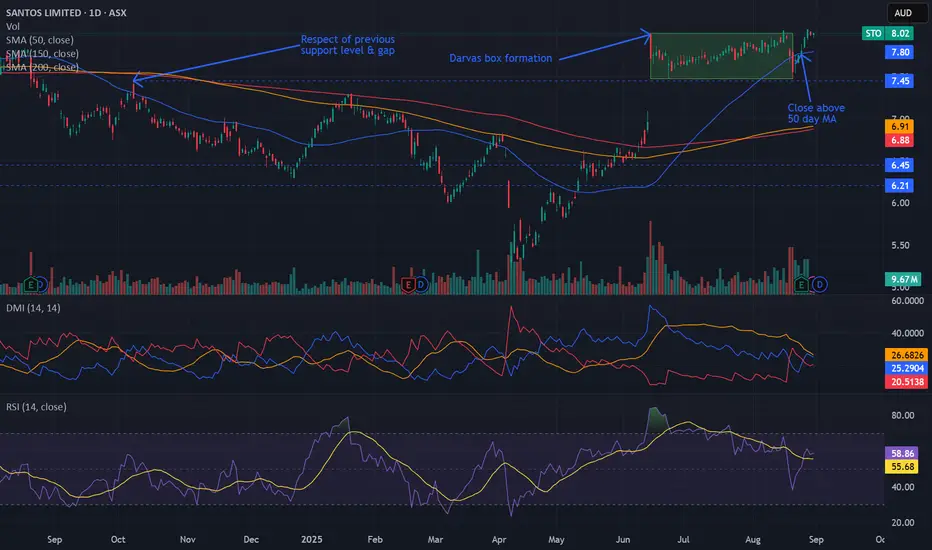
Bullish potential detected for STOEntry conditions:
(i) breach of the upper confines of the Darvas box formation for $ASX:STO.
- i.e.: above high of $8.02 of 16th June (most conservative entry), and
(ii) swing up of indicators such as DMI/RSI.
Stop loss for the trade (based upon the Darvas box formation) would be:
(i) below the support level from the low of 20th August (i.e.: below $7.48).
STO/USDT THE FLY EFFECTSTO/USDT are in a trend, which can break.
We will follow the confirmations in the coming time frames.
Volume looks interesting.
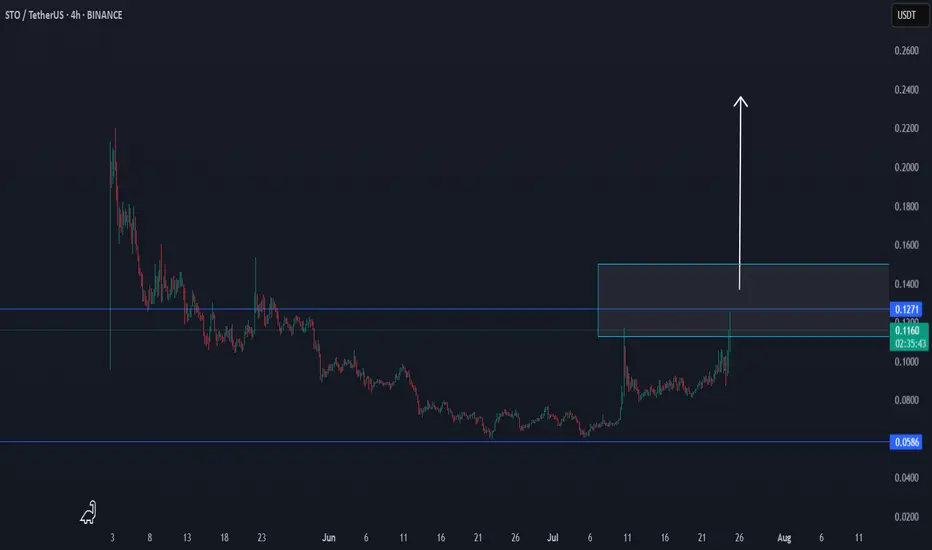
StakeStone, Falling Wedge & Easy 205% Profits PotentialIs it too early? It is never too early to be early. StakeStone started trading in early May, less than two months ago. The chart is young but the pattern is old; a perfect falling wedge.
There is a low 22-June and many pairs ended their correction on this exact day. StakeStoke broke out of the falling wedge pattern, based on an internal trendline, so there is already some signals favoring an up-move next.
Predicting the next move is not hard, up. What is harder is the timing, how long will it take for STOUSDT to start an upsurge? It is very close. It is so close now that I can say within days, or, I can also say that it is already growing because a low happened on the 22nd, but to say this we need confirmation.
The confirmation comes when prices move above 0.0750 and beyond.
This is a good chart. Very low risk with a high potential for reward. It is a good chart but remember that there is always risk involved. Market conditions can change, prices move down rather than up. If this happens, just wait patiently because a reversal is very close. This is only a warning, we are 100% bullish.
Thanks a lot for your support.
Namaste.

POLYMESH $POLYX As you know I've been interested in fractals for a long time and recently I've been interested in fractals projects after the initial listing, I saw this project which at first glance seemed new to me, but it's not, it's Polymath which rebranded and decided to develop in the same direction of securitization of the market, but more ambitiously launched its blockchain and got a Swiss license.
Post about RWA
Frankly speaking, I have been following the direction of securitization since 2017 and always saw prospects in it (securitization tokens, exchanges for securitization tokens, STO) but there were a lot of problems, because before only credited investors could trade on special platforms, etc. By 2024 the market gave a little progress now everyone is talking about the RWA (real world asset) acceleration. Post about RWA
In which I also see the future.
this is the coinmarketcap for such assets - just look at it.
stomarket.com
Back to the POLYMESH project, they say they will be trading tokenized assets (RWAs) on their blockchain and there is a lot of promise here if they do indeed tokenize assets
They are in the process of transitioning from POLY to POLYX.
Speaking of fractals, I've shown above the chart the POLYGON fractal when it all started. What you see the big green candles up is buying at 177M capitalization.
This is a high risk investment, do your research, post your opinion in the comments.
Best Regards EXCAVO

I see nothing good here... There is literally nothing good seeing #Euro and #USD reaching parity.
Clearly, and despite the roughly same volume at each top, the 6-year-double top is no joke. Especially considering the fact that its fueling the violation of a major round-numbered multi-year support right at this moment.
Most probably if not sure, Due to the fact that it takes longer to build than to tear down, #EURUSD will trade between 0.80-0.90 before Dec22 pushing the market into a (deeper) recession and inflation will hit harder this time.

XTZ on the next Bitcoin $250k Peak with three possible pricesXtz on three possible price points going into the next Bitcoin Bull Run 2023. Keep in mind Tezos is a baby platform but with a massive war chest of over $600 million from their ICO. They are a likely candidate like Cardano to displace Ethereum as the number two in crypto rankings. Tezos has brilliant coders/programmers and tackling the STO market which will be a massive shift from conventional Wall Street markets. This is a gem waiting to explode. The three price targets I have her are between $250.00 up to $2,500.00. Please keep in mind that this is only my opinion and I am basing this on the current trendline trajectory that is apparent on this three-year chart.

EUR/CHF🇪🇺 🇨🇭 to RISE and test the 1.07344 level.EUR/CHF🇪🇺 🇨🇭 is rising in the Upward and we see that the price is coming back to the channel. According tot he bullish cross of 25&50 ma , ROC 6 swing an crossover of the Stochastic the price is going to test the 1.07344 level.
If you like the idea PLEASE don't forget to hit the LIKE 👍👍👍button
Also share your thoughts and charts here in the comment ⌨️ section.

ICON is primed to make HUGE gains - over 2500% GAINSIcon is one of the gem many has yet to realise. This is the Korean ETHEREUM. Icon is the only one that is worth mentioning in KOREAN market as of now. LITERALLY can own 50% of Korean market when this matures as Icon is already working with huge enterprises and Korean governments now.
One reason i say this is because it is building an STO platform. this platform enables publicly listed or even SME companies (ANYONE) to join Icon network to launch tokenisation services.
And STO reminds us of ICO. what ICO helped ETHEREUM make 10000% gains.
So in long term outlook, icon can do this gains, and a wider and more regulated light.
Right now, Icon development for STO token standard is completed.
We are only waiting on STO smart contract(stabilization stage) and official STO platform in ICONest 2.0 (in development).
31st May 2020 is their next update on development. Of course STO is the only thing im mentioning here, Icon has also recently partnered LCX, which is an STO platform regulated and partnered with World Economic Forum! This is a hint for you guys.
What the chart means?
This means, every $1000 invested into ICX can potentially make you $25000. or 25X your Bitcoin holdings.
MACD in Long term is looking BULLISH! and you know when weekly shows bullish, icon can jump up to the sky. If you are not a trader and long term holder, this is def a good one to get on IMO. 100 million Market Cap for ICON is just a dream. this can go up beyond 10Billion in a bull run
This is just being conservative when it reaches near ATH of last bull run, and we know once bull run started, prices goes crazy up. and another 100x from here is not unachievable. which means every $1000 into ICX can make you $100000.
This is also under a hedge fund manager Buy Up to list of $5 currently and in a bull run its going up and beyond. Current price is only a small 0.30 cents. an easy 10X SHORT term. The chart drawn can happen sooner if development and partners start using ICON Platform. a true gem to watch for.
This is just my opinion. DYOR


Binance Coin (BNB) Pump coin again??? NEW IEO is coming soonBinance Coin (BNB) Pump coin again??? NEW IEO is coming soon
Binance Launchpad - Token Launch Platform
I'm buyed.
Target is = NEW HIGH
Stop scenario = $23.49

OWN lauching STO's in April May and June,, Retraced to 0.618 fib,.. Make or brake situation at this point. RSI looking good with no bearish signs.
Stochastic momentum should shift north,,

$STO $5.96 beware the news. You're missing a shoulder bruvSure itll gap up this am,nice exit for ST traders, but cant see it staying up
Chart has notes


Long Statoil oversold / +200smawww.tradingview.com
Stock is oversold and ready to reverse. Statoil got good volume and market cap. Target is floating stop/loss = 0.5
Ride this baby to the moon, or jump off if it's out off fuel and reaches the stop-loss.

US OIl WTI CLK7May Oil contract rolls Apr 20. Expect a gap!
Open Interest is currently 2.22m (Mar 28 CFTC Reports)
Time Line: Mar 28, Mar 21, Mar 14, Mar 7, Feb 28
K (000's)
Producer Longs: 410, 416, 402, 342, 323
Prdcr Shorts: 663, 678, 674, 663, 661
Prdcr Net: 253, 262, 272, 321, 338
Money Manager Longs: 345, 361, 384, 418, 429, 449
MM Shorts: 135, 128, 129, 61, 61, 44
MM Net: 210, 233, 255, 357, 368, 405
The tables suggest both producers and MM's have reduced their May positions around March 7+
They have rolled forward - longer months have risen and increased :=+40 pts
The OI is total all months out to 2021. Current month (May) is 586k
My chart says this contract is still long.
My Weekly chart says old Support now Resistance was circa $53 and my rising channel base is circa $51.
The ellipse at $52 is possible as there is minimal resistance in front of us to $53.30
In any event this contract only has about 12 Trading Days tops before I move to Jul (N) which is circa 80 pts+ on May.
So $2.00 (4%) in <12 days

CLK17 WTI Weekly FuturesFeb 13 19:30 AEDT
CL WTI May Weekly Update
Consolidation and Seller Absorption Bars!.
Buy Area -sub $54.20 down to $54.00
(I don't think it will make $53.50)
Good Support at $53.10/20 (buy a few wells at that price)
Struggling with the T-Line at the moment,
but the 55 SMA is sweeping up nicely for added future support.
Text book Dow with a break out; higher highs / higher lows
and it appears to be now re-testing the breakout.
Looking at the big picture this really look like a bull trap flag, but the arithmetic doesn't work,
so I am bullish until it breaks below $53 then it could free fall back to $46 coz there is nothing
to stop it, then break below and back to double bottom at $37.
But right now I am with the CoT and Long with a tgt expectation of those upper body gaps.
Remember you are Adults and this is only my opinion, not a guarantee
... and just my 2c worth

