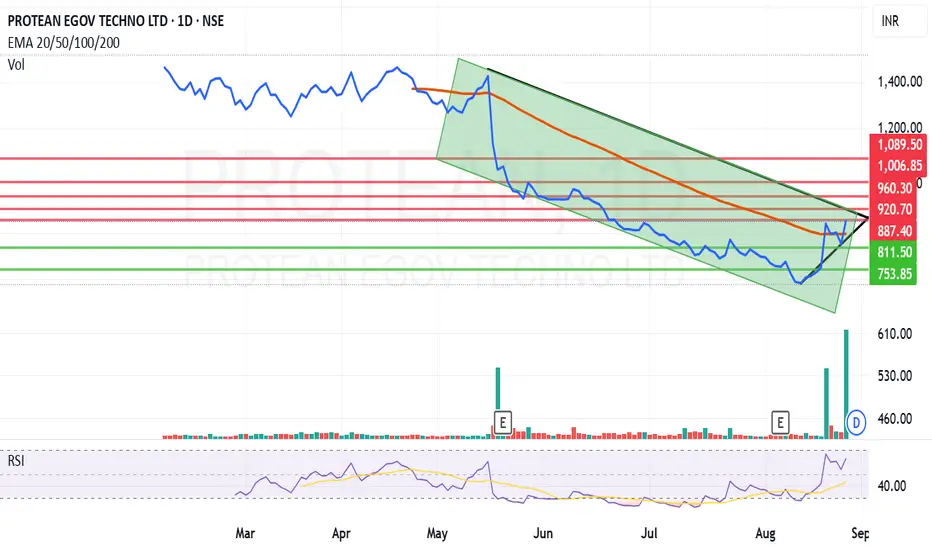
Protean eGov trying to move further upwardsProtean eGov Technologies Ltd. closing price is 883.35 . This is an information technology enabled solution company that engages in conceptualizing, developing and executing nationally critical and population scale greenfield technology solutions. It collaborates with the government in creating digital public infrastructure and developing citizen-centric e-governance solutions. The firm provides corporate and retail services. The corporate services include e-Governance solutions, system integration services, business process re-engineering, solution architecture, datacentre co-location services, managed services provider, and IT consulting services. The retails include EzeeWill, commercial taxes facilitation centres, PAN card, UID enrolment, NPS, e-Sign, Vidyasaarathi, Vidya Lakshmi, and Vidya Kaushal.
Negative aspect of the company is MFs have decreased their holding in the last quarter and declining net cash flow. The positive aspects of the company are that it is a company with Zero promoter pledge and no debt, book value of the share increasing since 2 years.
Entry for paper trading can be taken after closing above 888. Resistances will be at 920, 960 and 1008. Peak resistance as of now seems to be at 1089. The support or the stop loss in the stock can be maintained at 811 or 753 depending on your risk taking ability.
Disclaimer: The above information is provided for educational purpose, analysis and paper trading only. Please don't treat this as a buy or sell recommendation for the stock or index. The Techno-Funda analysis is based on data that is more than 3 months old. Supports and Resistances are determined by historic past peaks and Valley in the chart. Many other indicators and patterns like EMA, RSI, MACD, Volumes, Fibonacci, parallel channel etc. use historic data which is 3 months or older cyclical points. There is no guarantee they will work in future as markets are highly volatile and swings in prices are also due to macro and micro factors based on actions taken by the company as well as region and global events. Equity investment is subject to risks. I or my clients or family members might have positions in the stocks that we mention in our educational posts. We will not be responsible for any Profit or loss that may occur due to any financial decision taken based on any data provided in this message. Do consult your investment advisor before taking any financial decisions. Stop losses should be an important part of any investment in equity.
Stocks!
Bajaj Consumer Care looking strong on charts.Bajaj Consumer Care Ltd. Closing price 229.51 engages in the manufacturing and marketing of cosmetics, toiletries, and other personal care products. Its brands include Bajaj Almond Drops, Bajaj Coconut Oil, Bajaj 100% Pure, Natyv Soul, Bajaj Nomarks, and Bajaj Brahmi Amla.
Negative aspects of the stock is MFs decreased their holding in the stock in last quarter. Decline in net cash flow and high PE (25). Positive aspect of the company is that it is a company with no debt and Zero promoter pledge.
Entry for paper trading can be taken after closing above 233. The resistances for the stock will be at 248, 262 and 283. The support or the stop loss in the stock can be maintained at 204 or 196 depending on your risk taking ability.
Disclaimer: The above information is provided for educational purpose, analysis and paper trading only. Please don't treat this as a buy or sell recommendation for the stock or index. The Techno-Funda analysis is based on data that is more than 3 months old. Supports and Resistances are determined by historic past peaks and Valley in the chart. Many other indicators and patterns like EMA, RSI, MACD, Volumes, Fibonacci, parallel channel etc. use historic data which is 3 months or older cyclical points. There is no guarantee they will work in future as markets are highly volatile and swings in prices are also due to macro and micro factors based on actions taken by the company as well as region and global events. Equity investment is subject to risks. I or my clients or family members might have positions in the stocks that we mention in our educational posts. We will not be responsible for any Profit or loss that may occur due to any financial decision taken based on any data provided in this message. Do consult your investment advisor before taking any financial decisions. Stop losses should be an important part of any investment in equity.

What Is a Pyramiding Strategy, and How Does It Work in Trading?What Is a Pyramiding Strategy, and How Does It Work in Trading?
Pyramiding is a trading strategy where traders gradually increase their position size as the market moves in their favour. Instead of committing full capital upfront, they add to winning positions at key levels. This article explains how pyramiding works, common strategies, potential risks, and key considerations for traders looking to add it to their trading approach.
What Is Pyramiding?
Pyramiding is a strategy where traders gradually add to an effective position instead of going all in from the start. It’s used in trending markets, where traders look to take advantage of sustained price movements by expanding their exposure as the trend develops. The key difference between pyramiding and simply increasing position size at the outset is that pyramiding limits initial risk. Instead of committing full capital upfront, traders build up their position only when the market moves in their favour.
Applying a pyramid to a position is particularly common in markets with strong momentum. A trader, for example, might start with one unit of an asset and, if the price moves favourably, add another half-unit at a predefined level. If the trend continues, they might add another quarter-unit. This gradual scaling means more capital is committed only when conditions confirm the trend.
The logic behind pyramiding in trading is straightforward: when the market is moving in the right direction, the strategy compounds potential returns without significantly increasing initial risk. It also allows traders to adjust their exposure based on market conditions rather than relying on a single entry.
However, pyramiding only works well when executed with clear rules on when to add positions, how much to increase by, and where to adjust risk parameters. Without a structured approach, adding to positions can lead to overexposure, especially if the market reverses. Understanding how to manage this risk is essential, which is why different pyramiding methods exist—each with its own risk-reward profile.
Is Pyramiding the Same as a Forex Pyramid Scheme?
No, pyramiding is a legitimate trading strategy, while a forex trading pyramid scheme is a fraudulent investment model. Pyramiding involves adding to winning trades in a structured manner, whereas pyramid schemes rely on recruiting new investors, often with unrealistic return promises and no genuine market activity.
Common Types of the Pyramiding Strategy
Traders use different types of pyramiding strategies depending on their risk tolerance, market conditions, and trading style. The core idea remains the same—adding to a position as the market moves favourably—but the way additional positions are sized can significantly impact potential risk and returns.
Fixed-Percentage Pyramiding
With this approach, traders add a set percentage of their initial position each time they scale in. For example, if the first position is 1 lot, the next might be 50% of it (0.5 lots), and the next 50% of it (0.25 lots). This method reduces sequential risk exposure with each additional entry, preventing the position from growing too aggressively. It is popular in markets where trends can extend for long periods but aren’t always smooth.
Fixed-Size Pyramiding
Here, traders add the same amount to their position at each entry point. If they start with 1 lot, they continue adding 1 lot at each predetermined level. This method increases exposure more quickly than fixed-percentage pyramiding and is commonly used by traders confident in strong, sustained trends. However, it also carries more risk—if the trend reverses, a larger position is at stake.
Scaled Pyramiding
In this strategy, the size of each additional position decreases as the trade progresses. A trader might start with 1 lot, then add 0.75 lots, then 0.5 lots, and so on. The idea is to lock in potential returns while still participating in the trend, limiting risk as the position grows. This approach is useful when traders want to take advantage of strong momentum but remain cautious about overexposure.
Aggressive Pyramiding
Aggressive traders may add increasingly larger positions as the trade moves in their favour. For example, starting with 1 lot, then adding 1.5 lots, then 2 lots. This approach amplifies potential returns quickly but also significantly increases risk. If the market reverses, the largest position is the most vulnerable.
How Pyramiding Works in Practice
Pyramiding isn’t just about adding to a trade—it requires a structured approach. Traders who use this strategy typically follow a clear set of conditions to determine when and how to scale into a position. These conditions revolve around trend identification, entry levels, risk control, and adjustments based on price action.
1. Identifying a Strong Trend
Pyramiding is used in clear trends, where the price moves consistently in one direction without frequent reversals. Traders often use moving averages, trendlines, or higher highs and higher lows to confirm momentum before considering additional positions. A market that chops sideways or lacks volume makes pyramiding riskier, as price movements can be inconsistent.
2. Setting Initial Risk and Position Size
Before adding to a position, traders determine how much of their total risk they’re willing to allocate. Many use a percentage of their account size to calculate exposure, so they don’t take on too much risk too soon. For example, a trader might start with 1% of their capital at risk and adjust as the trade progresses.
3. Choosing Levels to Add Positions
Entries are usually added at logical technical levels, such as:
- Breakouts of key resistance levels (for long positions) or support levels (for short positions).
- Fibonacci retracements, where price temporarily pulls back before continuing in the trend direction.
- Pullbacks to moving averages, such as the 50-day or 200-day moving average.
4. Adjusting Stop Losses and Managing Risk
As new positions are added, traders adjust stop-loss levels to protect against reversals. Some move stops to breakeven once the trade gains momentum, while others trail stops behind higher lows (in an uptrend) or lower highs (in a downtrend).
Example of a Pyramid in Action
A trader enters a forex trade with 1 lot after a breakout. As the price moves 2% higher, they add 0.5 lots at the next resistance break. After another upward movement, they add 0.25 lots. Their stop loss is adjusted upwards each time, reducing risk. If the price reverses, they lock in potential returns rather than losing their initial position.
Challenges of Pyramiding and How to Deal With Them
Using pyramiding as a trading strategy can be an effective way to scale into trades, but it introduces unique risks that require careful management. While adding to a strong trend can potentially boost returns, it also increases exposure, magnifies losses in reversals, and requires disciplined execution.
1. Increased Exposure in Volatile Markets
One of the biggest risks of pyramid trading is overexposure. As a position grows, so does the potential downside. A sharp market reversal can wipe out potential accumulated gains or lead to a larger-than-expected drawdown. This is particularly challenging in high-volatility conditions, where price swings can occur more often.
Traders who use pyramiding are mindful of position sizing. Instead of doubling exposure with each entry, some reduce position sizes incrementally, so that later additions carry less weight. This prevents a single-price move from turning a strong trade into a major loss.
2. Liquidity and Slippage Issues
Adding to a position in low-liquidity conditions can result in slippage, where orders get filled at worse prices than expected. This often happens in after-hours stock trading, near the end of trading sessions, or during high-impact news events when order book depth is thin.
In fast-moving markets, slippage can cause later pyramid entries to execute at increasingly unfavourable levels. This not only raises the average entry price but also increases the risk if the trend fails. Traders focused on managing execution risk often monitor liquidity before scaling in to check if market conditions allow them to place trades efficiently.
3. Overleveraging and Margin Pressure
Leverage amplifies both potential returns and losses. In pyramid trading, each new entry raises margin requirements. If a leveraged position expands too aggressively, a sudden price move against it can trigger margin calls or forced liquidations before the trade has a chance to recover.
Managing leverage effectively means maintaining a controlled risk-per-trade allocation rather than committing too much capital to additional entries. Many traders assess account exposure relative to market conditions and adjust position growth accordingly.
4. False Trends and Market Reversals
Not all breakouts sustain momentum. An asset might briefly break through resistance, triggering pyramiding entries, only to reverse sharply. If a trader misreads the strength of a trend, they could end up adding to a losing position rather than a winning one.
A structured approach to trend confirmation can help avoid premature entries. Instead of reacting to every breakout, traders often rely on higher timeframe trends, price structure, and volume confirmation to assess whether momentum is sustainable.
5. Poor Stop-Loss Placement
One of the most common mistakes is failing to adjust stop losses properly. If stop losses are too tight, the trader might exit too early. If they’re too loose, losses can escalate quickly.
A common adjustment is trailing stop-losses that move in line with price swings, locking in potential returns while allowing for continued trend movement. Some traders move stops to breakeven after the second entry, while others adjust based on key technical levels.
6. Psychological Pressure
Scaling into a position changes the psychological dynamics of trading. A growing trade size can lead to emotional decision-making, such as exiting too soon out of fear of losing accumulated potential returns or overtrading in an attempt to maximise potential gains.
Having a structured plan before entering a pyramiding trade can help mitigate these pressures. Clear predefined entry, stop, and exit strategies ensure that decisions are made based on analysis rather than emotion.
The Bottom Line
Pyramiding allows traders to take advantage of strong trends by gradually increasing position size while managing risk. When used with a structured approach, it can potentially enhance returns. However, overleveraging is very common, and discipline and risk control are essential when using this approach.
FAQ
What Is the Pyramiding Method?
Pyramiding is a trading strategy where traders gradually increase their position size as the market moves in their favour. Instead of entering a full position at once, they add to it at predetermined levels, typically in a trending market. The goal is to take advantage of momentum while helping to manage initial risk exposure.
What Is the Pyramid Scheme Strategy?
A pyramid scheme is a fraudulent business model that relies on recruiting new participants rather than generating actual revenue. It has nothing to do with pyramiding in trading. In pyramid schemes, early participants take advantage of the investments of later recruits, making the model unsustainable. These schemes often collapse when recruitment slows, leaving most participants at a loss.
What Is an Example of Pyramid Trading?
A trader buys 100 shares of a stock at £50. As the price rises to £55, they add 50 more shares. At £60, they add 25 more. Their position grows only when the trend confirms itself, potentially limiting early risk.
How to Do a Pyramid in Stocks?
Traders typically add positions at breakout levels, retracements, or trendline bounces, adjusting stop losses to lock in potential returns while potentially mitigating risk.
This article represents the opinion of the Companies operating under the FXOpen brand only. It is not to be construed as an offer, solicitation, or recommendation with respect to products and services provided by the Companies operating under the FXOpen brand, nor is it to be considered financial advice.
BNC - The Trio Intersection Ahead!The chart is lining up something interesting: a trio intersection of cycle timing, trendline support, and horizontal demand. This is often where momentum shifts from hesitation to acceleration.
📊 Technical Analysis
- NASDAQ:BNC is consolidating above the $20 zone , with $15 still the key line in the sand for bulls.
- Cycles are showing another low forming right into support — a repeating pattern we’ve been tracking closely.
- The trio intersection (cycle + support + trendline) suggests a potential inflection point. If buyers step in here, the projected cycle points to a move toward $50 first , then possibly triple digits in the next leg.
💡 Bigger Picture
What makes this setup powerful isn’t just the chart — it’s the backdrop.
- CEA Industries has already deployed over $240M into BNB, with an ambitious target to own 1% of BNB’s total supply by end of 2025.
- Backed by 10X Capital, YZi Labs, and even CZ’s family office, the company is accumulating BNB ahead of expected ETF and institutional demand.
- Think of it as MicroStrategy 2.0 — but with a coin that’s outpaced Bitcoin over the last five years, and underpins one of the busiest ecosystems in crypto.
📊In brief:
Technicals and fundamentals are aligning at a key junction. If this trio intersection holds, BNC could be gearing up for its next major bullish cycle.
📌 Previous BNC analysis is attached for context.
➡️ Talk to your financial advisor and start your due diligence on CEA Industries (NASDAQ: BNC) before the institutions move in.
📚 Always follow your trading plan => including entry, risk management, and trade execution.
Good luck!
All Strategies Are Good, If Managed Properly.
~ Richard Nasr

IREN Just Won't Quit! Wave 3 Behabviour!IREN Continues its push into price discovery with strong candle spread despite the drop in Bitcoin and range in the S&P. Strong wave 3 herding behaviour!
Price appears to be overextending in wave 5 of (iii) with a target of the R5 daily pivot.
Bearish divergence persists on the overbought RSI.
Safe trading

Google Elliot Wave count adjustedNASDAQ:GOOGL appears to be completing a motif wave 3 with a push into all time high on overbought bearish divergence in the RSI. This would align with 2.618 Fibonacci extension target, a high probability ending point for wave 3.
Wave 4 would be expected to terminate at the nested wave (4) which aligns with triple support - Daily Pivot, High Volume Node and 0.236 Fibonacci retracement. The ascending 200EMA may come to meet price at this point adding confluence.
For now the trend remains up.
Safe trading
Giving away 10%. Is it good or bad for Intel Corp. (Nasdaq:INTC)Recently, the US government took away 10% of NASDAQ:INTC in an effort to lift the company back to its glory. Is this something that the government should do, when we are not in a crisis officially? Let's dig in.
Let us know what you think in the comments below.
Thank you.
75.2% of retail investor accounts lose money when trading CFDs with this provider. You should consider whether you understand how CFDs work and whether you can afford to take the high risk of losing your money. Past performance is not necessarily indicative of future results. The value of investments may fall as well as rise and the investor may not get back the amount initially invested. This content is not intended for nor applicable to residents of the UK. Cryptocurrency CFDs and spread bets are restricted in the UK for all retail clients.

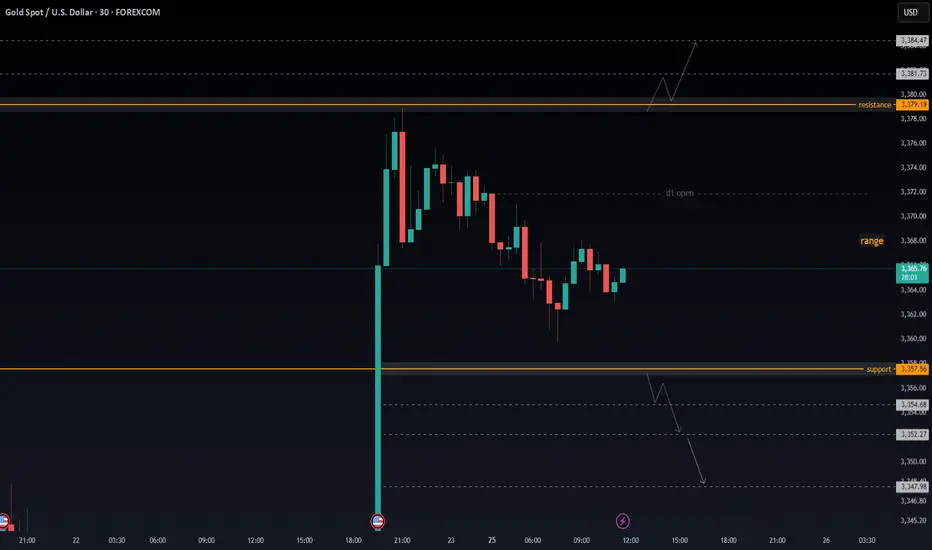
Gold XAUUSD 30M – Intraday Range PlanPrice is holding between $3,379.19 (resistance) and $3,357.56 (support). We are sitting in the middle of the box near $3,363–$3,364, with choppy candles showing hesitation. Scalps are possible, but reversals can be sharp inside this range.
🔼 Bullish Plan (needs confirmation)
Trigger: A clean 30min close above $3,379.19 (not just a wick).
Targets: First into $3,381.73, then $3,384.47. If momentum stays, room opens for $3,390+.
Management: Take partials at the first target, move SL to breakeven once $3,379 is defended.
🔽 Bearish Plan (cleaner below support)
Trigger: A 30min body close below $3,357.56.
Targets: First into $3,354.68, then $3,352.27. If sellers stay aggressive, extension into $3,347.98.
Management: Scale out at first target, protect remaining at breakeven.
🔄 Range Scalp (higher risk, small size)
Shorts: Near $3,379 on a strong rejection → aim for mid-range $3,365–$3,367, SL above rejection high.
Longs: Near $3,357–$3,358 on rejection wick → aim mid-range, SL under lows.
⚠️ Use reduced size – fast whipsaws possible inside this chop.
✅ What Confirms a Break
Strong 30min body close through the level.
Follow through with momentum candles.
❌ What Invalidates
Breakout candle closes back inside range on the next bar → likely trap.
Multiple wick pierces with no follow through.
📌 Bottom Line
Above $3,379.19 → bullish bias toward $3,384.47+.
Below $3,357.56 → bearish bias toward $3,352.27 and $3,347.98.
Inside the box = scalp zone only, manage risk carefully.
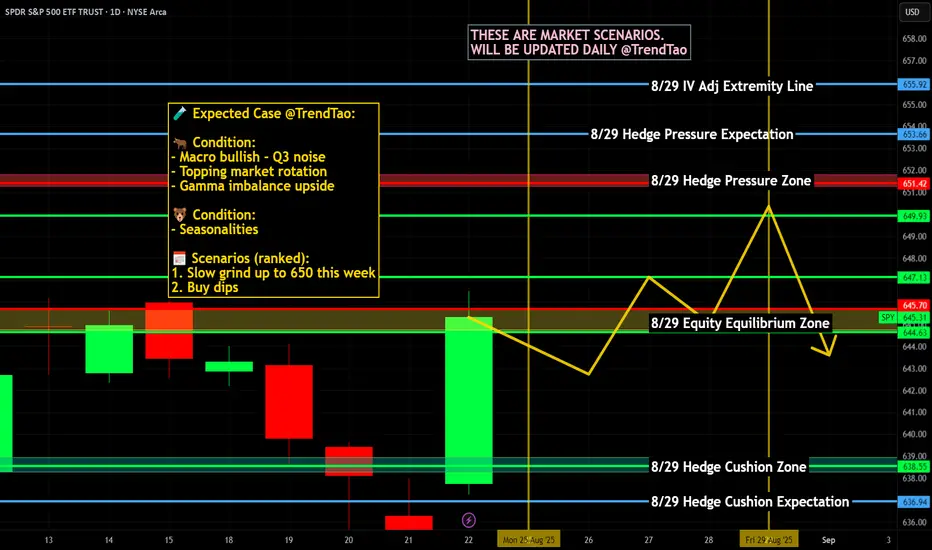
Nightly $SPY / $SPX Scenarios for Tuesday, August 26, 2025🔮 Nightly AMEX:SPY / SP:SPX Scenarios for Tuesday, August 26, 2025 🔮
🌍 Market-Moving Headlines
Post-Jackson Hole digestion 🏔️ → markets recalibrate. Traders continue parsing Powell’s keynote; the path of cuts into September remains the dominant driver for $SPY/$TLT/$DXY.
Durables in focus ✈️📦. Core capital goods orders (non-defense ex-air) are the cleanest read on business investment; softness fuels cut odds, strength = “higher-for-longer.”
Housing affordability squeeze 🏠. Case-Shiller and pending sales provide a 2-sided look at price momentum vs. turnover; AMEX:XHB and AMEX:XLY key tickers.
Consumer mood check 🛒😬. Conference Board Confidence frames labor market sentiment and forward spending intentions.
📊 Key Data Releases & Events (ET)
8:30 AM — Durable Goods Orders (Jul)
Consensus: ~-0.3% headline; core orders expected flat/slightly positive.
Why it matters: Big-ticket spending → business cycle pulse.
9:00 AM — S&P CoreLogic Case-Shiller Home Price Index (Jun)
Prior: +6.0% y/y.
Why it matters: Tracks housing inflation pressure; feeds into consumer wealth effect.
10:00 AM — Conference Board Consumer Confidence (Aug)
Prior: 100.3.
Why it matters: Labor perceptions & spending intentions → AMEX:XLY sentiment.
10:00 AM — Richmond Fed Manufacturing Survey (Aug)
Regional check on factory activity; complements durables.
10:00 AM — Pending Home Sales (Jul)
Prior: -4.1% m/m.
Why it matters: Leading indicator of housing turnover; affordability squeeze.
⚠️ Disclaimer: Educational/informational only — not financial advice.
📌 #trading #stockmarket #SPY #SPX #durablegoods #housing #consumerconfidence #Fed #DXY #TLT

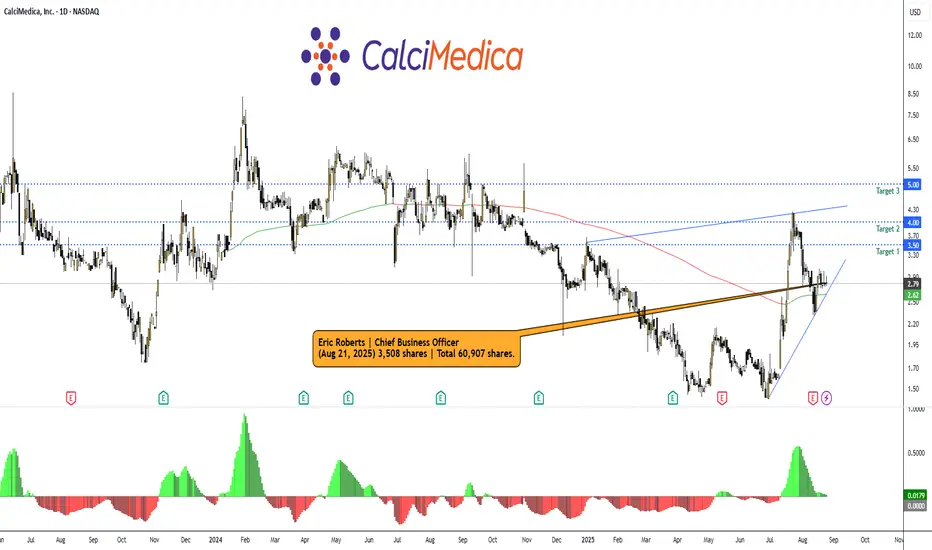
CALC CBO Eric Roberts added 3,508 shares at $2.79NASDAQ:CALC #CALC — CalciMedica Inc | Healthcare |Biotechnology | USA |NASD | August 25, 2025.
Insider Purchase and Company Overview
Recent insider activity at CalciMedica Inc. (NASDAQ: CALC), a clinical-stage biotechnology company focused on developing novel therapies for acute and chronic inflammatory diseases, indicates growing executive confidence.
On August 21, 2025, Eric W. Roberts, the Chief Business Officer, purchased 3,508 shares at an average price of $2.79 per share, for a total value of $9,797. This transaction, disclosed via SEC Form 4 on August 25, 2025, at 09:30 AM EDT, increased his total holdings to 60,907 shares. This buy is part of a broader pattern of insider accumulation, as CalciMedica's Chief Medical Officer, Sudarshan Hebbar, also acquired shares in mid-August 2025 (9,563 shares on August 19 at ~$2.82 and 4,392 shares on August 15 at ~$2.79), signaling potential optimism amid the stock's recent volatility.
www.stocktitan.net
www.investing.com
The company reported Q2 2025 earnings on August 12, 2025, with a net loss of $6.0 million ($0.40 per share), in line with analyst estimates, and a cash position of $18.0 million as of June 30, 2025—sufficient to fund operations into mid-2026.
Key catalysts include ongoing Phase 2 trials (e.g., KOURAGE for acute kidney injury, with data expected in 2025), which could drive upside if positive.
ir.calcimedica.com
www.prnewswire.com
www.stocktitan.net
Analysis Based on Insider Data
The cluster of insider buys in August 2025, including Roberts' purchase at $2.79, aligns with the chart's bottoming signals and post-earnings stability. Insiders often buy during perceived undervaluation, especially in biotech where clinical data can catalyze rapid moves.
With cash runway to mid-2026 and upcoming trial readouts, this activity implies executives see asymmetric upside potential, potentially discounting positive Phase 2 results. The buys occurred near support levels, reinforcing the $2.50-$2.80 zone as a accumulation area.
Charts:
• (1D)
• (1D)
• (3D)
SEC From 4:
www.sec.gov
Forecast:
Replicating Roberts' buy at ~$2.79, the setup offers moderate-to-high reward potential in a biotech rebound play, assuming positive catalysts materialize. Based on the insider confidence, technical bottoming, and upcoming data, I project a 40-80% upside potential over 3-6 months if the reversal holds.
Entry Price: $2.79 (current/insider level).
Recommended Exit Targets:
— Conservative Target 1: $3.50 (25% profit, +$0.71/share) – Near-term resistance; exit on first signs of weakness or post-trial news.
— Moderate Target 2: $4.00 (43% profit, +$1.21/share)
— Aggressive Target 3: $5.00 (79% profit, +$2.21/share) – full exit if RSI hits overbought (>70) or on positive trial data release.
Overall Potential: 40-80% growth.
This forecast is speculative and not financial advice; always conduct due diligence.
ENOV SVP & CLO Tandy Bradley J bought 3,200 shares at $31.41NYSE:ENOV #ENOV - Enovis Corp | Healthcare | Medical Devices | USA | NYSE
The recent insider transaction reveals that Tandy Bradley J, SVP and Chief Legal Officer of Enovis Corporation (ENOV), executed a purchase of 3,200 shares on August 22, 2025, at a cost of $31.41 per share, totaling a value of $100,512.
This move, reported via SEC Form 4 on August 25, 2025, at 06:30 AM EDT, signals strong confidence from a key executive.
SEC From 4:
www.sec.gov
Chart:
• (1D)
• (1W)
Analyzing the weekly chart for ENOV, the purchase appears well-timed. The stock has experienced a significant correction, dropping from its highs, which aligns with a potential accumulation phase.
The current price level near $30.88 offers a compelling entry point, supported by historical support zones.
Given the insider's conviction and the stock's technical setup, a recovery targeting 20-40% upside to the $37-$43 range seems plausible in the coming months, assuming market conditions remain favorable.

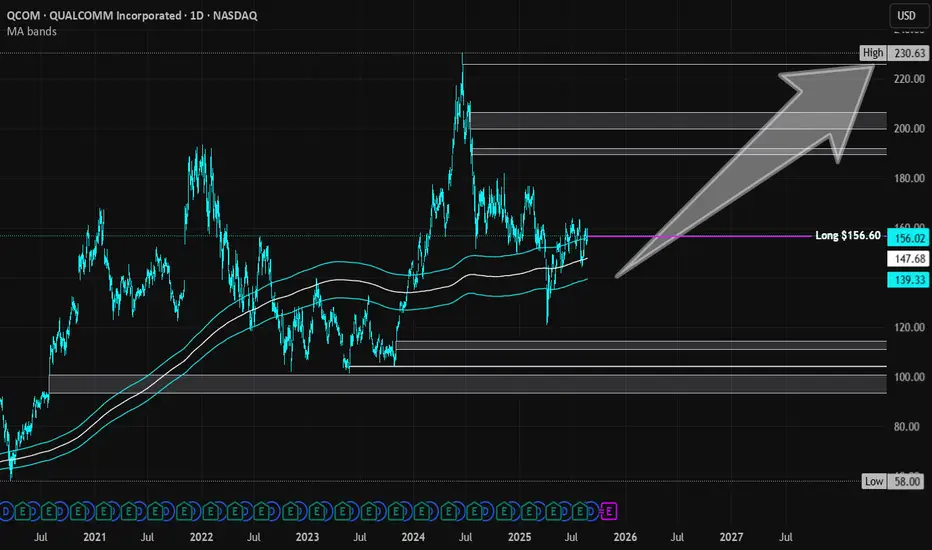
Qualcomm Inc | QCOM | Long at $156.60Qualcomm NASDAQ:QCOM is a global leader in wireless technology, focusing on 5G chipsets, AI-capable Snapdragon processors, and connectivity solutions for smartphones, IoT, and automotive. Revenue through 3 quarters of 2025 is ~$40B. Revenue growth is anticipated to be 10-12%, year over year (2026: ~$45B; 2027: ~$50B; 2028: ~$56B). 5G adoption, AI chip demand, and automotive needs should continue to drive the stock price. Earnings per share are projected to grow 12-14%, year over year (2026: ~$11.20; 2027: ~$12.80; 2028: ~$14.70). Thus, the future looks quite bright for NASDAQ:QCOM .
Regarding price, it is currently trading at a PE of 15x and has a 2.25% dividend. The price is resting just above my historical simple moving average channel. I do anticipate it to drop into the channel (down in the high $130's-$140's) in the near-term due to typical September selloffs. However, I plan on adding more in the zone. A major bear case would be a major drop into the $90's to fill the price gaps on the daily chart before moving higher. I do not think this will happen unless a major catalyst in the market emerges - but always be prepared. Regardless, it is a strong company providing products and services that are in high demand. Currently fairly valued, I believe it become undervalued as the demand for 5G and new phone chips with AI capabilities emerges.
Thus, at $156.60, NASDAQ:QCOM is in a personal buy zone with a likely near-term drop into the $130's and $140's.
Targets into 2028:
$191.00 (+22.0%)
$225.00 (+43.7%)
EURUSD - Bullish outlook heading into next week!Introduction
The EURUSD experienced a strong surge last Friday, largely driven by Jerome Powell’s speech, which added significant momentum to the market. This impulsive move to the upside successfully filled both the bearish 4-hour and 1-hour Fair Value Gaps (FVGs). The candle that formed was notably strong and bullish, and because of its size and strength, it is highly probable that we will see at least a 50% retracement of this candle before price continues to push higher. Such a retracement would allow the market to gather liquidity and prepare for another bullish leg.
Liquidity Sweep
Before this sharp rally, the EURUSD executed a liquidity sweep at the recent lows, clearing out stop losses and inducing sellers into the market. This is a classic move often seen before a strong reversal to the upside. Following this sweep, price accelerated with an aggressive bullish candle. My expectation now is for the market to retrace into this candle, ideally retracing deeply enough to provide a high-probability entry for continuation to the upside. This liquidity sweep sets the stage for a bullish scenario, as it suggests that smart money has already accumulated positions at discounted levels.
Resistance
As price surged higher, it tapped into a key area of resistance, which aligns with both the 1-hour and 4-hour FVGs. This confluence of timeframes strengthens the validity of the resistance zone and explains why price has reacted from this level. I anticipate that breaking through this resistance will require additional momentum, which may not occur immediately. Instead, we could see a short-term pullback or cooldown that allows the market to gather strength before attempting to push through this supply zone. This resistance area will therefore act as a decisive battleground for buyers and sellers.
Bullish Support
The strong bullish candle formed during the rally now serves as a new area of support. I expect price to respect the 50% retracement level of this candle, which lies around 1.166. This midpoint often acts as a significant level in technical analysis, and holding above it would confirm bullish continuation. As long as price remains above this zone, the momentum remains to the upside, and the probability of another move higher increases. This makes the retracement into this level a potential buying opportunity.
Inversion
Another important factor to consider is the inversion of the 4-hour FVG. On the previous drop, the EURUSD created a bearish 4-hour FVG, which initially acted as resistance. However, with the latest bullish impulse, this same zone has now flipped into an inversion FVG, transforming from a bearish area into a bullish support. This inversion highlights a significant shift in market structure and suggests that bulls are taking control of the price action. This level will be crucial to watch, as holding above it strengthens the case for further upside.
Final Thoughts
In summary, the EURUSD is showing strong bullish potential following the liquidity sweep and the aggressive rally sparked by Powell’s speech. While the market has reached a significant resistance area marked by the 1-hour and 4-hour FVGs, a retracement into the 50% level of the bullish candle would be healthy and provide a potential entry point for buyers. With the inversion of the previous bearish FVG into bullish support, the technical picture favors the upside as long as key support levels are respected. The coming sessions will reveal whether the market has the strength to break through resistance and continue its upward trajectory.

Protagonist Therapeutics (PTGX) AnalysisCompany Overview:
Protagonist Therapeutics NASDAQ:PTGX is a clinical-stage biotech developing peptide-based drugs in hematology, inflammatory, and metabolic diseases. Its pipeline spans polycythemia vera, psoriasis, and obesity — addressing multi-billion-dollar markets.
Pipeline & Catalysts:
Rusfertide (Polycythemia Vera) 🩸
Phase 3 VERIFY trial met all primary and secondary endpoints.
Showed reduced phlebotomy needs and improved hematocrit control.
Positions rusfertide as a first-in-class treatment and regulatory catalyst.
Icotrokinra (Psoriasis) 🌐
NDA filed for IL-23 receptor antagonist.
Approval could unlock a major dermatology revenue stream.
PN-477 (Obesity) ⚡
Expands PTGX’s reach into the fast-growing obesity market.
Strategic Advantage:
Global Takeda partnership enhances execution power.
Recent $25M milestone payment post-Phase 3 validates science & provides financial support.
Investment Outlook:
Bullish Case: Above $46–$48, driven by strong clinical data & regulatory progress.
Upside Potential: Target $78–$80, supported by trial success, NDA filings, and Takeda backing.
📢 PTGX—A high-upside biotech story with catalysts across hematology, dermatology, and obesity.
#PTGX #Biotech #ClinicalTrials #Obesity #Psoriasis #Takeda #GrowthStocks

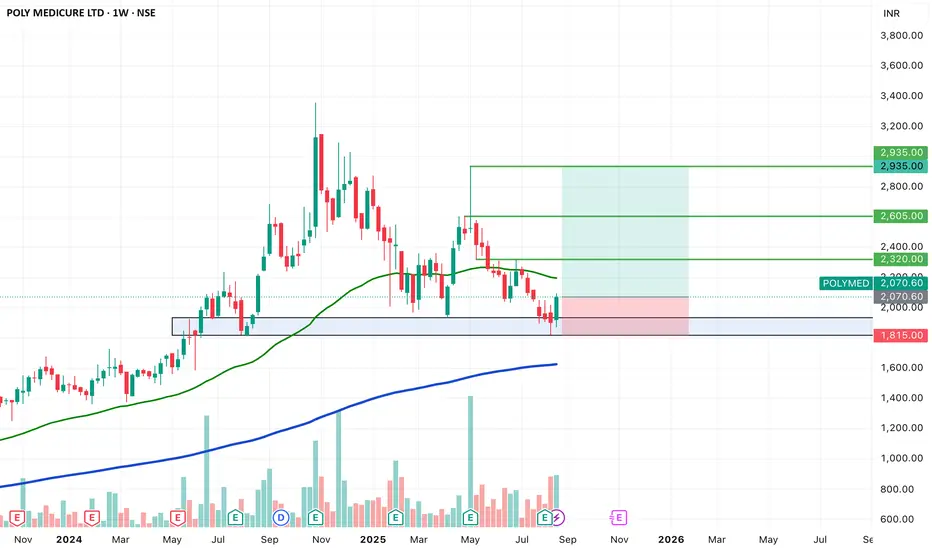
SWING IDEA - POLY MEDICUREPoly Medicure , a leading Indian medical devices manufacturer with a strong global footprint, is currently offering a favorable swing trading setup backed by strong technical confluence.
Reasons are listed below :
1,950 zone acting as a strong support base
Bullish engulfing candle on the weekly timeframe, signaling reversal strength
Marubozu candle on the daily chart, supported by strong volumes
Golden Fibonacci retracement zone providing support in the larger trend
Price comfortably above the 200 EMA, showing long-term trend strength
Target - 2320 // 2605 // 2935
Stoploss - weekly close below 1815
DISCLAIMER -
Decisions to buy, sell, hold or trade in securities, commodities and other investments involve risk and are best made based on the advice of qualified financial professionals. Any trading in securities or other investments involves a risk of substantial losses. The practice of "Day Trading" involves particularly high risks and can cause you to lose substantial sums of money. Before undertaking any trading program, you should consult a qualified financial professional. Please consider carefully whether such trading is suitable for you in light of your financial condition and ability to bear financial risks. Under no circumstances shall we be liable for any loss or damage you or anyone else incurs as a result of any trading or investment activity that you or anyone else engages in based on any information or material you receive through TradingView or our services.
@visionary.growth.insights
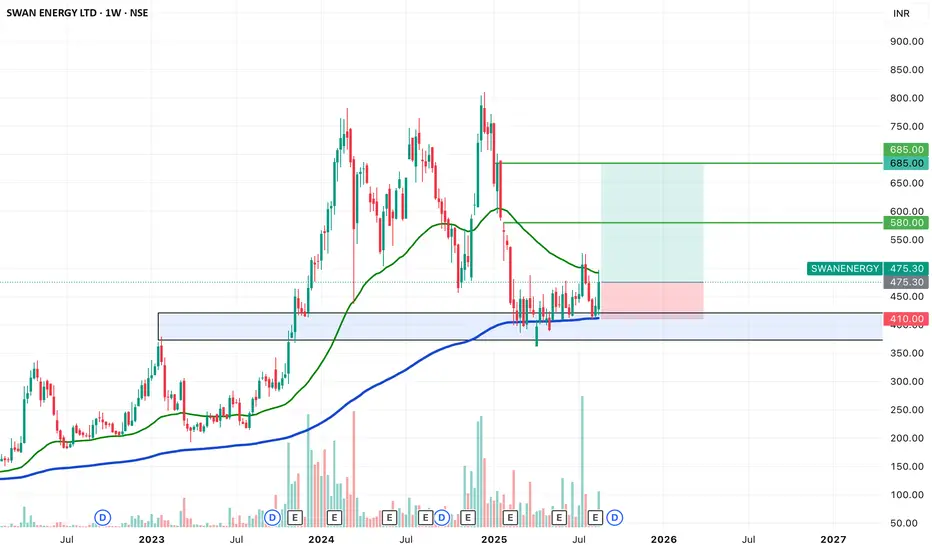
SWING IDEA - SWAN ENERGYSwan Energy , a diversified company with interests across textiles, energy, and real estate, is showcasing a strong swing trade opportunity backed by reliable technical signals.
Reasons are listed below :
The 450 zone has acted as a strong support, and price is now attempting a breakout from a 6-month Darvas box consolidation.
A strong bullish engulfing candle on the weekly timeframe signals renewed buying interest.
The 200 EMA on the weekly chart is acting as a solid support.
The stock is also bouncing from the golden 0.618 Fibonacci retracement zone.
Target - 580 // 685
Stoploss - weekly close below 410
DISCLAIMER -
Decisions to buy, sell, hold or trade in securities, commodities and other investments involve risk and are best made based on the advice of qualified financial professionals. Any trading in securities or other investments involves a risk of substantial losses. The practice of "Day Trading" involves particularly high risks and can cause you to lose substantial sums of money. Before undertaking any trading program, you should consult a qualified financial professional. Please consider carefully whether such trading is suitable for you in light of your financial condition and ability to bear financial risks. Under no circumstances shall we be liable for any loss or damage you or anyone else incurs as a result of any trading or investment activity that you or anyone else engages in based on any information or material you receive through TradingView or our services.
@visionary.growth.insights
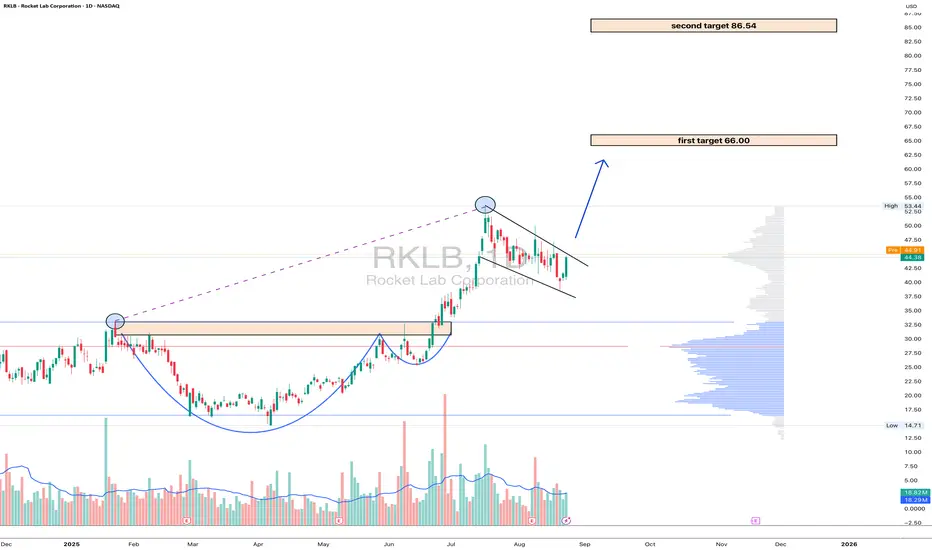
RKLB: the rocket is fueled and ready for orbitOn the daily chart of Rocket Lab (RKLB) , the price is trading at $44.38 after a confident breakout above key consolidation zones. Technically , the break of the $40 level confirmed the strength of the bulls and solidified the upward structure. The next target is $66 - a strong resistance aligned with the Fibo extension and if momentum holds, the market could extend toward $86.54, where long-term levels converge. EMA indicators remain below the price, reinforcing the bullish outlook.
Fundamentally , Rocket Lab stands as a leader in the small-launch vehicle sector, strengthened by contracts with NASA and consistent commercial demand. Amid growing interest in the aerospace industry and rising competition with SpaceX, the company benefits from diversified revenue streams and steady launch schedules. On the geopolitical side, increased defense programs in the U.S. and allied nations provide additional long-term support.
Tactically , the zone above $40 now acts as a support: as long as price holds above it, the bullish scenario remains intact. Targets are set at $66 and $86.54. Short-term corrections are possible if the market overheats, but the broader structure points upward, with institutional flows suggesting accumulation.
If this scenario plays out, Rocket Lab won’t just launch satellites - it’ll launch portfolios into orbit.
NAS100 - Where will the stock market ?!The index is above the EMA200 and EMA50 on the four-hour timeframe and has re-entered its ascending channel. If this channel is maintained, its upward path to the specified price target will be possible, but before that, the downward trend line must be broken in a valid way. If the channel is lost, the index's downward path will continue to around 23,000 points.
Federal Reserve Chair Jerome Powell’s latest remarks, delivered in a dovish tone, boosted bullish sentiment in financial markets and sparked a new wave of optimism among Wall Street investors and market participants. Following Powell’s speech, U.S. stock benchmarks surged sharply, with capital flows notably directed into the Russell 2000 index of small-cap companies, which jumped 3.86%—its strongest gain since April 9.
During his keynote at the Federal Reserve’s annual symposium, Powell implicitly suggested that an interest rate cut could come as soon as next month. At the same time, he warned of rising inflation risks and signs of slower economic growth, stressing that although risks are relatively balanced, the current environment may require an adjustment in monetary policy. He stated: “Given that monetary policy remains in a restrictive stance, the baseline outlook and the shifting balance of risks may warrant a reassessment of our policy stance.”
Naeem Aslam, chief investment strategist at Zaye Capital Markets, described Powell’s comments as a turning point for markets, saying: “Powell’s dovish tone came as a real surprise to many market participants who did not expect such an approach from the Fed Chair. His remarks were clearly interpreted as a dovish signal.”
Following Powell’s comments, traders raised their expectations for a September rate cut. Barclays revised its forecast and now expects the Federal Reserve to deliver two 25-basis-point cuts this year—in September and December.
Meanwhile, Fitch Ratings affirmed the U.S. sovereign credit rating at AA+ with a stable outlook, a decision made despite significant political uncertainty. According to Fitch, rising trade tariffs, government spending cuts, stricter border controls, and increased deportations have heightened policy uncertainty, weighing on household consumption and business investment.
Fitch projects that the U.S. economy will remain in recession in 2026, growing only 1.5%, as elevated inflation and policy uncertainty continue to dampen consumer spending. However, the agency expects that faster rate cuts that year could boost domestic demand, helping growth rebound to 2.1% in 2027.
This week, two key reports are in focus: the second estimate of Q2 GDP and July’s Personal Consumption Expenditures (PCE) Price Index. The initial GDP estimate showed a 3% expansion, and consensus forecasts anticipate confirmation of this figure. In contrast, the Atlanta Fed’s GDPNow model projects a 2.3% growth rate, which, while lower, still points to economic resilience and suggests no urgent need for accelerated rate cuts—even as political pressure from the White House on Powell continues. Notably, GDPNow will be revised on Tuesday ahead of the official release.
Inflation data, however, carry greater weight. The core PCE index, the Fed’s preferred inflation gauge, has closely tracked core CPI for the past decade. With July’s core CPI climbing from 2.9% to 3.1%, there is a risk that PCE will follow the same path. Such a scenario would signal persistent inflationary pressures and significantly reduce the likelihood of a second rate cut this year.
If these data confirm stronger inflation, the U.S. dollar will likely strengthen further, while equities could come under additional pressure. A slower pace of monetary easing diminishes the present value of future cash flows for growth-oriented companies, explaining why Wall Street’s corrective phase may persist.
On the corporate front, Nvidia’s CEO said that the ability to ship its H20 chip to China is highly valuable and poses no national security concerns. He added that the decision to supply a next-generation AI data center chip to China, which will succeed the H20, is not within Nvidia’s direct control. The company is set to report earnings on Wednesday and remains in discussions with the U.S. government, though no resolution has yet been reached. The CEO also mentioned that his brief visit to Taiwan would mainly involve a dinner with TSMC executives. He revealed TSMC’s new “Rubin” architecture, comprising six new chips, and announced that Nvidia will hold its GTC conference in Washington, D.C. for the first time.
Separately, Meta has halted AI hiring after onboarding more than 50 specialists with lucrative compensation packages. The freeze affects both new hires and internal transfers, unless personally approved by Alexander Wang, head of AI. In recent months, Meta has reorganized its AI division into four separate teams to advance its “superintelligence” projects. Analysts have warned about rising costs and equity grants, framing the hiring pause as part of broader budget control and organizational restructuring efforts.

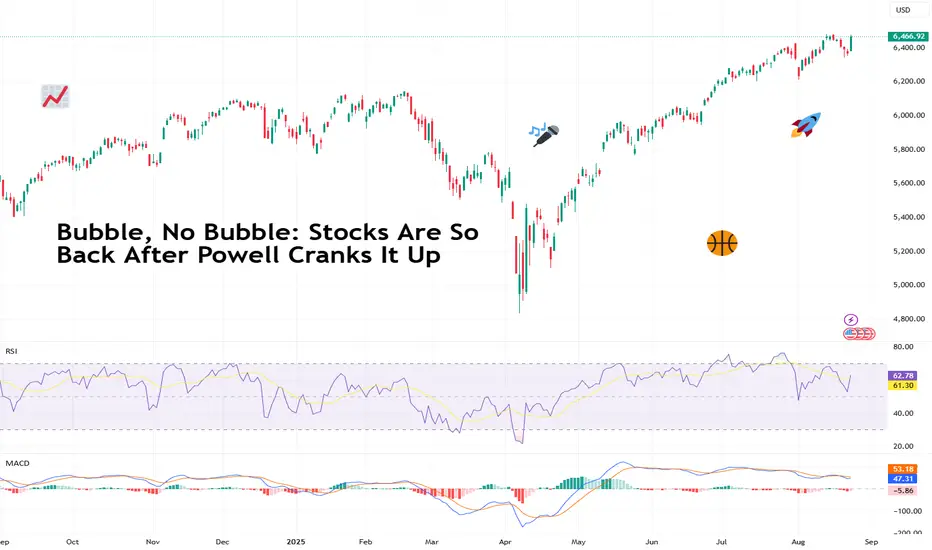
Bubble, No Bubble: Stocks Are So Back After Powell Cranks It UpStretched valuations, talks of froth, and overall market fatigue. That’s what investors were saying for stocks (especially those AI plays) up until Powell brought up the vibe that rekindled the animal spirits. Let’s talk about that.
📈 Powell Drops the Mic
Markets started last week exhausted. The S&P 500 SP:SPX was wobbling, the Nasdaq NASDAQ:IXIC was shedding like your beautiful ragdoll cat, and traders were probably looking up vacation getaways instead of technical patterns.
But then on Friday we all came together to hear one man speak . It was the same neutral, laid back tone, but this one time something was different. As if… a bolder man was on the stage, unafraid to crank it up. Or was it more of an elderly man finally giving the kids what they wanted?
In his speech at Jackson Hole, Fed boss Jay Powell acknowledged what markets had been hoping to hear: “The risk of rising prices has diminished.” Translation? The Fed finally sees inflation cooling down. And the labor market might need some help, too.
That was all it took. Risk appetite flipped, sending equities way higher into Friday’s close (even though Monday's futures dipped a bit ).
The S&P 500 SP:SPX booked a solid 1.5% pop, the Dow Jones TVC:DJI surged 1.9% to a fresh all-time high, and the Nasdaq NASDAQ:IXIC managed to erase much of its weekly losses after a strong 2% increase. Powell didn’t cut rates yet — he just gave markets a few reasons to believe cuts are coming.
🚧 The Job Market Pivot
Before Powell spoke, traders were bracing for maybe one rate cut this year, if any. Sticky inflation had the Fed cornered. But Powell flipped the narrative, shifting attention to the labor market instead.
The US unemployment rate has climbed nearly a full percentage point over the past year, and job growth is slowing fast, averaging just 35,000 new positions per month over the past three months. Even worse, revisions stripped 258,000 jobs from May and June’s data.
For traders, this was the lightbulb moment: a weakening labor market gives Powell the green light to pivot.
🔥 Inflation Still Isn’t Dead
Here’s the awkward part: while Powell’s tone eased market fears, the inflation problem hasn’t magically vanished. Core CPI is still running 3% year-over-year, well above the Fed’s 2% target, even as the headline CPI ECONOMICS:USCPI stood at 2.7% for July .
Meanwhile, wholesale prices ECONOMICS:USPPI — often a precursor to consumer price trends — surged 0.9% last month , marking their fastest monthly jump in three years.
Powell is walking a tightrope: move too quickly on cuts, and inflation could flare up again; wait too long, and the job market weakens further. The stakes are high, and the balance fragile.
🎈 Bubble Talk, Again
Every time stocks rip higher, the “bubble” debate resurfaces. And honestly? It’s hard to ignore it this time. AI stocks are priced like they’ve already rewired how the world works, and the Nasdaq’s relentless rally looks almost too clean.
But here’s a reality check. We’ve never had a big market crisis for the past 16 years. March 2020? Recovered in a few months. April’s mini-crash? Erased in weeks.
Markets seem determined to brush off every scare and buy the dip. Powell’s pivot only reinforced that attitude: traders don’t care about stretched valuations if the Fed is hinting at cheaper money ahead.
🤖 Nvidia’s Market, Nvidia’s Rules
That’s how we move forward to what’s next. Nvidia NASDAQ:NVDA drops earnings on August 27 ( Earnings Calendar for reference). And because this is Nvidia’s market and we all live in it, expectations are sky-high.
Analysts are projecting just under $46 billion in revenue and $1 per share in earnings . But the real focus? Forward guidance.
If Nvidia signals a blockbuster Q3 — something in the ballpark of $54 billion in sales — it could keep fueling the AI mania and push the Nasdaq and the S&P 500 to fresh highs. But if the numbers disappoint, this entire rally could wobble.
Considering Nvidia has added more than $3 trillion in market cap since 2023, it’s no exaggeration to say the stock’s earnings could set the tone for everything else.
🦁 Animal Spirits Are Back
Powell’s softer tone and the Nvidia hype machine have combined to reawaken animal spirits across Wall Street. That makes for a good example on how you can shift from doom-posting about stagflation to refreshing the ATH charts in less than 48 hours.
The S&P and the Dow are at or near record highs, the Nasdaq is eyeing another breakout. What’s not to like? The rally isn’t bulletproof.
It’s being driven as much by vibes as fundamentals right now. Rate cuts haven’t happened yet, the labor market is fragile, and inflation hasn’t fully cooled. The market appears to be trading on optimism — and optimism can turn fast.
🏁 The Bottom Line
Jerome Powell didn’t announce a rate cut, but he did something almost better: he opened the door a bit wider. By acknowledging softer labor data and reduced inflation risks, he revived traders’ appetite and gave permission to believe the rally has legs.
But this story has two big hinges: Nvidia has to deliver, and inflation has to behave. One earnings miss or a hot CPI print, and this animal spirit revival could fade as quickly as it started.
Off to you : Are you long and excited about the outlook? Or you’re in the bear camp and looking for your chance to short this market? Share your views in the comments!
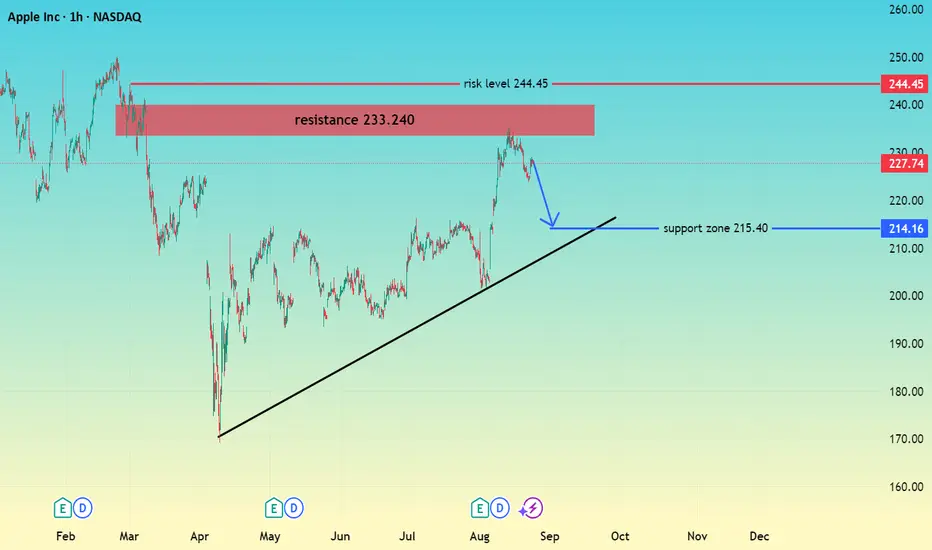
AAPL RESISTANCE 233VS SUPPORT 215 hi trader's
Apple price is testing a major resistance zone around 233 – 240.
If sellers hold this resistance, a retracement toward the 215.40 support zone and trendline is possible.
A sustained break above the 244.45 risk level would invalidate this bearish view and may open the way for higher prices
Resistance Zone: 233 – 240
Support Zone: 215.40
Risk Level ( 244.45
don't forget to like comment and follow
Weekly $SPY / $SPX Scenarios for August 25 – 29, 2025🔮 Weekly AMEX:SPY / SP:SPX Scenarios for August 25 – 29, 2025 🔮
🌍 Market-Moving Themes
Jackson Hole aftermath 🏔️
Powell’s Friday keynote sets the tone. Markets will trade on whether he opened the door to a September cut or stuck to a cautious stance. Expect chop in AMEX:SPY , NASDAQ:TLT , TVC:DXY as traders recalibrate.
Inflation & Jobs 🔥💼
Fresh PCE inflation and jobless claims anchor the week. Any upside surprise revives “higher-for-longer”; softness = fuel for cut odds.
Retail earnings wrap 🛒
With $WMT/$TGT/ NYSE:HD behind us, discounters and specialty retailers close the season. AMEX:XRT stays a barometer of consumer resilience.
Housing & confidence 🏠📉
Pending Home Sales + Conference Board Confidence will test sentiment in an affordability squeeze backdrop. Watch AMEX:XHB , $XLY.
📊 Key Data & Events (ET)
📅 Monday, Aug 25
Chicago Fed National Activity Index (8:30 AM) – broad growth pulse.
Dallas Fed Manufacturing Survey (10:30 AM) – regional check.
📅 Tuesday, Aug 26
Durable Goods Orders (8:30 AM) – capex signal; core ex-transport key.
Richmond Fed Manufacturing Survey (10:00 AM) – factory health in Mid-Atlantic.
S&P CoreLogic Case-Shiller Home Price Index (9:00 AM) – housing momentum.
Conference Board Consumer Confidence (10:00 AM) – labor intentions, rate sentiment.
📅 Wednesday, Aug 27
MBA Mortgage Applications (7:00 AM) – weekly mortgage pulse.
Advance Economic Indicators (8:30 AM) – trade, inventories, wholesale.
Pending Home Sales (10:00 AM) – affordability and turnover test.
Crude Oil Inventories (10:30 AM) – $CL_F/ AMEX:XLE driver.
📅 Thursday, Aug 28
Initial Jobless Claims (8:30 AM) – labor cooling watch.
GDP (2nd Estimate, Q2) (8:30 AM) – growth momentum, revisions matter.
Kansas City Fed Manufacturing Index (11:00 AM) – regional survey.
📅 Friday, Aug 29
PCE Price Index (Jul, 8:30 AM) – Fed’s preferred inflation gauge.
Personal Income & Outlays (8:30 AM) – consumer demand and savings rates.
Chicago PMI (9:45 AM) – manufacturing signal ahead of ISM next week.
UMich Consumer Sentiment (Final, 10:00 AM) – inflation expectations track.
⚠️ Disclaimer: Educational/informational only — not financial advice.
📌 #trading #stockmarket #economy #SPY #SPX #Fed #PCE #GDP #Housing #Confidence #Energy #Bonds #Dollar
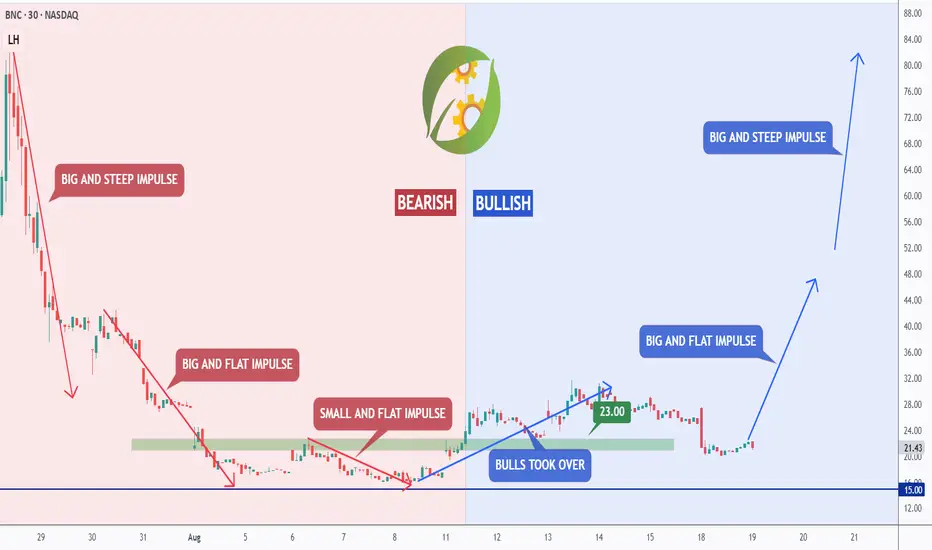
BNC - Shift in Momentum in Action!In our last update, we pointed out how BNC was holding its ground at the $12–$15 support zone. Now, we’re seeing that shift in momentum play out in real time; with the bears losing steam and the bulls taking over.
📊 Technical Update
The chart shows it clearly:
- In the bearish phase, every downward impulse got weaker — from big and steep to small and flat. Selling pressure was fading.
- Bulls stepped in at the $15 demand zone, flipping the structure bullish.
- Since then, we’ve seen a big and flat bullish impulse , hinting at healthy accumulation before the next leg.
🔎If momentum holds:
- First target: $50 => a structural resistance and psychological barrier.
- Second target: $82 => the top of the projected markup, filling a major price gap.
As long as $23 holds, and especially $15, the bullish case remains strong.
💡 Bigger Picture
This isn’t just a chart story — it’s backed by fundamentals. BNC is the first U.S.-listed company making BNB its core treasury asset , giving investors rare one-click exposure to a coin most can’t buy directly.
With over $500M already in BNB and a clear first-mover advantage, the mix of a strong macro narrative and a clear bullish shift makes this a setup worth watching closely.
📌 Previous BNC analysis is attached for context.
➡️ As always, speak with your financial advisor and do your own research before making any investment decisions.
📚 Always follow your trading plan => including entry, risk management, and trade execution.
Good luck!
All Strategies Are Good, If Managed Properly.
~ Richard Nasr
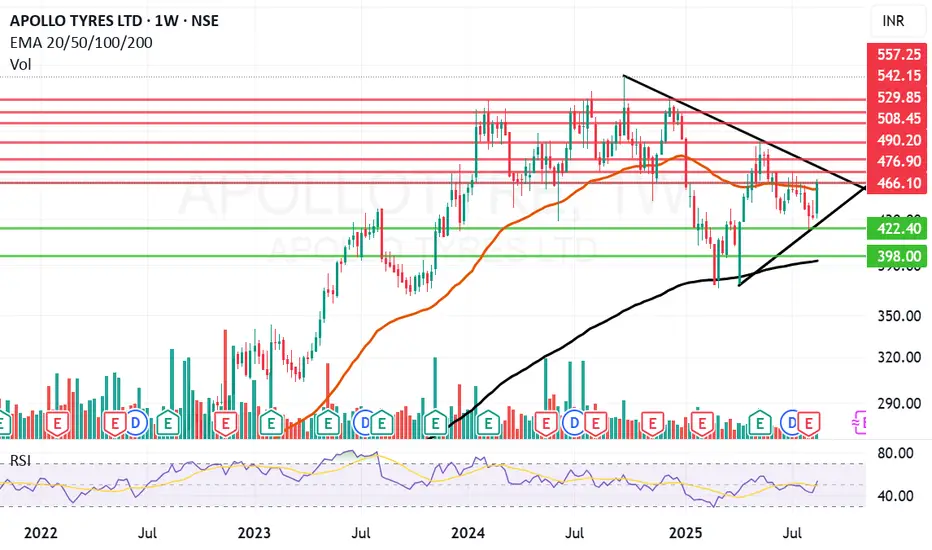
Apollo Tyres can give a joyous ride Apollo Tyres Ltd. engages in the production and trading of automotive tyres, tubes and flaps. It operates through the following geographical segments: Asia, Pacific, Middle East, Africa (APMEA); Europe, and Others.
Apollo Tyres Ltd. Closing price is 465.75. Dividend Yield @CMP 1.08% The positive aspects of the company are Companies with Low Debt, RSI indicating price strength, MFs increased their shareholding last quarter. The Negative aspects of the company are high Valuation (P.E. = 35.5), High promoter stock pledges and Promoter decreasing their shareholding.
Entry can be taken after closing above 467 Historical Resistance in the stock will be 476, 490 and 508. PEAK Historic Resistance in the stock will be 529 and 542. Stop loss in the stock should be maintained at Closing below 422 or 398 depending upon your risk taking ability.
Disclaimer: The above information is provided for educational purpose, analysis and paper trading only. Please don't treat this as a buy or sell recommendation for the stock or index. The Techno-Funda analysis is based on data that is more than 3 months old. Supports and Resistances are determined by historic past peaks and Valley in the chart. Many other indicators and patterns like EMA, RSI, MACD, Volumes, Fibonacci, parallel channel etc. use historic data which is 3 months or older cyclical points. There is no guarantee they will work in future as markets are highly volatile and swings in prices are also due to macro and micro factors based on actions taken by the company as well as region and global events. Equity investment is subject to risks. I or my clients or family members might have positions in the stocks that we mention in our educational posts. We will not be responsible for any Profit or loss that may occur due to any financial decision taken based on any data provided in this message. Do consult your investment advisor before taking any financial decisions. Stop losses should be an important part of any investment in equity.