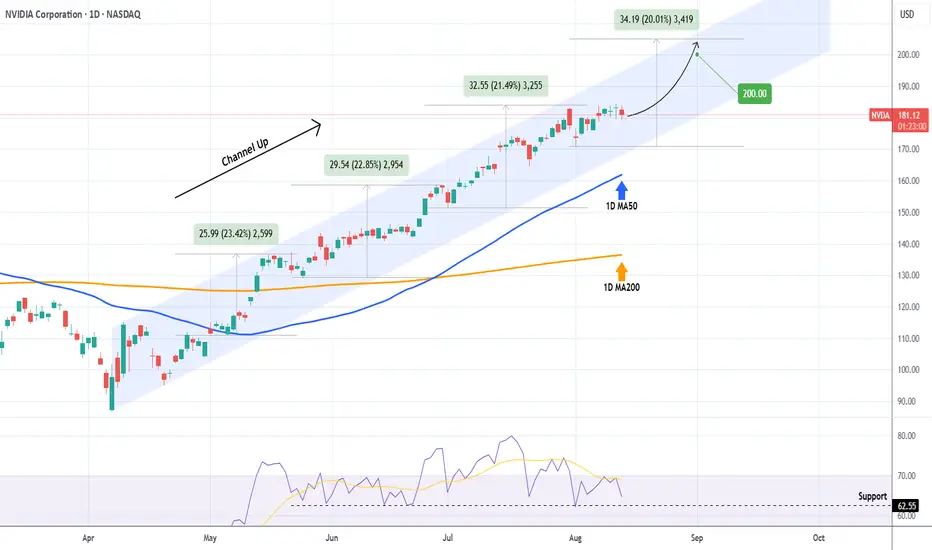
NVIDIA Is the path to $200 that easy?NVIDIA Corporation (NVDA) has been trading within a Channel Up since the April 07 market Low, being so aggressive that it has turned its 1D MA50 (blue trend-line) into Support since May 01.
The last 3 main Bullish Legs all rose by at least +20%. As long as the 1D RSI Support holds, we expect another such Leg, which would be enough for NVIDIA to reach the all important $200 psychological Target.
-------------------------------------------------------------------------------
** Please LIKE 👍, FOLLOW ✅, SHARE 🙌 and COMMENT ✍ if you enjoy this idea! Also share your ideas and charts in the comments section below! This is best way to keep it relevant, support us, keep the content here free and allow the idea to reach as many people as possible. **
-------------------------------------------------------------------------------
💸💸💸💸💸💸
👇 👇 👇 👇 👇 👇
Stocks!
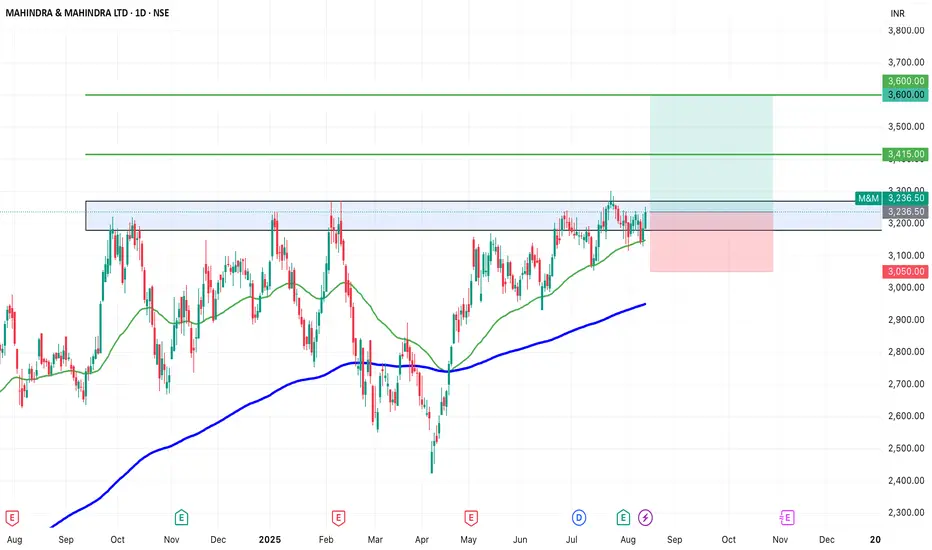
SWING IDEA - M&MM&M , a leading Indian automotive and farm equipment manufacturer, is showing signs of a potential breakout, making it a strong swing trading candidate.
Reasons are listed below :
3,200 resistance tested multiple times — now weakened and primed for a breakout
VCP (Volatility Contraction Pattern) forming, indicating accumulation
Trading above 50 & 200 EMA, confirming long-term trend strength
Inverse Head & Shoulders pattern forming, a bullish reversal setup
Target : 3415 // 3600
Stoploss : daily close below 3050
DISCLAIMER -
Decisions to buy, sell, hold or trade in securities, commodities and other investments involve risk and are best made based on the advice of qualified financial professionals. Any trading in securities or other investments involves a risk of substantial losses. The practice of "Day Trading" involves particularly high risks and can cause you to lose substantial sums of money. Before undertaking any trading program, you should consult a qualified financial professional. Please consider carefully whether such trading is suitable for you in light of your financial condition and ability to bear financial risks. Under no circumstances shall we be liable for any loss or damage you or anyone else incurs as a result of any trading or investment activity that you or anyone else engages in based on any information or material you receive through TradingView or our services.
@visionary.growth.insights
Vimeo | VMEO | Long at $3.87Vimeo NASDAQ:VMEO provides a cloud-based platform for video creation, hosting, and sharing - primarily serving businesses, creators, and enterprises for professional video content management. While NASDAQ:VMEO has a **lot** of competition, it is a rather "healthy" company:
Debt-free (a rarity out there...)
Maintained profitability over the last twelve months, with a healthy gross profit margin of 78%
Earnings are forecast to grow 34.76% per year
[*}Revenue growth rate through 2027 is projected at 5.36% (modest)
Adjusted EBITDA guidance raised to $35 million, up from $25-30 million
Upcoming product developments, including AI-powered features and new SKUs, are expected to drive further growth
Insider bought over $868,000 in shares in the last year at an average price of $5.04
Subscriber growth is a concern...
From a technical analysis perspective, the stock price is currently near the bottom of my historical simple moving average bands. This region is typically an area of consolidation. The two open price gaps below the current price on the daily chart (down to $3.38) will likely get closed in the near-term before a move up. I do believe this is a risky investment, though, given the competition and economic headwinds. I would not be surprised if the market flipped and took this down near or below $1... But, if one is going purely by what the company reports concerning fundamentals and general growth, this is an undervalued stock in the $3 range.
Thus, if the insider/company hype is true, NASDAQ:VMEO is in a personal buy zone at $3.87 - with near-term risk of the stock dropping to close the price gaps on the daily chart down to $3.38... or below.
Targets into 2028:
$5.00 (+29.2%)
$6.40 (+65.4%)

AIRLINKAIRLINK – Daily Chart: Descending Channel Breakout Setup 📉➡📈
Technical Picture
Price has been respecting a downward-sloping channel for several weeks
The lower highs and lower lows defined the downtrend until recently. breaking out!
Now,
Breakout confirmation: 🚀
Upper Cap done!
Volume expansion on breakout day
Buy on retracement or use buy stop order 140 150 or buy agressively from CRP (current market price)
Retest buy zone: PKR 138–140 after breakout 🛡
Short-term target: PKR167 🎯
Medium-term target: PKR 180 and 186 if momentum holds ⛰
Medium-term target: PKR 200 and 228 if momentum holds ⛰
Fundamentals Still Solid & Confirmed
Xiaomi Smart TVs: Local assembly started Jan 2025 via subsidiary Select Technologies.
Earnings: FY24 Revenue +162%, PAT +242%, EPS Rs 7.74, Dividend Rs 6.
Product Range: Samsung, Xiaomi, Apple, Tecno, Acer, wearables — keeps diversification strong.

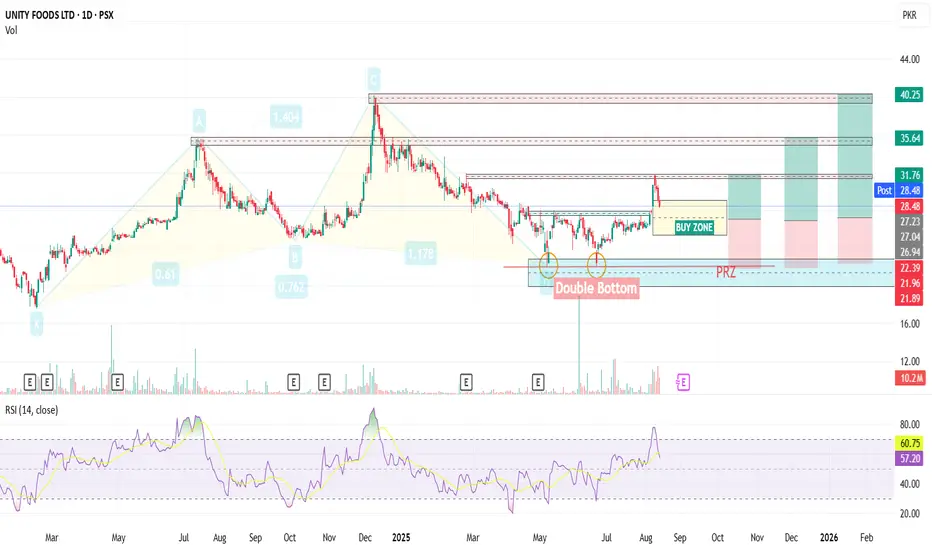
Unity📈 UNITY PSX — Bullish Cypher + Double Bottom + Pullback Buy Zone 💎
🌀 Pattern:
X: 17.60 → A: 35.61 → B: 25.01 → C: 40.14 → D: 22.02
✅ Perfect Bullish Cypher completion at D
📊 Double bottom at D → neckline breakout
📍 Current Setup:
Hit 32.00 🎯 — now retracing to 28.00 🛡 (Fib breakout retest)
This zone is a buy-on-dip 28.50 to 25
🎯 Targets:
TP1: 32 🔁 (recent high)
TP2: 35 🚀 (A-point retest)
TP3: 39--40🌙 (C-point retest — extended move)
🛑 Stop-loss: Below Double Bottom
💼 Fundamentals — Power Boost:
1️⃣ Net Profit Rs 1.09 bn vs. Rs 1.21 bn loss last year 📈
2️⃣ EPS +0.92 vs. –1.01 previously 💰
3️⃣ Gross Profit +10.5% to Rs 7.41 bn (cost of sales down 12.6%) 🏭
4️⃣ Operating Profit +36% to Rs 6.80 bn; Other Income +202% to Rs 2.13 bn 💵
5️⃣ Dividend 75% cash declared 🏦
⚡ Summary:
Technicals + Fundamentals = High-confidence setup 📊
Nightly $SPY / $SPX Scenarios for August 13, 2025🔮 Nightly AMEX:SPY / SP:SPX Scenarios for August 13, 2025 🔮
🌍 Market-Moving News 🌍
📉 CPI cooldown keeps cut odds alive — July CPI came in +0.2% m/m, +2.7% y/y; Core +0.3% m/m, +3.1% y/y, reinforcing a “disinflation but not done” vibe. Watch $SPY/ SP:SPX vs. TVC:DXY and NASDAQ:TLT as markets handicap a September cut.
🛢️ EIA sees crude sliding sub-$60 — The EIA’s August outlook projects Brent <$60 in Q4 ‘25 as supply growth outpaces demand; energy equities ( AMEX:XLE ) and $USO/$CL_F stay sensitive to this path.
🏦 Fed-speak cluster today — Three regional Feds on deck (Barkin, Bostic, Goolsbee). Any shift in tone on tariffs vs. labor softness can move the front end and equities.
📊 Key Data Releases & Events (ET) 📊
📅 Wed, Aug 13
• 7:00 AM — MBA Mortgage Applications (weekly).
• 8:00 AM — Richmond Fed’s Tom Barkin speaks (Greenville Chamber).
• 10:30 AM — EIA Weekly Petroleum Status Report (inventories, products).
• 1:00 PM — Chicago Fed’s Austan Goolsbee Q&A (12:00 CT luncheon; livestream).
• 1:30 PM — Atlanta Fed’s Raphael Bostic remarks (economic outlook).
• 1:00 PM — U.S. 10-Year Note Auction (Treasury) — usual mid-month supply; watch $TLT/$TNX.
⚠️ Disclaimer: Educational/informational only — not financial advice.
📌 #trading #stockmarket #economy #CPI #Fed #oil #bonds #SPY #SPX #TLT #DXY #XLE

US100 Bullish Breakout! Buy!
Hello,Traders!
US100 is trading in a
Strong uptrend and the
Index made a strong bullish
Breakout of the key horizontal
Level of 23,720 which is now
A support and the breakout
Is confirmed so we are
Bullish biased and we will
Be expecting a further
Bullish continuation
Buy!
Comment and subscribe to help us grow!
Check out other forecasts below too!
Disclosure: I am part of Trade Nation's Influencer program and receive a monthly fee for using their TradingView charts in my analysis.

EURUSD - Bullish fair value gap and fibonacci support!At the end of July, EUR/USD experienced a sharp and decisive move to the downside, signaling a strong bearish momentum in the market. Following this decline, the pair began to recover, steadily climbing and partially filling the 4-hour Fair Value Gap (FVG). After tapping into the 4-hour FVG, price action has entered a corrective phase, moving lower towards a confluence of bullish levels. This area is defined by both the 1-hour and 4-hour FVGs, which align perfectly with the golden pocket of the Fibonacci retracement tool, a high-probability zone often watched by traders for potential reversals.
Bullish Support
The key bullish support zone sits around the 1.158 to 1.160 range. This area holds significant importance because it combines two strong technical factors: the 1-hour and 4-hour FVGs, as well as the golden pocket Fibonacci retracement. The overlap of these technical elements often acts as a magnet for price and can create a strong foundation for a bullish reaction. If the market respects this zone, we could see EUR/USD push higher in the short term, as traders capitalize on the support to drive price towards higher resistance areas.
Bearish Resistance
On the upside, the main bearish resistance zone lies between 1.170 and 1.174. This area represents the final portion of the unfilled bearish 4-hour FVG and could act as a significant barrier for further bullish progress. If price returns to this level, the strong supply pressure could result in a sweep of recent highs, fully filling the 4-hour FVG before potentially resuming the downward trend. This scenario aligns with the idea that sellers may re-enter the market aggressively once this resistance zone is tested.
Final Thoughts
Given the current market structure, my expectation is that the bullish support zone around 1.158 to 1.160 will hold, providing a potential launchpad for price to revisit and possibly complete the filling of the bearish 4-hour FVG near 1.174. However, if the market breaks decisively below the 1-hour FVG, it could indicate a shift in sentiment, opening the door for a bearish continuation and deeper downside targets. The coming sessions will be critical in determining whether EUR/USD can maintain bullish momentum or if sellers will regain control.
-------------------------
Disclosure: I am part of Trade Nation's Influencer program and receive a monthly fee for using their TradingView charts in my analysis.
Thanks for your support. If you enjoyed this analysis, make sure to follow me so you don't miss the next one. And if you found it helpful, feel free to drop a like 👍 and leave a comment 💬, I’d love to hear your thoughts!

CAVA Earnings Options Play (Aug 12, 2025⚠️ CAVA Earnings Options Play (Aug 12, 2025)**
**Bias:** 🐻 Moderate Bearish (65% Confidence) — Mixed fundamentals + bearish technicals
📊 **Fundamentals:**
* Revenue growth strong (+28.1% TTM) but EPS expected to plunge -58.3%
* Margins tight; cost pressures looming
* Forward P/E sky-high at 168.7 — pricey expectations
* Sector exposed to consumer spending risks
📈 **Technicals:**
* Trading below 50 & 200 DMA → bearish momentum
* RSI near oversold at 40.08 — possible short-term bounce but downtrend intact
* Key support: \$82.00 — breach signals more downside
💡 **Options Flow:**
* Heavy open interest on \$80 puts and \$85 calls — mixed sentiment but bearish tilt
* IV Rank 60% with expected move \~ \$5.00 → priced for volatility
---
### 💣 Trade Setup:
* **Instrument:** CAVA
* **Trade:** Buy PUT
* **Strike:** \$82.00
* **Entry Price:** \$4.05 (bid side, conservative)
* **Expiry:** Aug 15, 2025
* **Profit Target:** \$12.15 (+200%)
* **Stop Loss:** \$2.025 (50% premium decay)
* **Size:** 2 contracts
* **Entry Timing:** Pre-earnings close
* **Earnings Date:** Aug 14, AMC
⚠️ **Risk:** Close position within 2 hours post-earnings if no target hit
---
**TL;DR:**
Price action and fundamentals suggest downside risk post-earnings. Buying puts at \$82 strike targets a big move down, but manage your risk tightly around earnings volatility.
\#CAVA #EarningsPlay #OptionsTrading #PutOptions #BearishSetup #VolatilityTrading #OptionsFlow #StockMarket #TechnicalAnalysis #EarningsSeason

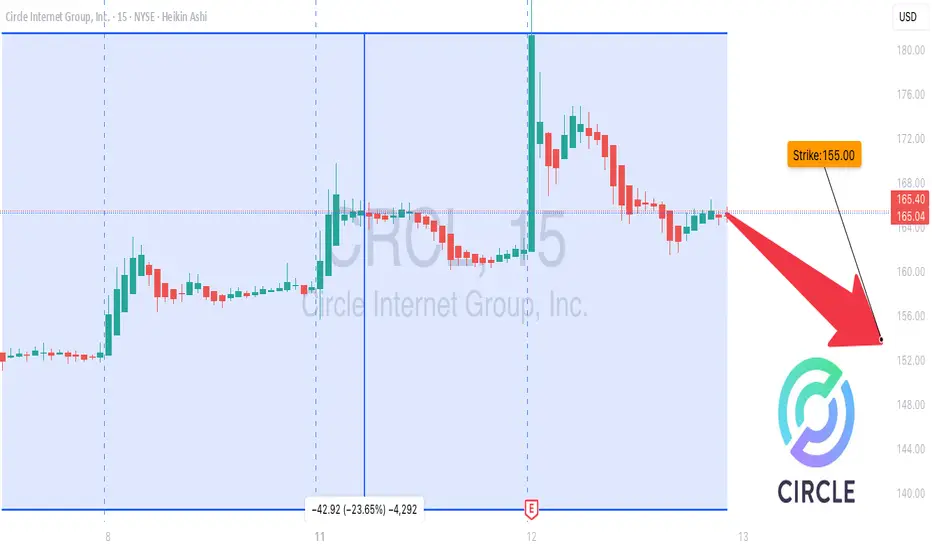
CRCL on the Edge: Bearish Play Loading… 📉 CRCL Weekly Options Alert (Aug 12, 2025)**
**Bias:** ⚠ **Neutral → Bearish** — Weak volume + bearish weekly RSI
📊 **Quick Stats:**
* **Daily RSI:** 40.8 ↗ (bullish divergence from oversold)
* **Weekly RSI:** 58.7 ↘ (bearish drift)
* **Options Flow:** Call/Put = **1.19** → neutral
* **Volume:** 1.0× last week — no institutional conviction
* **Gamma Risk:** Moderate — 3 DTE & rising time decay
💡 **Consensus Take:**
* Lack of strong buying pressure + bearish weekly trend = higher downside risk short term.
**Trade Idea:**
* **Type:** Naked PUT
* **Strike:** \$155.00
* **Expiry:** Aug 15, 2025
* **Entry:** \$6.22
* **PT:** \$10.90 (+75%)
* **SL:** \$2.80
* **Confidence:** 68%
* **Entry Timing:** Open
⚠ **Risks:**
* Earnings news could swing price violently
* Daily RSI divergence could spark short-term bounces against your position
---
**📈 TL;DR:**
Weekly trend still weak, volume flat, options flow balanced → bearish skew.
\#CRCL #OptionsTrading #WeeklyOptions #PutOptions #OptionsFlow #StockMarket #TradingSetup #BearishTrade #TechnicalAnalysis #OptionsAlert
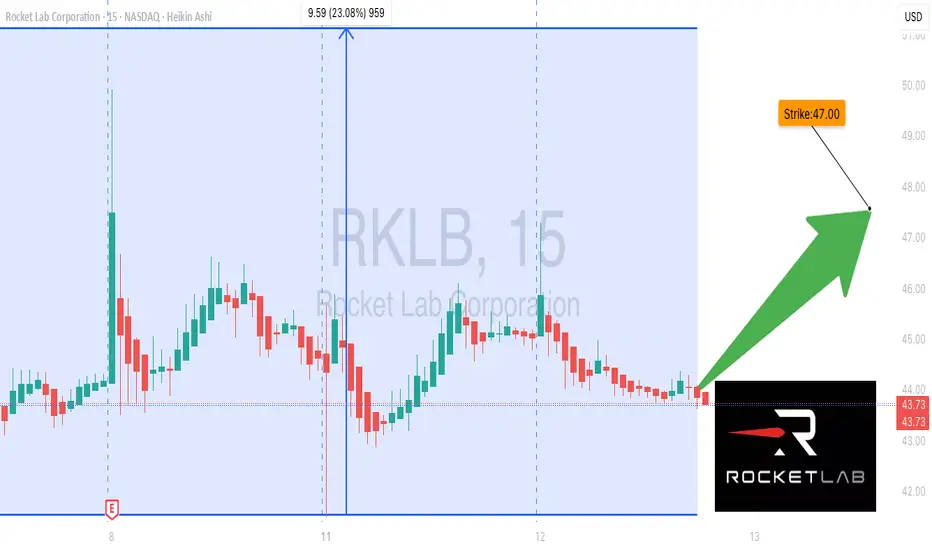
RKLB wait for break Out Fibo Level🚀 RKLB Weekly Options Alert (Aug 12, 2025)**
**Bias:** 🔥 **BULLISH** — Institutional money flowing in, low VIX, RSI rising!
📊 **Quick Stats:**
* **Daily RSI:** 53.9 ↗ (building momentum)
* **Weekly RSI:** 73.7 ✅ strong uptrend
* **Volume:** 1.4× avg — institutional accumulation confirmed
* **Options Flow:** Call/Put = **1.80** 📈
* **VIX:** 15.89 — great for longs
💡 **Consensus Play:**
* **Type:** Naked CALL
* **Strike:** \$47.00
* **Expiry:** Aug 15, 2025
* **Entry:** \$0.93
* **PT:** \$1.67 (+80%)
* **SL:** \$0.40
* **Confidence:** 75%
* **Exit Timing:** Before Friday to dodge gamma crush
⚠ **Risks:**
* Daily RSI still under 55 — could see intraday chop
* Only 3 DTE — time decay will bite if slow move
---
**📈 TL;DR:**
Volume + RSI + options flow = 🚀 Setup. Tight risk. Fast exit.
\#RKLB #OptionsTrading #SwingTrade #WeeklyOptions #FlowTrading #UnusualOptions #OptionsFlow #StockMarket #TradingSetup #BullishBreakout #TechnicalAnalysis #CallOptions #OptionsAlert
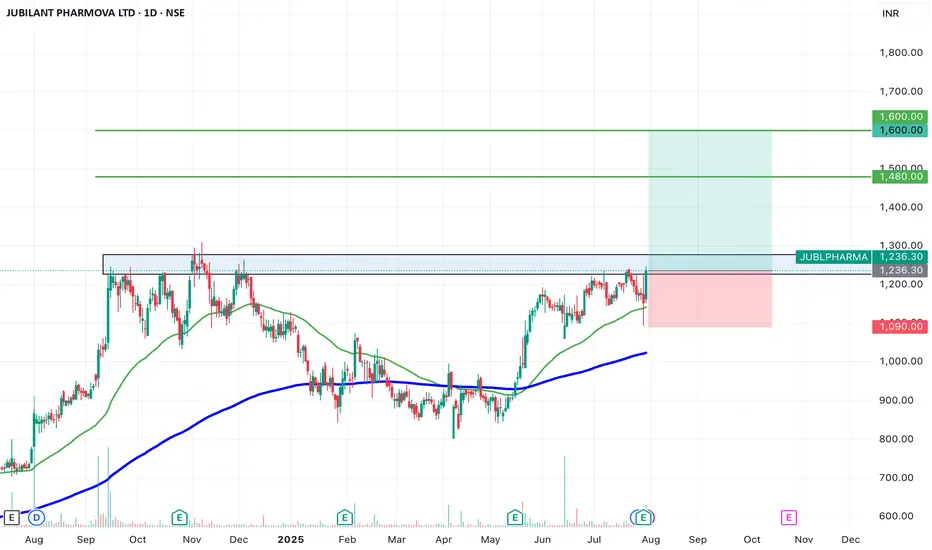
SWING IDEA - JUBILANT PHARMOVAJubilant Pharmova , a diversified pharmaceutical company focused on CRAMS and specialty pharma, is presenting a strong swing opportunity backed by a major pattern breakout and volume confirmation.
Reasons are listed below :
Breakout from an Inverted Head & Shoulders pattern after over a year of consolidation
Attempting breakout above 1250, a key resistance zone with multiple rejections in the past
Strong marubozu candle on the daily chart with a notable volume spike, signaling conviction
Trading near all-time highs, and comfortably above key EMAs, reinforcing trend strength
Target : 1480 // 1600
Stoploss : weekly close below 1090
DISCLAIMER -
Decisions to buy, sell, hold or trade in securities, commodities and other investments involve risk and are best made based on the advice of qualified financial professionals. Any trading in securities or other investments involves a risk of substantial losses. The practice of "Day Trading" involves particularly high risks and can cause you to lose substantial sums of money. Before undertaking any trading program, you should consult a qualified financial professional. Please consider carefully whether such trading is suitable for you in light of your financial condition and ability to bear financial risks. Under no circumstances shall we be liable for any loss or damage you or anyone else incurs as a result of any trading or investment activity that you or anyone else engages in based on any information or material you receive through TradingView or our services.
@visionary.growth.insights
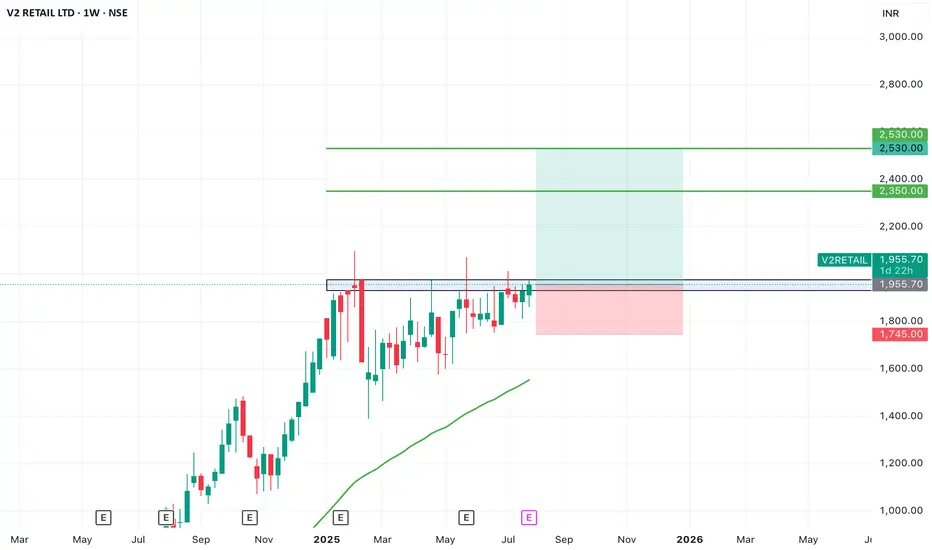
SWING IDEA - V2 RETAILV2 Retail , a small-cap value fashion retailer with a pan-India presence, is showing strong bullish momentum and a textbook swing trade setup backed by multiple breakout signals.
Reasons are listed below :
Breakout from a VCP (Volatility Contraction Pattern) – indicating accumulation and strength
Ascending triangle breakout – classic continuation pattern
Cleared major resistance zone, confirming bullish intent
Maintains a clear uptrend with higher highs and higher lows
Target - 2350 // 2530
Stoploss - weekly close below 1745
DISCLAIMER -
Decisions to buy, sell, hold or trade in securities, commodities and other investments involve risk and are best made based on the advice of qualified financial professionals. Any trading in securities or other investments involves a risk of substantial losses. The practice of "Day Trading" involves particularly high risks and can cause you to lose substantial sums of money. Before undertaking any trading program, you should consult a qualified financial professional. Please consider carefully whether such trading is suitable for you in light of your financial condition and ability to bear financial risks. Under no circumstances shall we be liable for any loss or damage you or anyone else incurs as a result of any trading or investment activity that you or anyone else engages in based on any information or material you receive through TradingView or our services.
@visionary.growth.insights
Eli Lilly (LLY) – Pharma Giant at a Key Price LevelHi,
Eli Lilly & Co. is one of the world’s largest pharmaceutical companies, founded in 1876 and headquartered in Indianapolis. It operates in over 125 countries and is best known for blockbuster treatments in diabetes, obesity, oncology, and immunology. Recent growth has been driven largely by its GLP-1 class drugs Mounjaro and Zepbound, which have quickly become industry leaders in the weight-loss and diabetes markets.
Recent Fundamentals (Q2 2025)
Revenue: $15.56 B (+38% YoY)
- EPS: $6.31 (beat expectations)
- Mounjaro sales: $5.2 B
- Zepbound sales: $3.38 B
- Full-year guidance: Revenue $60–62 B, EPS $21.75–$23.00
- Margins: Gross margin ~82.6%, net margin ~25.9%
- Profitability: ROE ~75.5%, ROIC ~29.6%
While fundamentals remain strong, the recent Phase III data for the oral weight-loss pill orforglipron came in below expectations, sparking a ~14% drop, the stock’s steepest one-day decline in decades. Analysts have since trimmed long-term sales forecasts for this product.
From a valuation perspective, the stock trades at a premium (~41× P/E, ~10.7× P/S), leaving little room for major disappointments.
Technicals
Technically speaking, the price has arrived in the zone where I’ve been patiently waiting to share it as an idea. This is a good area from where to start building positions if you’re interested.
There are quite a few technical confluence factors aligning here, but be ready to grab it also around $500 if the market offers it. Let that be your guide:
- If you’re not willing to hold long-term, don’t touch it.
- If you’re not willing to buy more at lower prices, don’t touch it.
Good luck,
Vaido

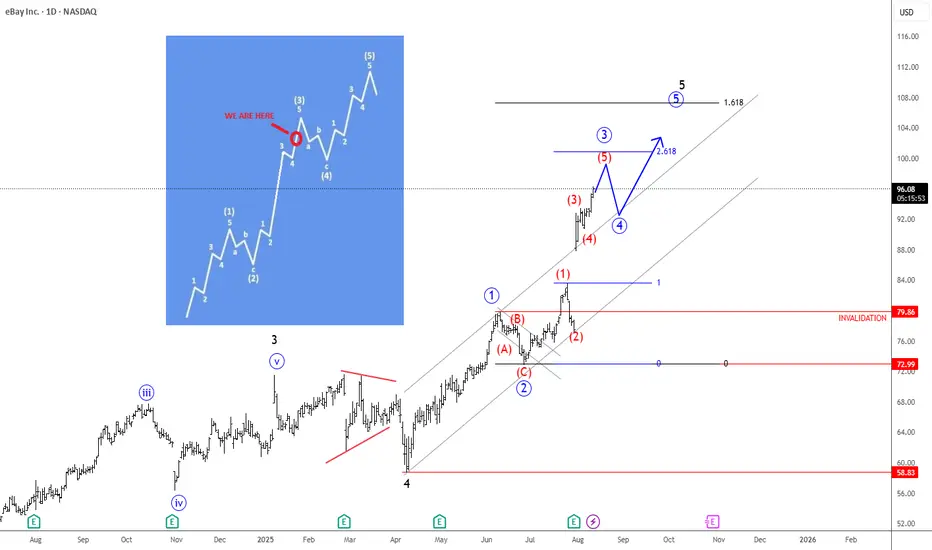
Ebay Extends The Rally; Pointing To 100 AreaEbay Extends The Rally within an impulse, which can push the price up to 100 area from technical and Elliott wave perspective.
Ebay is extending strongly higher after beating earnings at the end of July, which we see it as a wave 3 of an ongoing five-wave bullish impulse. Currently it can be trading in subwave (5) of 3 that can stop around 100 area, and from where we may see a new corrective pullback in wave 4, as eBay executives sell shares worth over 5.5million. So soon watch out for a new higher degree wave 4 pullback before the bullish trend for wave 5 resumes.
A bullish impulse in Elliott Wave Theory is a five-wave upward movement showing strong trend momentum. Wave 1 starts the advance, Wave 2 corrects part of it, Wave 3 is the longest and most powerful leg, Wave 4 consolidates without overlapping Wave 1, and Wave 5 is the final push before a larger correction. The key rules are: Wave 2 never fully retraces Wave 1, Wave 3 is never the shortest, and Wave 4 doesn’t enter Wave 1’s price zone. This pattern reflects shifting market psychology from early accumulation to final optimism.
NLB Banka Vision: Achieving €2 B Revenue and €1 B ProfitNLB Banka stands at a pivotal moment in its journey. Guided by a bold vision set forth by its Board of Directors, the bank is primed to transform into a leading financial powerhouse across Southeastern Europe (SEE). This vision is not merely aspirational; it is rooted in a clear, actionable roadmap that leverages the synergies of mergers and acquisitions (M&A) and organic growth, even amidst a challenging macroeconomic environment. By aligning its strategic initiatives with its core strengths, NLB Banka is well-positioned to achieve its ambitious targets of €2.2 billion in revenue and €1 billion in profit.
The Current Landscape
As of today, NLB Banka operates in a market characterized by both opportunities and challenges. While the SEE region offers significant growth potential due to underpenetrated financial markets, the current economic environment presents hurdles such as declining interest rates and inflationary pressures. The growth of the bank’s loan portfolio has been a bright spot, but it has faced challenges in fully offsetting the compression in net interest margins.
Nevertheless, NLB Banka's resilience and adaptability are evident. Its robust digital transformation initiatives, enhanced risk management frameworks, and customer-centric approach have provided a solid foundation to capitalize on growth opportunities. The Board recognizes that achieving its revenue and profit targets requires not only sustaining the current momentum but also scaling its operations strategically.
The Strategic Roadmap
To achieve €2.2 billion in revenue and €1 billion in profit, the Board has outlined a three-pronged strategy:
1. Accelerated Growth through M&A
The SEE region remains fragmented, with numerous mid-sized banks and financial institutions operating across borders. NLB Banka sees this as an opportunity to establish itself as a consolidator in the region. By acquiring strategically aligned banks and integrating their operations seamlessly, NLB Banka can expand its market share, customer base, and product offerings.
Target Markets: Focused acquisitions in high-potential markets such as Serbia, Croatia, and North Macedonia.
Synergies: Realizing cost efficiencies through operational integration and leveraging economies of scale.
Cross-Selling: Expanding the reach of its digital platforms and diversified product portfolio to acquired customer bases.
The successful execution of these M&A activities will enable NLB Banka to accelerate revenue growth while creating a strong competitive moat in the SEE region.
2. Organic Growth Through Innovation and Customer Focus
Organic growth remains a cornerstone of the bank’s strategy. By deepening relationships with existing customers and attracting new ones, NLB Banka aims to drive sustainable growth.
Digital Transformation: Continued investment in cutting-edge digital banking solutions to enhance customer experience and operational efficiency.
SME and Retail Expansion: Growing its SME and retail loan portfolios in underbanked areas of SEE.
Green and Sustainable Financing: Aligning with global trends by offering products such as green bonds and sustainable investment options, catering to environmentally conscious customers and businesses.
Customer-Centric Approach: Leveraging data analytics to personalize product offerings and improve customer retention.
3. Operational Excellence and Cost Optimization
Achieving the profit target of €1 billion requires more than just revenue growth; it demands a relentless focus on operational efficiency.
Streamlined Processes: Continued simplification of internal workflows to reduce costs.
Automation and AI: Using advanced technologies to enhance decision-making and automate routine operations.
Cost Synergies from M&A: Realizing savings through shared resources and consolidated systems.
Overcoming Challenges
The Board is acutely aware of the challenges that lie ahead. Declining interest rates, inflationary pressures, and regulatory hurdles require proactive measures to mitigate risks. NLB Banka’s strong capital position and risk management expertise will play a pivotal role in navigating these challenges. Additionally, the diversification of revenue streams—including fee income from wealth management, insurance, and payments—will further insulate the bank from macroeconomic volatility.
The Vision Realized
By 2028, NLB Banka envisions itself as the undisputed leader in SEE banking, with a robust footprint across the region. The successful execution of its M&A and organic growth strategies will not only drive financial performance but also position the bank as a key partner in the economic development of the SEE region.
At €2.2 billion in revenue and €1 billion in profit, NLB Banka will have proven that a clear vision, combined with strategic execution and operational excellence, can overcome even the most challenging of economic landscapes. This is not just a story of growth; it is a testament to the resilience, innovation, and leadership that define NLB Banka.

PLTR 1D — When the tea is brewed and the handle’s in placePalantir’s daily chart is shaping up a textbook cup with handle pattern — one of the most reliable continuation setups in technical analysis. The cup base was formed over several months and transitioned into a consolidation phase, building a rectangle structure where smart money likely accumulated positions before a breakout.
Now here’s the key: price has not only broken out — it’s settled above all major moving averages, including EMA 20/50/100/200 and MA 50/200. The breakout candle was supported by surging volume, signaling strong participation from institutional buyers. When all the averages start bending upwards, it's usually not by accident.
The breakout above the $121 resistance zone unlocked a pathway toward a target at $187 , derived by projecting the height of the cup upward from the breakout level. This kind of structure, once confirmed, often fuels aggressive continuation — and this one’s got the setup locked in.
From a fundamental perspective, Palantir is holding solid ground: strong earnings reports, expanding government and commercial contracts, and aggressive development in AI services. Institutional interest is rising steadily, and that momentum is visibly reflected in price action.
To sum it up: price has launched cleanly out of the consolidation zone, pierced all critical MAs and EMAs, and continues to gain momentum. While the market sips its tea, this cup is boiling hot. Just don’t forget your stop loss — this is a trading desk, not a tea party.
If you enjoy posts like this, drop a like, share it around, and let’s hear your thoughts below. It keeps ideas moving and the content flowing — free, sharp, and relevant.

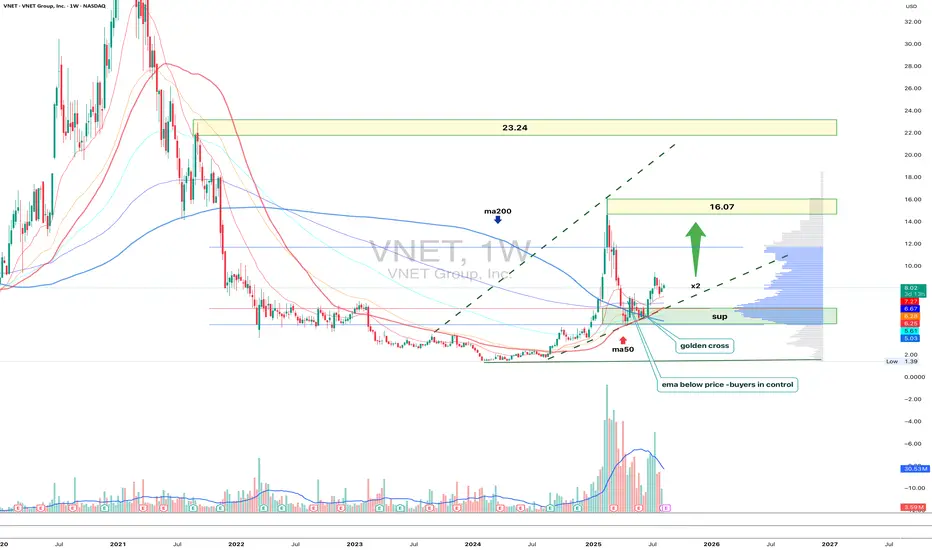
VNET 1W - second wave or second life?On the weekly VNET chart, the price has held above the 6.25–6.05 support zone, which previously triggered an impulsive rally. The current structure remains bullish: the MA50 is positioned above the MA200(golden cross) and ema below price(buyers control situation), and recent volume spikes indicate active buying interest. The next major resistance lies at 16.07 - where a key supply zone aligns with the previous local top. A breakout and consolidation above it would open the path toward the strategic target at 23.24, matching a Fibo extension and a historical distribution zone.
Fundamentally, VNET benefits from renewed investor interest in the Chinese tech sector and improved corporate earnings. Tactical plan: as long as 6.25–6.05 holds, long positions could target 16.07 first, with potential continuation toward 23.24.
A break below support cancels the bullish scenario. Sometimes the market offers a second chance and VNET may be one of those moments worth catching.
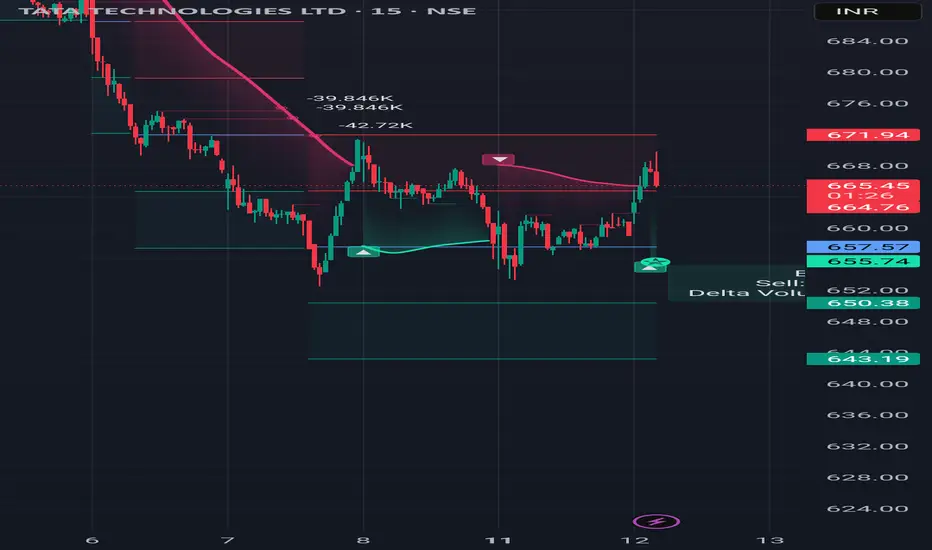
Short term Technical Idea TATATECH📢 PJV FINANCIAL – 1-2 DAYS TECHNICAL CALL 📢
🔷 SCRIPT: TATATECH
🔷 Action: BUY above ₹667.40
🔷 Stop Loss: ₹656 (📉 -1.71%)
🔷 Target: ₹688 (📈 +3.08%)
🔷 Risk–Reward Ratio: 1 : 1.80 ✅
📌 Short-term momentum trade idea – strictly follow SL.
🚀 #PJVSignals | 💼 #TechnicalCall
AMD stock up over 20% off the lows- outperform NVidia?AMD is still cheap relative to its growth and still way down from all time highs.
Seeking alpha analysts expect 25-30% annual growth in earnings yearly. The stock is still in the low 20s PE. Stock can double and still be a good business worth owning for the long term and let compounding earnings work.
Low rsi and bollinger bands gave us the signal to buy, we bought with leverage, now we are in the shares unlevered.
Target would be all time highs over the next 2-3 years.

Nightly $SPY / $SPX Scenarios for August 12, 2025 🔮 Nightly AMEX:SPY / SP:SPX Scenarios for August 12, 2025 🔮
🌍 Market-Moving News 🌍
🇨🇳 Tariff Truce Extended 90 Days
The White House signed an order late Monday extending the U.S.–China tariff pause by 90 days—removing a key overnight risk into CPI day. Watch AMEX:SPY / SP:SPX , TVC:DXY , NASDAQ:TLT for the reaction.
💵 Dollar Firms Into CPI
The dollar edged higher ahead of this morning’s inflation print as traders recalibrate rate-cut odds; stocks and long U.S. yields were choppy into the release.
🗓️ Quiet Tape, Big Catalyst
Futures and global markets stayed cautious into CPI; positioning is tight after Monday’s drift lower.
📊 Key Data Releases & Events (ET) 📊
📅 Tue, Aug 12
6:00 AM — NFIB Small Business Optimism (July).
8:30 AM — CPI (July) & Core CPI (official BLS release).
10:00 AM — Richmond Fed Pres. Tom Barkin speaks (Chicago; 9:00 CT).
10:30 AM — Kansas City Fed Pres. Jeff Schmid speaks (9:30 CT).
2:00 PM — Monthly U.S. Federal Budget (July) (Treasury MTS, 8th business day).
⚠️ Disclaimer: Educational/informational only — not financial advice.
📌 #trading #stockmarket #economy #CPI #Fed #SPY #SPX #DXY #TLT

Long TESLATrading Fam,
Today my indicator has signaled a BUY on $TSLA. The technicals align. M pattern looks to have completed at strong support (RED TL) and is bouncing upwards inside of a solid liquidity block. Buyers are stepping in. I'm in at $315 and will shoot for $430 (probably taking some profit along the way). My SL is currently $241 but will trail as we enter profit.
Best,
Stew

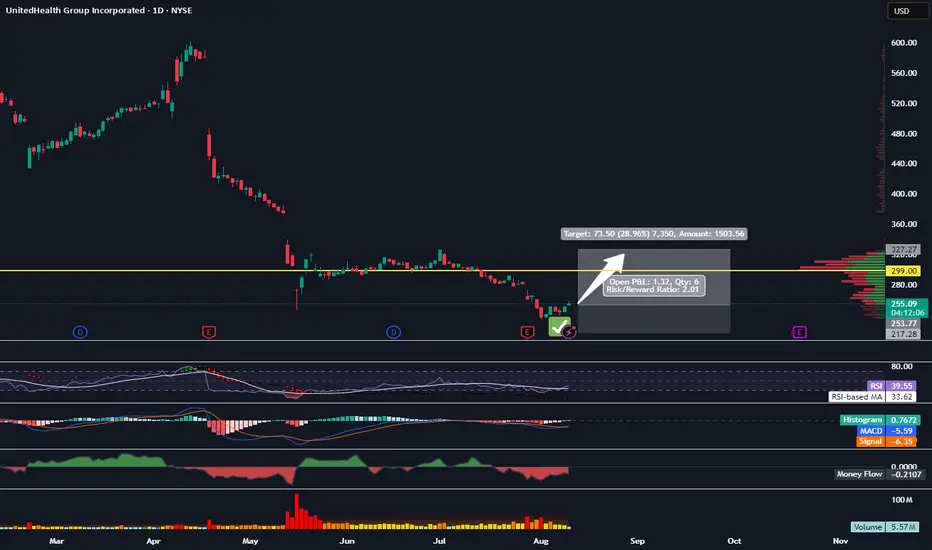
Entering UNH HereTrading Fam,
I'm not going to go into a long exposé about how great the technicals are here because, truthfully, they are not great. In fact, there is relatively little that supports any kind of entry here other than the fact that this stock is extremely oversold. Really, the only reason I even considered an entry here is that my indicator has given me a buy. If you have been following me for any length of time, you know that this thing is knocking it out of the park in stocks. But to keep it safe, I am entering a 1:2 long rrr, shooting for $327 with a $217 SL. Let's see if my little indicator can keep its amazing win streak going even without a lot of technicals to support it.
✌️Stew