UAMY 1D: Antimony Testing Its BackboneUnited States Antimony is a U.S.-based producer of antimony and related metals, a raw materials asset with pronounced cyclicality and high sensitivity to industrial demand. The company operates in the strategic materials segment, which makes it particularly attractive during commodity cycle upswings and periods of rising geopolitical demand for rare metals.
On the daily chart United States Antimony transitioned from the expansion phase toward 19.71 into a controlled corrective structure. The failed acceptance above 14.52 confirmed supply dominance at that level and initiated a sequence of lower highs. Price is now rotating back into the 5.95–6.55 demand zone.
This area aligns with the 0.786 Fibonacci retracement and a rising diagonal support originating from the 4.35 low. That trendline has acted as dynamic support throughout the prior impulse and is now being tested again.
Momentum conditions suggest compression rather than acceleration. RSI is printing bullish divergence against recent price lows. Stochastic remains in oversold territory and is attempting to turn higher. MACD histogram is contracting, signaling weakening downside momentum. ADX remains subdued and does not confirm a strengthening downtrend. Volume between 6 and 7 shows clustering rather than capitulation.
As long as 5.95–6.55 and diagonal support hold, the base scenario allows for a structural rotation toward 12.00 as the first liquidity reaction. Acceptance above that level opens space toward 15.69, aligning with the 1.618 Fibonacci expansion. A sustained break below the demand zone would invalidate the compression thesis.
Heavy metal, light structure. The decision zone is here.
Stockstobuy

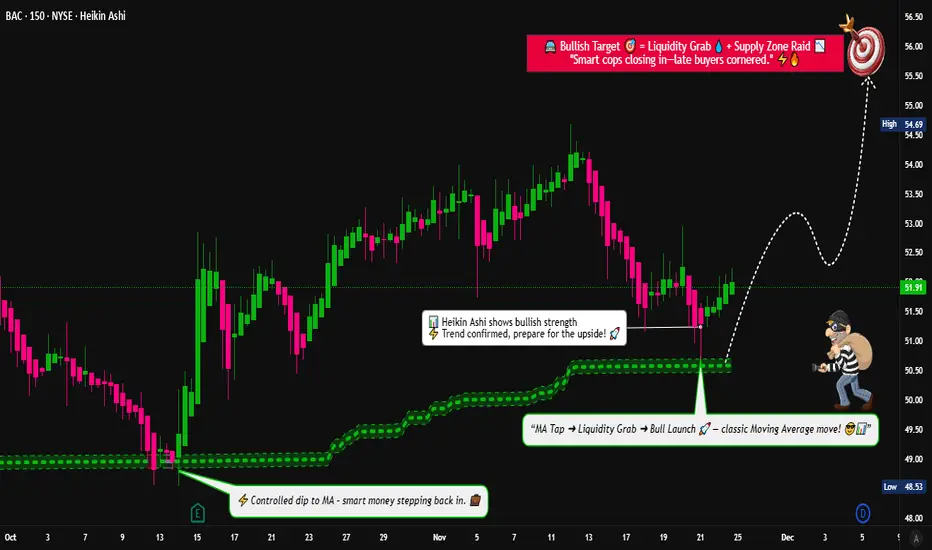
BAC Pullback Into MA — Is This the Next Swing Continuation Move?🔥📈 BAC — Bullish Pullback Playbook Into MA | Thief-Style Layer Entry 📊💼
Hey Traders! 😎
Here’s my Bullish Pullback Into Moving Average playbook on BAC — Bank of America Corp (NYSE).
Clean setup, thief-friendly layering, and a classy escape plan 😅🕶️💸
📘 Asset
BAC — Bank of America Corporation (NYSE)
Swing-trade style breakdown with a professional twist and a few laughs for the OG Thief Family 😄💼
🎯 Plan: Bullish Pullback Into the Moving Average
Price is dipping beautifully back toward key Moving Averages — classic bullish continuation behavior.
I’m monitoring for strength after the pullback along the MA zone. ✔️
🟦 Entry Plan (Thief Layering Strategy)
Thief strategy = multiple limit orders placed at different value zones.
This helps average in during the pullback without chasing. 👇💰
🔥 Layered Buy Limit Zones:
50.50
51.00
51.50
52.00
(Feel free to extend the layers if your own plan requires it.)
This is NOT a buy signal — only an example of a layering method for educational purposes.
🛑 Stop Loss (Thief Style)
Thief SL zone: 49.00
This is merely an illustrative SL point in my personal playbook style.
Note: Dear Ladies & Gentlemen (Thief OG’s), I am not recommending that you use my SL.
You make your own decisions and manage risk according to your plan.
🎯 Target Zone
We have strong resistance overhead + extended levels + potential liquidity traps.
So the smart thief knows when to take the bag and vanish 🏃💨💰
My take-profit zone: 56.00
Note: Dear Ladies & Gentlemen (Thief OG’s), I am not recommending that you use my TP.
You make your own choices — take money when you want, at your own risk.
🧠 Market Notes & Why the Setup Works
Price respecting MA structure
Clear bullish momentum on higher timeframes
Liquidity resting above recent swing levels
Healthy pullback with momentum probability toward continuation
Good behavior around institutional zones
🔗 Related Pairs to Watch (Correlation Insight)
BAC has measurable correlation with U.S. financial-sector instruments. Watching them helps confirm sentiment 🧩📊
AMEX:XLF — Financial Select Sector ETF
When XLF is strong, BAC often follows the broader sentiment.
NYSE:JPM — JPMorgan Chase
Sector correlation; bullish flow here can support BAC continuation.
$C — Citigroup
Similar pullback and continuation behavior; keep an eye on banking flow.
AMEX:SPY — S&P 500
Strong indices = supportive environment for major banks.
📘 Quick Correlation Summary
Banking stocks move together due to macro factors like rates, liquidity, and earnings expectations.
Strong AMEX:XLF + bullish AMEX:SPY generally improves probability for bullish pullbacks in BAC.
If all “sister pairs” show weakness, expect slower continuation.
✨ “If you find value in my analysis, a 👍 and 🚀 boost is much appreciated — it helps me share more setups with the community!”
⚠️ Disclaimer
This is a thief-style trading strategy created for educational and fun purposes only.
Not financial advice, not signals, and not a recommendation to buy or sell any asset.
RDW 1W Structural Compression After ExpansionOn the weekly chart Redwire has completed a full market cycle from base formation to impulsive expansion and into deep correction. The long-term bottom formed in the 2–3 range, where accumulation developed before the breakout phase. That base led to an expansion move toward 26.66, marked by volatility expansion and range acceleration.
After printing the high, structure shifted. A descending wedge developed during the corrective phase, characterized by lower highs compressing under a declining resistance line. The attempt to break above 14.52 failed to produce weekly acceptance. Liquidity was taken, but no structural confirmation followed, and price continued lower within the wedge formation.
The current move brings price back into the 6.97–7.78 demand zone. This range aligns with the 0.702–0.786 Fibonacci retracement of the entire 2 → 26.66 impulse, coincides with a high-volume node on the profile, and sits near the weekly MA200. Downside momentum has slowed, the angle of decline has flattened, and ADX does not signal trend acceleration. This reflects compression into support rather than aggressive distribution.
Structurally, this is a decision zone. Holding 6.97–7.78 opens the path toward 14.00 as the first liquidity reaction level. Acceptance there would shift focus to 21–22, where prior supply was concentrated. A sustained break below 6.97 would invalidate the accumulation thesis and transition the model into deeper redistribution.
Fundamentally, Redwire remains in an investment phase within the space infrastructure sector. Q3 2025 revenue was 103.43M USD, with Q4 2025 estimated at 98.78M USD. Q3 EPS printed -0.29 USD, with Q4 estimated at -0.18 USD. Operating cash flow TTM stands at -145.99M USD and free cash flow TTM at -159.62M USD. Financing cash flow TTM of 330.34M USD reflects reliance on capital markets to fund expansion.
Fundamental summary: revenue growth continues, losses are narrowing, but free cash flow remains negative. The business is scaling, not yet profitable.
RDW is no longer in expansion mode. It is testing structural support after a completed impulse cycle. In aerospace, trajectory matters more than velocity.

TTWO Buy/LongTTWO with the release of GTA VI being released this year as promised by the CEO I pray to God for all of us to see $300+ minimum when it is released however this is the PERFECT buying opportunity for all traders and investors alike who wish to see massive growth in their portfolio. I strongly recommend purchasing TTWO as the stock has plummeted 20-22% just this last month alone with a very nice W pattern structure occurring to this as well it looks like it is about to go to the sky with my target profits being posted in the chart if you would like to study, analyze, and position yourself in. I am NOT setting a stop loss for this trade simply due to the fact I strongly believe in this company as I have cherished many of their games so have all of us in the past with strong titles such as GTA, Bully, RDR, Mafia, 2K, and many many other big IPs. This is something everyone will want to profit off on. Please send me a message if you have any concerns or opinions on my stock pick analysis as I will be posting much more diversified from FX, stocks, futures, crypto, and much more trading charts in the following weeks. God bless in Jesus name I pray for all of us to profit as much as possible from this market AMEN!

BITF Bitfarms Could Be the Next IREN Limited Bitfarms has publicly stated that it is winding down Bitcoin mining and reallocating capital toward AI and high-performance computing data centers. This is not a vague narrative shift — it involves concrete steps: redeveloping existing sites, leveraging contracted power, and targeting long-term AI compute customers.
This matters because AI data-center revenue is contractual, recurring, and far more predictable than Bitcoin mining, which is exposed to BTC price, difficulty, and halving cycles.
The IREN Parallel
IREN’s rally was driven by three factors:
Existing low-cost power
Speed of execution into AI/HPC
Market re-rating from “crypto miner” to “AI infrastructure”
BITF checks the same boxes:
Large power footprint already in place
Facilities that can be repurposed for GPU-based workloads
A clear strategic pivot toward AI compute
If BITF successfully executes its first AI deployments, investors may begin valuing it closer to AI data-center peers rather than Bitcoin miners — which implies materially higher multiples.
Why the Market Could Re-Rate BITF:
The AI compute market is supply-constrained, not demand-constrained. Power, land, and grid access are the bottlenecks — exactly the assets Bitfarms already owns.
If even a portion of BITF’s capacity transitions to AI/HPC under long-term contracts, the stock’s risk profile and earnings visibility change completely.
Just as IREN surprised the market by transforming from a miner into an AI infrastructure winner, BITF has a real shot at becoming the next breakout re-rating story — provided execution follows strategy.
Recent options flow adds to the bullish setup, with traders buying far out-of-the-money call options on BITF in recent days, signaling expectations of a significant upside move rather than a short-term trade.
For investors looking for asymmetric upside in AI infrastructure, BITF may be one of the most underappreciated transition plays on the board.


PRME 1W(Prime Medicine, Inc.) - Editing the futurePrime Medicine, Inc. is a biotechnology company focused on next-generation gene editing technologies, targeting rare genetic diseases and currently operating in an active R&D phase.
On the weekly chart, PRME has completed a breakout from a long-term downtrend and is now consolidating during a structural retest. Price is holding within the 3.59–4.00 support zone, where the broken trendline retest, the 0.618 Fibonacci level, and a high-interest volume area align. Price remains above the EMA, confirming that buyers continue to control the structure within the current range. Volume expanded during the breakout and has cooled during consolidation, which is typical behavior during accumulation phases. The current area represents a high-demand zone according to the volume profile, reinforcing its structural importance.
From a fundamental perspective, the company remains unprofitable, which is typical for early-stage biotech. Estimated EPS for Q4 2025 is −0.25 USD, with projected revenue of 2.08M USD. Cash flows remain negative, but liquidity levels are high and debt pressure is not critical, allowing continued R&D without immediate capital stress. Market valuation is driven by expectations around clinical progress rather than present financial performance.
This is a higher-timeframe structural transition story, where the market gradually reassesses the asset after a prolonged decline. Biotech is never about comfort, but this is how early reversals usually start.

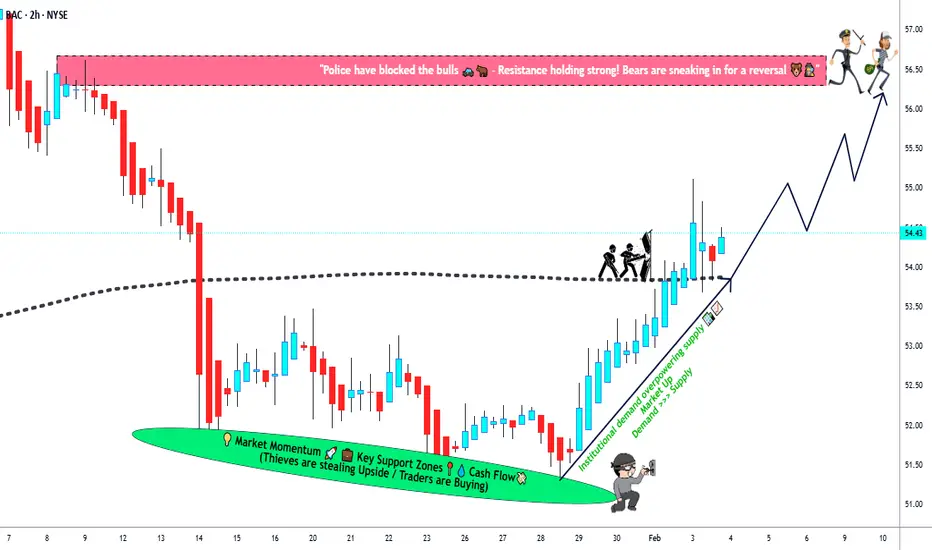
Bank of America (BAC) — Breakout Structure Analysis🏦 BAC Bank Heist Alert: Moving Average Breakout & Retest Play! 💰
📊 BANK OF AMERICA CORPORATION (NYSE: BAC)
Market Strategy: Bullish Day/Swing Trade Setup 🎯
Trading Style: Thief's Layered Entry Method
🎯 THE SETUP
📍 Entry Strategy: Flexible Multi-Layer Approach
The "Thief Strategy" utilizes multiple limit orders (layering technique) for optimal positioning:
💎 Suggested Buy Limit Layers:
Layer 1: $53.50
Layer 2: $54.00
Layer 3: $54.50
Note: You can add more layers based on your capital allocation and risk tolerance
🚀 Bullish Trigger: Moving Average BREAKOUT & RETEST confirmed
🎯 PROFIT TARGET
Take Profit Zone: $56.50 🏆
Why This Target?
The moving average is acting as a "Police Barricade" 🚧 — strong resistance zone combined with:
📈 Overbought conditions developing
Potential bull trap formation
⚠️ Lock in profits before the crowd exits
Important: This is a suggested target. Feel free to adjust based on your own analysis and risk management. Your profits, your rules! 💪
🛡️ RISK MANAGEMENT
Stop Loss: $53.00 🛑
Disclaimer on SL: This stop level is based on the Thief OG strategy framework. However, YOU are the boss of your own trades — adjust your stop loss according to your risk tolerance and account size.
📰 FUNDAMENTAL & ECONOMIC FACTORS
💡 Key Catalysts Driving BAC:
📊 Q4 2025 Earnings: Bank of America delivered strong quarterly results with $7.6B in net income and $28.4B in revenue, driven by trading, investment banking, and asset management growth
🏛️ Federal Reserve Policy: The Fed held rates steady at 3.5%-3.75% in January 2026, with BofA economists projecting the 10-year Treasury yield ending at 4-4.25%, potentially supporting lending margins if rates stabilize
📈 Economic Growth: BofA's global research team forecasted stronger-than-expected U.S. economic growth for 2026 at 2.4% GDP, driven by AI investments, fiscal stimulus, and tariff moderation
💼 Digital Transformation: The company's emphasis on digital transformation, including expansions in workplace benefits and AI-enhanced services, positions it to capture growth in fee-based revenues
💰 Dividend News: Bank of America declared a $0.28 per-share dividend on common stock payable March 27, 2026
📊 RELATED PAIRS TO WATCH
🏦 Banking Sector Correlation:
NYSE:JPM (JPMorgan Chase): Largest U.S. bank by market cap, strong correlation with BAC in lending margins and Fed policy sensitivity
NYSE:WFC (Wells Fargo): Similar regional exposure and consumer banking focus, moves in tandem during sector rotations
$C (Citigroup): BAC shares rose alongside peers like Wells Fargo and Citigroup amid discussions of banks regaining earnings momentum
NYSE:GS (Goldman Sachs): Investment banking activities correlation, especially during M&A cycles
AMEX:XLF (Financial Select Sector SPDR): Overall financial sector ETF - indicates broader market sentiment towards financials
Key Correlation Points:
Fed interest rate decisions impact all major banks simultaneously ⚡
Net interest margin compression/expansion moves sector together 📊
Regulatory changes affect banking sector uniformly 📜
Credit quality concerns spread across financial institutions 🔍
⚠️ RISK FACTORS TO MONITOR
🔴 Potential Headwinds:
Regulatory changes in consumer protection and capital requirements could impact cost structures
Moving average resistance creating sell pressure
Overbought technical conditions developing
Geopolitical tensions or inflation surprises could create market pressures
🎯 THIEF'S FINAL WORD
This setup combines technical breakout momentum with solid fundamental backing. The layered entry strategy allows you to average in as the stock moves, while the moving average resistance provides a clear profit-taking zone. Remember, banks are rate-sensitive beasts — watch Fed announcements! 🦅
Trade Smart. Trade Safe. Escape with Profits. 💎🚀
✨ If you find value in my analysis, a 👍 and 🚀 boost is much appreciated — it helps me share more setups with the community!
Vedanta - My Stock Pick for 2026Starting the year at ATH. Coming out of 15 year period of consolidation.
Look for dips till 530 to enter.
Target: 765 / 1200
Support: 530 / 495 / 360
Below 495 exit temporarily and buyback on reversal above 530.
Disclaimer: I have entered the trade around 606. Looking for dips to build on position.

EYPT - Bullish Swing Trade Setup*not investment advice or recommendation*
EYPT — Bullish Swing Trade Setup
Big Picture
EYPT remains a structurally strong stock, up +100% since August 2025. This is a trend continuation setup, not a bottom-fishing exercise.
Weekly Timeframe (Trend Context)
Price is pulling back into prior resistance, which has the potential to act as support
Weekly ADX remains elevated, confirming strong bullish trend integrity
No signs of weekly trend failure — this looks like a controlled pause within an uptrend
Translation: The primary trend is still very much alive.
Daily Timeframe (Setup Quality)
Price is retracing into confluent potential support:
Rising 50-day & 100-day SMAs
Major former resistance zone
Daily ADX is declining during the pullback → bearish pressure lacks strength
Volume is contracting on the dip → sellers are not in control
This has all the characteristics of a buyable pullback, not distribution.
Entry & Execution Plan
Trigger: Entry above Tuesday’s high
Stop: Below low of the week
Momentum Confirmation:
RSI(5) closed back above 50 → short-term momentum re-aligning with the weekly trend
Price reclaiming a flat-to-rising 5-day SMA
All conditions checked: trend, structure, momentum, and risk defined.
This is exactly what you want to see in strong momentum stocks:
Strong weekly trend → weak pullback → momentum re-engages.
Alignment across timeframes.
👀 On watch for continuation.

MUltibagger in making
After a downfall of 58% from it's high, Jindal Saw formed a base at around 153. After a sequential gains in Q3 results stock surges and gives a breakout at 176.
Jindal Saw is a manufacturing company focused on pipes mainly used for water, oil and gas, sewarage with a market cap of 11365 cr.
Financials are all good for the company,
PE : 10
ROE : 15%
Positive cashflow
Stock declines to a level of 177 after a breakout and now is the best time to buy this stock for a huge upside.

Highlander Silver (OTC: HLSCF) Delivered- Gaining 37%+ We first brought Highlander Silver Corp. (CSE: HSLV | OTC: HLSCF) to your attention at $3.94 on the 24th December, 2025, and since that coverage the stock has surged as high as $5.40, delivering over 37% in gains in a very short period of time.
That is a massive move by any standard, and it underscores the strength of the trend now unfolding in this name.
The stock closed yesterday’s session at $5.15, up 8.42% on the day, as momentum continues to accelerate and buyers remain firmly in control.
Zooming out, the bigger picture is even more impressive. HLSCF is now up approximately +574.67% over the past 52 weeks, placing it among the top-performing precious metals equities in the market.
Highlander Silver carries a market capitalization of roughly $804.89 million, with an enterprise value near $730.67 million, reflecting growing confidence in the company’s scale, assets, and long-term potential. The company is focused on the acquisition, exploration, and evaluation of mineral properties in Peru, with exposure to gold and silver, and its flagship La Estrella project in central Peru continues to anchor the story.

META Can rise As It Forms A Bullish W PatternMETA Can rise As It Forms A Bullish W Pattern
Meta has been finding support and in the past couple of days it has started forming a base which can lead to a breakout. If this breakout sustains, we can have a possible formation of bullish W pattern. Targets are self evident.
Lets wait and watch and always this is not and advice but just an observation. Risk management is extremely important as always.
Follow for more. Please support this analysis by liking, commenting, and sharing with friends, colleagues, traders, and trading communities. Thanks👍🙂

NFLX (Netflix) Possible Buy OpportunityNetflix along with several other NASDAQ stocks have been taking good levels of corrections. I posted about Microsoft yesterday too.
Netflix is running inside an ABCD pattern which can bring it down to the 50% retracement level around 75.66. However, this can only happen if the current support is broken and a bull trap is set. There are a few more levels which can be good levels to BUY or for Dollar Cost Averaging but they are not in the scope of this simple analysis as of now.
Lets wait and watch and always this is not and advice but just an observation. Risk management is extremely important as always.
Follow for more. Please support this analysis by liking, commenting, and sharing with friends, colleagues, traders, and trading communities. Thanks👍🙂

Small Caps Pause on Tariffs – Key Levels to Trade IWMAMEX:IWM Daily Outlook 📈
Tariff headlines cooled the hot streak, but structure stays bullish while above 261.32. Small caps still showing relative strength vs SPY/QQQ — this is chop, not a trend reversal (for now).
🔑 Key Levels
• Pivot: 261.32 🎯
• Resistance: 265.75 → 267.18 🚧
• Support: 259.27 → 258.24 🛡️
🧭 Trade Thesis
Bull Case 🟢
– Reclaim 265.75 → run to 267.18
– Dips holding 261.32 = buy structure
– Best look: VWAP reclaim + OR hold
Bear Case 🔴
– Acceptance below 261.32 flips bias
– Targets 259.27 → 258.24
– Below 258 opens 255 zone
🎯 Plan
Buy weakness > chase highs
Flip short only if 261 fails
Risk defined at the pivot
Levels > Noise

ROBINHOOD HOOD Bearish Playbook — Thief on Duty!📉 ROBINHOOD MARKETS INC. (HOOD) — Bearish Profit Playbook
🔥 Swing / Day-Trade Thesis with Thief Layer Strategy
🧭 Market Context & Core Idea
The bearish outlook is confirmed after HULL Moving Average shows a downside breakout, signaling momentum shifting toward sellers. This forms the backbone of today’s playbook 📉⚔️.
The setup focuses on a layered entry (Thief Strategy) — a structured way of placing multiple limit orders at different price levels to average into premium zones with precision.
🎯 Plan: Bearish Setup with Thief-Style Layered Execution
This plan uses multiple SELL LIMIT layers, allowing flexibility and better control across volatility zones:
🔻 Layered Entry Zones (Sell Limit Layers)
125.00
120.00
115.00
110.00
(You may increase the number of layers based on your own approach — thief style is flexible.) 😎🧤
🛑 Stop-Loss (Thief SL)
SL @ 130.00
⚠️ Dear Ladies & Gentlemen (Thief OGs), this SL is not a recommendation — adjust your stop according to your own risk appetite. You make the money, you take it at your own risk.
🏁 Target Zone
The Moving Average is acting as strong support, and current structure suggests oversold conditions + a possible bullish trap scenario.
🎯 Target @ 92.00
⚠️ Dear Ladies & Gentlemen (Thief OGs), this TP is not fixed — targets must match your personal risk-to-reward logic. Manage wisely.
📊 Why This Setup Works (Key Technical Notes)
✨ HULL Moving Average breakout confirms bearish flow
✨ Multi-layer entries help capture stretched price spikes
✨ Oversold conditions hint at potential profit-taking zones
✨ Support zones + price traps increase snap-back volatility
✨ Ideal for swing/day-traders who prefer structured scaling
🔍 Related Pairs to Watch (Correlation Radar)
Tracking correlated or sentiment-linked assets helps understand broader flows:
🧩 Tech / Growth Sentiment Links:
NASDAQ:QQQ — reflects overall high-beta sentiment & liquidity
CBOE:ARKK — tracks innovation/growth appetite
NASDAQ:COIN — crypto-linked sentiment often spills into HOOD
NYSE:XYZ — fintech risk appetite correlation
NASDAQ:SOFI — retail-driven growth behavior overlaps with HOOD
🧲 Key Takeaways:
When growth ETFs weaken, HOOD typically accelerates momentum
Retail-heavy assets show higher reaction to volatility spikes
Watching these helps confirm whether HOOD’s breakdown has strength
✨ “If you find value in my analysis, a 👍 and 🚀 boost is much appreciated — it helps me share more setups with the community!”
Disclaimer: This is a thief-style trading strategy just for fun.

Will Verizon (VZ) Extend Higher After This Bullish Pullback?📊 VZ — Bullish Pullback Playbook | NYSE Swing Strategy 🛡️📈
🧠 Market Thesis
VZ (Verizon Communications Inc.) is showing a clean bullish pullback setup supported by:
✔️ Moving Average Pullback Confirmation
✔️ Re-Accumulation Zone Formation
✔️ Buyers regaining strength and stepping back in with momentum
Price behavior shows buyers dominating key levels, keeping the trend constructive and ready for continuation 📈💪
🎯 Entry Plan
🔓 Entry: Any valid price-level confirmation entry based on your strategy.
(Everyone has their own method — trade what fits your risk profile.)
🛑 Stop Loss
⚠️ Stop-Loss: “Thief SL” @ 39.00
(This is a personal reference point only. Not a recommendation — manage risk your way.)
🎯 Target Zone
🚓 Target: “Police force waiting at the Triangular Moving Average Barricade”
— A zone acting as strong resistance, combined with:
Overbought signals
Possible liquidity trap
Sellers waiting to react
📌 TP Level: 43.00
(Again — personal target. Trade responsibly and exit at your comfort level.)
📝 Notes to All Ladies & Gentlemen (Thief OGs)
I am not recommending you follow my SL or TP.
Your money → your rules → your trade → your responsibility 💼📌
This is a thief-style trading narrative made for fun, not financial advice.
🔎 Correlated Assets / Related Pairs to Watch
Keeping an eye on correlated telecom + defensive sector tickers strengthens conviction:
📡 $T (AT&T)
Moves similarly to VZ due to shared telecom sector flows
Similar defensive-sector inflows during risk-off periods
Can confirm or warn about momentum shifts
📶 NASDAQ:TMUS (T-Mobile)
Sometimes inversely reacts when capital rotates between telecom competitors
Relative strength comparison helps spot leadership shifts
🏦 AMEX:XLC (Communication Services ETF)
Sector ETF that often amplifies or confirms directional bias
Watching ETF flows helps validate whether buyers truly control the space
🧲 Key Correlation Notes:
Telecom sector = slow, steady movers with defensive qualities
When VZ, T, and XLC all align → trend continuation signals strengthen
Divergence between these pairs may warn early about losing momentum
🚀📈 Final Thief-Style Summary
We have a confirmed bullish pullback, re-accumulation strength, and a clear resistance barricade for TP planning.
Trade safely, protect profits, and don’t get caught by the “police” at resistance 🚓😂🔥
✨ “If you find value in my analysis, a 👍 and 🚀 boost is much appreciated — it helps me share more setups with the community!”
⚠️ Disclaimer
This is a thief style trading strategy just for fun.
Not a recommendation, not financial advice — purely educational and entertainment-oriented.
#VZ #Verizon #SwingTradeSetup #BullishPullback #TradingPlaybook #StockAnalysis #NYSE #MarketStructure #Reaccumulation #TelecomStocks #XLC #ATT #TMUS #ThiefStyleTrading #RiskManagement #ChartAnalysis #EditorsPickHunt

Breakout Trade
National Securities Depository Ltd (NSDL) provides electronic infrastructure for dematerialization of securities and facilitates electronic settlement of trades in Indian Securities Market.
NSDL forms a triple bottom breakout chart pattern on daily time frame at around 1040 price acting as strong support and is all set to give breakout at 1086 price.
Near term possible targets will be 1200 and 1400.

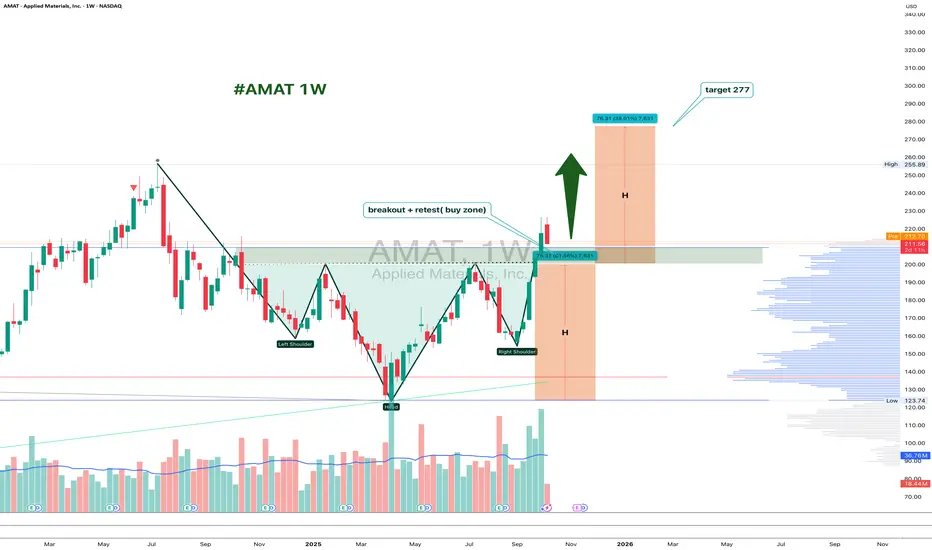
AMAT 1W: Retesting the Neckline Before the Next Move?On the weekly chart, Applied Materials (AMAT) has completed a clean inverted head and shoulders breakout around $226, and is now pulling back to retest the neckline zone near $200–211.
This area acts as strong support. If buyers defend it, the bullish pattern stays valid, with a projected target around $277, matching the 1.618 Fibonacci extension.
From a fundamental perspective, AMAT remains a key semiconductor player, benefiting from ongoing demand for chip-making equipment. The pullback looks more like a healthy pause than weakness - a classic chance for latecomers to re-enter.
Funny enough, the “head and shoulders” pattern, known for signaling tops, is doing the exact opposite here - apparently, even the market likes a good plot twist.
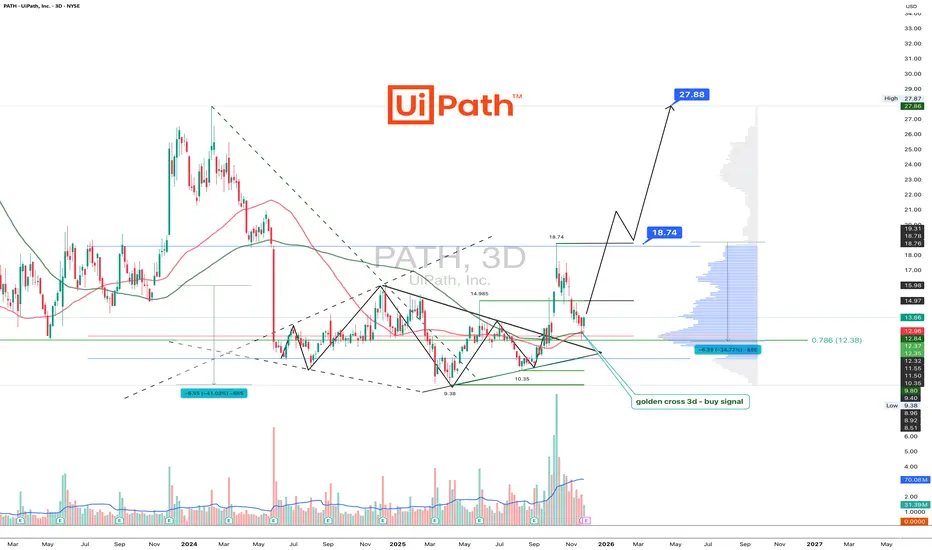
UiPath automates workflows and apparently the chart tooPATH pretends nothing happened after a perfect diamond breakout
PATH is trading at 13.86 after the diamond pattern completed a clean breakout toward 18.74 and shifted into a corrective phase. The pullback landed precisely in the Fibonacci 0.786 zone between 12.00 and 12.50 where a clear demand area formed. Buyers reacted sharply and the three day chart printed a golden cross through the MA50 crossing the MA100 which strengthens the bullish scenario.
As long as price holds above 12.00 the structure remains bullish. The next confirmation level sits at 14.97. A solid close above this zone opens the path back to 18.74 and later to the extended target at 27.88 where higher timeframe liquidity is located.
Fundamentally UiPath continues to show strength as of November 29 2025. Annual revenue exceeds 1.55 billion dollars which reflects a near 15 percent year over year increase. Gross margin stays near 83 percent indicating high operational efficiency. Cash reserves are above 1.7 billion dollars which keeps the balance sheet among the strongest in the automation sector. Customer growth remains steady across banking telecommunications and public sector clients. The transition to subscription based models continues to improve the predictability of cash flows. The main risk remains sensitivity of enterprise budgets in slow economic cycles.
The reaction to the 12.00 support confirms solid demand. Holding above this zone keeps the bullish scenario active with targets at 18.74 and 27.88. If buyers reclaim 14.97 the trend could accelerate quickly.
Automation removes friction from business processes and sometimes the chart removes friction for traders. Fibonacci and MA100 hint louder than words.
CHYM: From IPO Laggard to 2026 Leadership?Chime Financial is currently at a critical technical and fundamental inflection point, moving from a high-growth "disruptor" to a potentially profitable "mainstream" financial partner for millions of Americans. A
fter raising its 2025 revenue guidance to a range of $2.16B to $2.17B, the company has demonstrated resilient 29% year-over-year growth fuelled by its expanding Chime Card credit product and high "attach" rates among its 9.1 million active members.
The bullish narrative is further bolstered by a $200 million share repurchase program and a proprietary processing platform, ChimeCore, which has helped expand adjusted EBITDA margins to 5% as of late 2025.
Technically, as the stock clears its 200-day moving average of $25.23, it is breaking out of a textbook consolidation "Handle". With top-tier analysts like Goldman Sachs and B. Riley recently raising price targets to $30 and $35 respectively, the "Dragon's Tail" for this setup appears aimed at a return to the $40–$45 zone, representing the stock's post-IPO high-water mark.

SMR 1D: Small reactors. Big nerves.I am looking at NuScale Power without emotions. After a strong impulsive move, the price is in a deep correction phase and is now forming a base. The key focus is not old trendlines, but current market behavior. On the daily chart, RSI reached oversold levels and started to turn up, while price is no longer making aggressive new lows. This signals weakening selling pressure. Volume increased noticeably in the 16.50–18.00 zone, suggesting accumulation rather than panic selling. This is not a fast reversal, but a classic stabilization phase after a sharp sell off.
From a technical perspective, as long as this base holds, a recovery scenario remains valid. Initial upside levels are around 23.50, followed by 30.65. In a more optimistic scenario, the 42.00 area becomes relevant, but only if momentum and volume continue to confirm.
Fundamentally, NuScale remains a high risk but strategic story. The company continues to develop small modular nuclear reactors, targeting long term demand from energy infrastructure and data centers. As of late 2025, profitability is still negative, with Q4 2025 EPS estimated around −0.16 USD, which is already priced in by the market. Revenue remains modest, with near term estimates around 9 million USD, but the real value lies in government backed programs, long term energy contracts, and the strategic role of SMR technology in the energy transition. This is why the stock reacts sharply to any shift in sentiment around nuclear energy and infrastructure spending.
For me, this is not a place for excitement, but a zone to watch carefully. As long as RSI continues to recover and volume confirms demand, the base scenario stays constructive. If the base fails, the market will quickly remind us that future technologies still come with present day risks.
Nuclear energy promises stability. The SMR chart reminds us that the road there is anything but calm.

BAIDU: Bullish Breakout With 40% Upside PotentialHey Realistic Traders!
Baidu, one of China’s leading technology stocks, is starting to flash signals that point to significant upside potential. Rather than relying on hype, let’s turn to the chart and see whether the technical analysis support this bullish narrative.
Technical Analysis
On the daily timeframe, NASDAQ:BIDU has been trading consistently above the EMA200, indicating a well-established bullish trend. Within Wave 4 of this broader uptrend, Baidu formed a bullish flag pattern, a corrective structure that typically appears before trend continuation. A breakout from this pattern signals renewed bullish pressure and often marks the beginning of Wave 5 in Elliott Wave theory.
Notably, the most recent swing low has held above the upper trendline, reinforcing the bullish Wave 5 scenario. This move was further supported by a MACD bullish crossover, adding momentum confirmation. Based on this setup, we anticipate a move toward the first target at 149.50, with potential extension toward the Fibonacci projection near 181.25 , completing the bullish Wave 5. Minor pullbacks may occur along the way as part of a healthy trend progression.
This bullish wave count remains valid as long as price stays above 107.24. A move below this level would invalidate the Wave 5 structure and shift the outlook back to neutral.
Support the channel by engaging with the content, using the rocket button, and sharing your thoughts in the comments below.
Disclaimer: This analysis is for educational purposes only and should not be considered a recommendation to take a long or short position on Baidu.
