OIL outcome!OIL at a drop zone, with all that is happening in the world a big drop could happen once confirmation is given. Waiting patiently...
Stoploss

The Art of the Exit: Mastering the "Wise Cut"Hello Friends, Welcom to RK_Chaarts,
Today we are going to understand that what is The Art of the Exit: Why "Cutting Losses" is Your Most Important Skill.
Let’s be real: nobody likes losing money. It stings. But if you’re going to survive in these markets, you have to get comfortable with being wrong.
In trading, a loss is just a business expense. The goal isn’t to avoid them entirely (that’s impossible); the goal is to keep them small enough that they don't take you out of the game.
Here is how to manage your exits without losing your mind—or your account:
1. Your Stop-Loss is Non-Negotiable
Think of a stop-loss as your "insurance policy." You should know exactly where you’re getting out before you ever hit the buy button. By setting a hard exit point, you take the decision-making out of your hands when emotions are running high.
2. Stick to the Script
We’ve all been there: price hits your stop, and you think, "Maybe if I just give it a few more pips, it’ll bounce." Don't do it. That’s how a small, manageable loss turns into a portfolio-killer. Trust your plan, not your gut.
3. Lock in Gains with Trailing Stops
If a trade is moving in your favor, don’t be greedy. Use a trailing stop to follow the price up (or down). This lets you stay in the trend while ensuring that even if the market reverses, you still walk away with a profit.
4. Don't Bet the House
The "Golden Rule" is simple: never risk more than you can afford to lose on a single trade. Most pros only risk 1-2% of their account per setup. This way, even a string of five losses is just a minor setback, not a disaster.
5. Keep an Eye on the Bigger Picture
Markets don't move in a vacuum. High-impact news or economic shifts can wreck a perfectly good technical setup. Stay informed, check the calendar, and be ready to step aside if the environment gets too chaotic.
6. "Hope" is Not a Strategy
Holding onto a losing position and praying for a miracle is the fastest way to blow an account. Cut the dead weight early. There will always be another setup tomorrow. Protect your capital so you can live to trade it.
7. Pay for Your Education
Every time you take a loss, you’ve essentially paid a "tuition fee" to the market. Don't waste it. Review the trade: Did you follow your rules? Was the entry off? Use those mistakes to sharpen your edge for the next one.
The Bottom Line
Trading isn't about being right; it's about math and discipline. If you can keep your losses small and your winners big, the math will eventually work in your favor.
Stop trying to be "right" and start being "profitable."
How do you handle a losing streak? Drop a comment below 👇
I am not Sebi registered analyst.
My studies are for educational purpose only.
Please Consult your financial advisor before trading or investing.
I am not responsible for any kinds of your profits and your losses.
Most investors treat trading as a hobby because they have a full-time job doing something else.
However, If you treat trading like a business, it will pay you like a business.
If you treat like a hobby, hobbies don't pay, they cost you...!
Hope this post is helpful to community
Thanks
RK💕
Disclaimer and Risk Warning.
The analysis and discussion provided on in.tradingview.com is intended for educational purposes only and should not be relied upon for trading decisions. RK_Chaarts is not an investment adviser and the information provided here should not be taken as professional investment advice. Before buying or selling any investments, securities, or precious metals, it is recommended that you conduct your own due diligence. RK_Chaarts does not share in your profits and will not take responsibility for any losses you may incur. So Please Consult your financial advisor before trading or investing.

Market Orders vs Limit Orders: When to Use Each
The Order Type You Choose Can Make or Break Your Trade
You found the perfect setup. Perfect entry level. Perfect risk/reward.
Then you use the wrong order type and get filled $0.50 worse than expected.
On 1,000 shares, that's $500 gone - before the trade even starts.
Order types aren't boring details. They're execution edge hiding in plain sight.
Why Order Types Matter
The Hidden Cost:
Most traders focus on:
Finding good setups
Timing entries
Managing risk
But ignore:
How orders actually execute
Slippage and fill quality
Order type selection
The Impact:
Poor execution can cost 0.1-0.5% per trade.
Over hundreds of trades, this compounds into significant losses.
Basic Order Types
1. Market Order
What It Does:
Executes immediately at the best available price.
When to Use:
You need to get in/out NOW
Liquidity is high
Speed matters more than price
Risks:
Slippage in fast markets
Poor fills in illiquid assets
No price guarantee
Example:
You place market buy for 100 shares.
Current ask: $50.00
You might get filled at $50.05 or worse.
2. Limit Order
What It Does:
Executes only at your specified price or better.
When to Use:
You want a specific price
You're willing to wait
You want to avoid slippage
Risks:
May not get filled
Miss the move entirely
Partial fills possible
Example:
You place limit buy at $49.50.
If price never reaches $49.50, you don't get filled.
If it does, you get $49.50 or better.
3. Stop Order (Stop-Loss)
What It Does:
Becomes a market order when price reaches your stop level.
When to Use:
Protecting against losses
Entering on breakouts
Exiting positions automatically
Risks:
Becomes market order = slippage possible
Can be triggered by wicks
Gap risk
Example:
You own stock at $50, stop at $48.
If price hits $48, stop triggers and sells at market.
In fast market, might fill at $47.50.
4. Stop-Limit Order
What It Does:
Becomes a limit order when price reaches stop level.
When to Use:
Want stop protection with price control
Concerned about slippage
In volatile markets
Risks:
May not fill if price gaps through
Can leave you in losing position
More complex to manage
Example:
Stop at $48, limit at $47.50.
If price hits $48, limit order at $47.50 activates.
If price gaps to $47, order doesn't fill.
Advanced Order Types
5. Trailing Stop
What It Does:
Stop that moves with price to lock in profits.
Types:
Fixed dollar amount
Percentage-based
ATR-based
When to Use:
Letting winners run
Protecting accumulated profits
Trend following strategies
Example:
Buy at $50, trailing stop $2.
Price rises to $55, stop moves to $53.
Price falls to $53, stop triggers.
6. OCO (One-Cancels-Other)
What It Does:
Two orders linked - when one fills, the other cancels.
When to Use:
Setting both stop loss and take profit
Bracketing a position
Automated trade management
Example:
Long at $50.
OCO: Stop at $48, Take profit at $55.
Whichever hits first executes, other cancels.
7. Bracket Order
What It Does:
Entry order with attached stop loss and take profit.
When to Use:
Complete trade management from entry
Ensuring risk is defined
Automated exits
Example:
Buy limit $50, stop $48, target $55.
All three orders placed together.
8. Iceberg Order
What It Does:
Shows only a portion of total order size.
When to Use:
Large orders you don't want to reveal
Avoiding market impact
Institutional-style execution
Example:
Want to buy 10,000 shares.
Iceberg shows 500 at a time.
Refills as portions execute.
Order Type Selection Framework
Question 1: How urgent is this trade?
Very urgent → Market order
Can wait → Limit order
Question 2: How liquid is the asset?
Very liquid → Market order acceptable
Illiquid → Limit order essential
Question 3: What's the purpose?
Entry → Limit or stop (for breakouts)
Exit (profit) → Limit order
Exit (loss) → Stop or stop-limit
Question 4: What's the volatility?
High volatility → Stop-limit to avoid slippage
Low volatility → Regular stop acceptable
AI-Enhanced Order Execution
1. Smart Order Routing
AI determines best execution venue:
Which exchange has best price?
Where is liquidity deepest?
How to minimize market impact?
2. Algorithmic Execution
AI breaks large orders into smaller pieces:
TWAP (Time-Weighted Average Price)
VWAP (Volume-Weighted Average Price)
Implementation shortfall minimization
3. Optimal Order Type Selection
AI recommends order type based on:
Current market conditions
Asset liquidity
Order size
Urgency
4. Slippage Prediction
AI estimates expected slippage:
Based on order size
Current spread
Historical execution data
Order Type Mistakes
Always Using Market Orders - "I just want to get filled." Unnecessary slippage, especially in illiquid assets. Use limit orders when you can wait.
Stop Loss Too Tight - Placing stops where normal volatility triggers them. Stopped out by noise, not by being wrong. Use ATR-based stops.
Ignoring Gaps - Using stop orders without considering gap risk. Stop triggers but fills much worse than expected. Use stop-limits or accept gap risk in position sizing.
Chasing with Market Orders - Price moves, you chase with market order. Fill at worst price, often right before reversal. Use limit orders, accept missing some trades.
Not Using OCO/Brackets - Managing stops and targets manually. Miss exits, emotional interference. Use bracket orders for automated management.
Order Execution Checklist
Before placing any order:
What order type is appropriate?
Is the asset liquid enough for market orders?
Have I accounted for potential slippage?
Is my stop order type appropriate for volatility?
Do I have both stop and target set (OCO/bracket)?
Execution Cost Analysis
Calculate Your Execution Costs:
Slippage = Actual Fill Price - Expected Price
Execution Cost = Slippage + Commission
Per Trade Cost = Execution Cost / Position Value
Annual Impact = Per Trade Cost × Number of Trades
Example:
200 trades per year
Average 0.1% execution cost per trade
$50,000 average position
Annual cost: 200 × 0.1% × $50,000 = $10,000
That's $10,000 lost to poor execution - before any trading P&L.
Key Takeaways
Order type selection directly impacts your trading results
Market orders = speed but potential slippage; Limit orders = price control but may miss fills
Stop orders become market orders - consider stop-limits in volatile markets
Use OCO/bracket orders for automated trade management
Calculate your execution costs - they compound significantly over time
Your Turn
What order types do you use most frequently?
Have you ever been hurt by poor order execution?
Share your execution strategies below 👇

Complete Guide To Backtesting In TradingBacktesting — The Cure for Losses
Backtesting is the process of testing a trading idea on historical data before you risk real money. It’s like going back in time and asking: “If I had traded these rules before, would I have made money or not?”
Why Backtesting Matters
Separate Ideas from Illusions
Many strategies look promising at first glance. Visually — they seem solid. Emotionally — “it’s obvious this should work.” Backtesting quickly sobers you up:
Either the idea has a statistical edge,
Or it’s pure self-deception.
Understand the Math Behind the Strategy
Backtesting answers questions you can’t solve intuitively:
What’s the average profit per trade?
How many losing trades in a row are normal?
What’s the actual drawdown?
How many trades per month/year?
After a solid backtest, you stop fearing normal drawdowns — because you know the stats.
Save Money and Nerves
The market is an expensive teacher. Backtesting is free.
Every strategy untested on history is an experiment at your own expense.
Build Confidence in the System
When you have hard numbers:
You stop overreacting.
You break rules less often.
You avoid “jumping in because it felt right.”
You’re trading a process, not hope.
What You Must Understand Up Front
Backtesting does not guarantee future profits. Markets evolve — and that’s normal.
But backtesting does show:
Whether the idea had an edge.
What risks are involved.
Why trading blind is reckless.
It’s like checking your car before a trip. It doesn’t guarantee no accidents, but driving without it is just foolish.
What Exactly Do We Backtest?
We don’t test a single entry model or one indicator. We test a trading system defined by clear rules. That’s crucial — until an idea becomes a system, it can’t be objectively verified.
1. The Logic of Decision-Making
The test object is the logic behind your trades. Primarily — market context:
Why do you use this entry model here?
What in price action or market behavior gives you reason to expect movement in your favor?
Not just “RSI below 30” as a fact, but what it represents — imbalance, momentum, reaction to a level, or dislocation. If entry logic isn’t meaningful, backtesting degenerates into signal-hunting.
2. Trade Exit
This is where most of the results are shaped. We test:
Where losses are cut.
Where and how profits are taken.
Whether exits use fixed targets, logical levels, partial closes, or trailing stops.
Often the same entry, with different exit rules, produces radically different equity curves — from a robust system to a total blow-up.
3. Risk Management
Risk per trade, risk/reward ratio, the impact of losing streaks on equity — all are part of the hypothesis. A strategy may be sound, but with poor risk management it becomes unsustainable. In backtesting, we look not only at profits, but at how the system survives drawdowns.
4. Filters
When does the strategy perform best?
During certain times of day?
Under specific volatility conditions?
In trends or ranges?
Often, adding a simple filter eliminates most losing trades and dramatically improves stability.
5. Repeatability
Does the hypothesis work across different historical periods, market phases, and instruments? If it only shows results in one year — that’s not a trading system, it’s curve-fitting.
What We Do Not Test
We don’t test feelings like “this looks logical.” We don’t test pretty trades. We don’t chase a perfect equity curve without drawdowns.
Backtesting is not about confirming expectations — it’s about stress-testing them.
Key Metrics to Track
1. Win Rate (Percentage of Profitable Trades)
Win Rate is the proportion of profitable trades relative to the total number of trades over a selected period.
Formula:
Win Rate (%) = (Number of Profitable Trades / Total Number of Trades) × 100
Example:
Total trades: 120
Profitable trades: 42
Losing trades: 78
Calculation:
Win Rate = 42 / 120 × 100 = 35%
Strategy Win Rate = 35%.
What counts as a profitable trade:
A trade is considered profitable only if the final result is positive after accounting for commissions and slippage.
Trades closed at breakeven or with a small loss due to fees are not considered profitable.
A high Win Rate does not guarantee a reliable or profitable strategy.
2. Risk / Reward Ratio (R:R)
Risk / Reward (R:R) reflects the ratio between the average risk and the average potential profit per trade. It shows how much profit the strategy generates per unit of risk.
For beginners, acceptable R:R values are typically 1:2 or 1:3.
Strategy profitability is driven by asymmetry between losses and gains, not by the frequency of winning trades.
3. Expectancy
Expectancy is the average financial outcome of one trade over the long term.
It answers the key backtesting question:
Does the strategy make money on average per trade?
Basic Formula:
Expectancy = (WinRate × AvgWin) − (LossRate × AvgLoss)
Where:
WinRate — proportion of profitable trades (not in %)
LossRate = 1 − WinRate
AvgWin — average profit of winning trades
AvgLoss — average loss of losing trades (absolute value)
A positive expectancy is a mandatory condition for a viable strategy.
4. Trade Distribution by Sessions (Asia / Europe / US or Specific Hours)
Analyze trades by time to understand where performance is actually coming from.
Key questions to analyze:
Where is the majority of profit generated?
Which sessions drag overall performance down?
Where volatility is high but results are poor?
Common scenario:
Asia — negative
London — neutral
New York — generates almost all the profit
5. Time-Based Expectancy
Expectancy should be analyzed not only overall, but also:
By session
By individual hour
This is one of the strongest performance filters.
Number of Trades by Time
A time slot may appear profitable, but if it has only a few trades per year, the result is statistically insignificant.
Drawdown by Session
Sometimes a session is profitable overall, but its drawdowns during specific hours are psychologically unacceptable
6. Expectancy: Long vs Short
Very often:
Long trades produce stable and smooth results
Short trades produce sharp gains but with deep drawdowns
Or vice versa.
Win Rate by Direction
Win Rate may be similar, but:
Longs may have smaller stop losses
Shorts may experience frequent stop-outs
If expectancy in one direction is below zero, it should be:
Removed entirely, or
Strongly restricted.
Common Backtesting Mistakes
1. Look-Ahead Bias (Future Leak)
This occurs when the principle of sequential analysis is violated.
Trading decisions are made using information that would not have been available in real time.
Examples:
Analyzing fully formed highs or lows;
Using closed candles that did not exist at the moment of entry;
Adjusting entries or stop losses after seeing future price movement.
Consequences:
Significant overestimation of strategy performance;
Distorted and misleading statistics.
Correct Approach:
Move strictly from left to right on the chart;
Hide the right side of the chart;
Make decisions only based on information available at that moment.
2. Curve Fitting (Over-Optimization)
This mistake occurs when a strategy is excessively optimized for historical data by adding too many conditions and parameters.
As a result:
The strategy perfectly explains the past;
But loses its ability to work in the future.
Rule of thumb:
If a strategy cannot be explained in simple words without a chart, it is most likely over-optimized.
3. Ignoring Commissions and Slippage
In many backtests:
Entries and exits occur at “ideal” prices;
Orders are assumed to be executed instantly;
Commissions are ignored or underestimated.
Why the impact is often underestimated:
Fees seem small (0.05–0.2%);
Each individual trade appears barely affected;
The cumulative effect becomes visible only over time.
Particularly vulnerable strategies:
Scalping;
High-frequency trading;
Systems with low Risk/Reward ratios.
Such conditions do not exist in real trading.
Correct Approach:
Always include commissions on both entry and exit;
Apply conservative slippage assumptions;
Test closer to the worst-case scenario, not the best;
Use real exchange and instrument parameters.
If a strategy becomes unprofitable after accounting for commissions and slippage, it never had a real edge
4. Testing Only “Favorable” Market Conditions
This methodological error occurs when a strategy is tested only during market phases where it naturally performs best.
This creates an illusion of robustness that is not confirmed across real market cycles.
A strategy must be tested under:
Trending markets;
Ranging (sideways) markets;
Periods of high volatility;
Periods of low volatility.
It is acceptable that a strategy:
Performs well in some regimes;
Loses money or stagnates in others.
The key is understanding where and why this happens.
A strategy that works only in favorable conditions is not a trading system.
Proper backtesting must account for market variability and evaluate performance across all market regimes.
Evaluating Strategy Fit for the Trader
1. Psychological Compatibility
Assess your tolerance for:
Losing streaks;
Waiting for valid trade setups;
Holding positions over time.
2. Lifestyle Compatibility
The strategy should align with:
Available time;
Required level of concentration;
Daily work rhythm.
3. Risk Profile
A comfortable strategy:
Does not induce panic;
Does not trigger impulsive decisions;
Provides a sense of control.
4. Final Check
If you break the rules on a demo account,
you will break them even more often on a live account.
A good strategy looks:
Boring;
Clear;
Predictable
Backtesting Features and Pitfalls in TradingView
Before starting backtesting, it is important to understand certain specifics of how TradingView displays data.
If these nuances are ignored, you will almost inevitably introduce look-ahead bias and distort your test results.
Choosing a Backtest Starting Point in TradingView:
When selecting the starting point for a backtest in TradingView, there are four main tools:
Select bar — you manually choose a specific bar on the chart from which you want to start the analysis.
Select date — you set a date from which the chart will be displayed.
Select the first available date — the backtest starts from the earliest available bar (relevant if your subscription has historical data limits).
Random bar — TradingView moves you to a random location on the chart.
Personally, for the sake of experimental integrity, I most often use Random bar.
This approach helps minimize look-ahead bias and makes the backtest closer to real trading conditions.
You do not know in advance what will happen next and are forced to make decisions under uncertainty — exactly as in live markets.
A Critically Important TradingView Behavior:
There is a TradingView behavior that many traders are unaware of, yet it can severely distort backtesting results.
When switching to a higher timeframe, TradingView always shows a fully closed candle, even if in real time that candle would still be forming.
Example 1
You are on a 5-minute chart in the middle of the trading day and decide to check the daily timeframe.
TradingView will show you the final daily candle, meaning you effectively see how the day will close.
As a result, you already know the outcome of the price movement and may subconsciously adjust your decisions based on future information.
Example 2
You are analyzing order flow on a 1-hour chart and decide to look at the weekly timeframe to identify key reaction zones.
If you simply switch to the weekly chart, TradingView will display a fully formed weekly candle, including its high, low, and close.
In practice, this means you already know how the week opens and closes while still analyzing trades within that same week.
This is direct look-ahead bias, which makes the backtest invalid.
How to Avoid Look-Ahead Bias in TradingView
To ensure an honest backtest, you must scroll the chart back before switching to a higher timeframe.
This is where the Select bar tool becomes essential.
The logic is simple:
If you want to view the daily timeframe — scroll back at least one full day.
If you are analyzing the hourly timeframe — scroll back at least one full hour.
If you want to view the weekly timeframe — scroll back at least one full week.
Only after that should you switch to the higher timeframe.
In this case, you will see only the information that was actually available to the market at that moment — without spoilers and without distorted data.
Enjoy!

Exit Strategies: Entries Get Attention, Exits Make the MoneyEveryone Obsesses Over Entries. Professionals Obsess Over Exits.
Here's a trading truth that took me years to learn:
You can have a mediocre entry and still make money with a great exit.
You can have a perfect entry and lose money with a poor exit.
Exits determine your actual profit or loss. Entries just get you in the game.
Why Exits Matter More
The Entry Illusion:
Traders spend 90% of their time on entries:
Finding the perfect setup
Waiting for confirmation
Timing the exact moment
The Exit Reality:
But exits determine:
Whether a winning trade stays winning
How much you actually capture
Whether a losing trade stays small
Your overall expectancy
The Math:
A 60% win rate with poor exits can lose money.
A 40% win rate with excellent exits can make money.
It's not about being right. It's about how much you make when right and how little you lose when wrong.
Types of Exits
1. Stop Loss Exit
Predetermined price where you exit to limit loss.
Purpose: Capital preservation
Placement: Where your trade thesis is invalidated
2. Take Profit Exit
Predetermined price where you exit to capture profit.
Purpose: Lock in gains
Placement: At logical targets (resistance, measured moves)
3. Trailing Stop Exit
Stop that moves with price to lock in profits.
Purpose: Let winners run while protecting gains
Types: Fixed distance, ATR-based, percentage-based
4. Time-Based Exit
Exit after a certain time regardless of price.
Purpose: Avoid dead money, force decisions
Example: Exit if trade hasn't moved in 5 days
5. Indicator-Based Exit
Exit when indicator gives signal.
Purpose: Systematic exit based on market conditions
Example: Exit when RSI crosses below 70
6. Discretionary Exit
Exit based on judgment and market conditions.
Purpose: Adapt to changing conditions
Risk: Emotional interference
Stop Loss Strategies
Strategy 1: Technical Stop
Place stop where the trade idea is invalidated.
Examples:
Below support level
Below swing low
Below trendline
Advantage: Logical placement based on market structure
Disadvantage: Can be obvious to other traders
Strategy 2: ATR-Based Stop
Place stop at multiple of Average True Range.
Formula:
Stop = Entry - (ATR × Multiplier)
Example:
Entry: $100
ATR: $2
Multiplier: 2
Stop: $100 - ($2 × 2) = $96
Advantage: Adapts to volatility
Disadvantage: May not align with structure
Strategy 3: Percentage Stop
Place stop at fixed percentage from entry.
Example:
Entry: $100
Stop: 5% below = $95
Advantage: Simple, consistent
Disadvantage: Ignores market structure and volatility
Strategy 4: Time Stop
Exit if trade doesn't move within timeframe.
Example:
"If not profitable within 3 days, exit at market."
Advantage: Avoids dead money
Disadvantage: May exit before move happens
Take Profit Strategies
Strategy 1: Fixed Target
Predetermined price target.
Methods:
Risk multiple (2R, 3R)
Resistance level
Round number
Advantage: Clear, removes emotion
Disadvantage: May leave money on table
Strategy 2: Scaled Exit
Exit in portions at different levels.
Example:
1/3 at 1R
1/3 at 2R
1/3 trailing
Advantage: Locks in some profit, lets rest run
Disadvantage: More complex management
Strategy 3: Trailing Stop
Let profits run with moving stop.
Types:
Fixed distance trailing
ATR trailing
Moving average trailing
Swing point trailing
Advantage: Captures extended moves
Disadvantage: Gives back some profit on reversals
Strategy 4: Indicator Exit
Exit when indicator signals.
Examples:
RSI overbought
MACD crossover
Moving average cross
Advantage: Systematic, removes emotion
Disadvantage: May lag price action
AI-Enhanced Exit Strategies
1. Dynamic Stop Optimization
AI adjusts stops based on:
Current volatility
Time in trade
Profit accumulated
Market regime
2. Optimal Target Calculation
AI analyzes:
Historical move distributions
Current momentum
Resistance levels
Probability of reaching targets
3. Exit Signal Ensemble
AI combines multiple exit signals:
Technical indicators
Price action
Volume patterns
Time factors
4. Regime-Adaptive Exits
AI adjusts exit strategy based on market regime:
Trending: Wider trailing stops
Ranging: Tighter fixed targets
Volatile: Faster exits
Exit Mistakes
Moving Stop Loss Away — "I'll give it more room" = hoping, not trading. Set stop before entry, never move it further away.
Taking Profits Too Early — Fear of giving back gains leads to cutting winners short. Use trailing stops to let winners run.
No Exit Plan — Entering without knowing where you'll exit. Define all exits BEFORE entering.
Emotional Exits — Exiting based on fear or greed, not plan. Automate exits or use strict rules.
Same Exit for All Trades — Using identical exit regardless of setup or conditions. Match exit strategy to trade type and market conditions.
Exit Planning Framework
Before Every Trade, Define:
1. Initial Stop Loss
Where is the trade idea wrong?
What's the maximum acceptable loss?
2. Primary Target
Where is the logical profit target?
What's the risk:reward ratio?
3. Trailing Strategy
How will you protect profits?
When does trailing begin?
4. Time Limit
How long will you hold?
When do you exit regardless of price?
5. Invalidation Conditions
What would change your thesis?
When do you exit early?
Exit Scenarios
Scenario 1: Trade Goes Your Way
Move stop to breakeven after 1R
Trail stop as price advances
Take partial profits at targets
Let remainder run with trail
Scenario 2: Trade Goes Against You
Stop loss hits = exit immediately
No hoping, no averaging down
Accept the loss, move on
Scenario 3: Trade Goes Nowhere
Time stop triggers
Exit to free up capital
Reassess if setup is still valid
Scenario 4: Conditions Change
Original thesis no longer valid
Exit regardless of profit/loss
Don't hold for wrong reasons
Key Takeaways
Exits determine actual profit/loss — entries just get you in the game
Define all exits BEFORE entering any trade
Never move stop loss further away — only closer
Use trailing stops to let winners run while protecting gains
Match exit strategy to trade type and market conditions
Your Turn
What's your biggest challenge with exits?
Do you tend to exit too early or hold too long?
Share your exit strategies below 👇

Hypothetical "StopLoss Hunt" Game Theory.A smart man said " place your buy positions where you would place your Stoplosses ".
Could be interpreted in "If there are (technical) RISKS... then it's almost a guarantee the worst case scenario will materialize ". Because of liquidity.
I thought about this and could differentiate these situations as:
--(Downtrend) crowd influenced. (Say: deathcross.. with risks to break the Higher Low).
--(Uptrend) Euphoric, extended trend. With strong longterm fundamentals and positive future cycle. It would benefit smart money to break this trend and buy everyones shares for cheaper -> when markets are supposed to be slow and they have got all the time in the world.
--(Uptrend) Institutional FOMO. Game theory, 70%+ managers underperform the index, on strong trend every dip is the last price you get.
//Stop Loss Hunt
//Institutional Fomo.

Why We Should Plan Logical Stop-LossThis video explains why using a logical stop-loss is important in trading and how stop-loss placement should be based on market structure rather than emotions. The discussion focuses on understanding where price invalidates an idea, how illogical stop placement increases risk, and why logical stop-loss levels help

Why Institutions Trap Retail TraderThis video explains why institutions trap retail traders for liquidity by analyzing common price behavior around key levels. The discussion focuses on how liquidity builds near obvious highs and lows, why false breakouts and sudden reversals occur, and how institutional participation can create traps through market structure and order flow behavior.
The objective of this video is to build awareness around liquidity-driven moves and help understand market mechanics from an educational perspective, without offering any trading or investment recommendations.

Emotional Patterns: What Your Trades Reveal About YouTrading feels technical on the surface, yet the deeper layer is psychological. Charts highlight opportunities, but the way you behave inside those opportunities shapes the outcome. Each trade reflects how you respond to pressure, uncertainty, and risk. Over time, these reactions create emotional patterns that influence results more than strategy.
One early pattern appears after a loss. A losing trade often triggers frustration, and that frustration pushes traders into fast entries aimed at regaining control. The decision becomes driven by emotion rather than process, and this behaviour can quickly lead to a cycle of overtrading.
Winning streaks create a different pattern. Confidence expands, and many traders begin increasing size, loosening rules, or entering before confirmation because recent success feels reassuring. This overextension usually leads to sharp setbacks when the market shifts.
Another frequent pattern is hesitation. Traders with inconsistent execution tend to freeze at key moments. They wait for additional confirmation, delay entries, or watch clean setups move without them. The pause often comes from the memory of previous mistakes rather than a lack of technical understanding.
Entries reflect trust in the system. Exits reflect trust in personal decision-making. Closing a trade too early often shows discomfort with open profit. Holding a losing trade too long often comes from discomfort with accepting a loss. These behaviours reveal the trader’s relationship with risk far more clearly than any written reflection. The chart becomes a mirror.
Recognising emotional patterns provides clarity. When recurring behaviours appear—chasing, hesitating, forcing trades, avoiding losses—they become easier to interrupt. Once a pattern is visible, it starts losing influence.
Structure then supports the change: rules, checklists, routines, and clear confirmation criteria. These elements stabilise execution and reduce the impact of emotional impulses.
A strategy defines potential entries, but emotional patterns determine whether the trader can execute consistently enough to benefit from it. Awareness strengthens decision-making. When you understand what your trades reveal about your behaviour, you can adjust it and bring execution closer to intention.
This is where consistency begins.

How to Use ATR in TradingViewMaster ATR using TradingView's powerful charting tools in this step-by-step tutorial from Optimus Futures.
ATR, or Average True Range, is a volatility indicator that helps traders measure market movement, set appropriate stop losses, and adjust position sizing based on current market conditions.
What You'll Learn:
Understanding ATR as a volatility measurement tool that tracks price movement regardless of direction
How ATR calculates the average range between highs and lows over a specified period — typically 14
Why rising ATR signals increasing volatility and larger price swings
Why falling ATR indicates decreasing volatility and quieter market conditions
Using ATR to set dynamic stop losses that adjust to current volatility rather than arbitrary dollar amounts
How to calculate stop distances by multiplying ATR by factors like 2x or 3x
Applying ATR for position sizing to maintain consistent risk across different volatility environments
Setting profit targets based on ATR multiples to align with actual market movement
Filtering trade setups using ATR levels to avoid low-volatility periods or confirm breakout momentum
How to add ATR on TradingView via the Indicators menu
Understanding the default 14-period setting and how shorter or longer periods affect responsiveness
Practical examples using the E-mini S&P 500 futures chart
Applying ATR across daily, weekly, and intraday timeframes for risk management and trade planning
This tutorial is designed for futures traders, swing traders, and risk-focused analysts who want to integrate volatility-based risk management into their trading approach.
The methods discussed may help you set smarter stops, size positions appropriately, and adapt your trading strategy to changing market conditions across multiple markets and timeframes.
Learn more about futures trading with TradingView: optimusfutures.com
Disclaimer
There is a substantial risk of loss in futures trading. Past performance is not indicative of future results. Please trade only with risk capital.
We are not responsible for any third-party links, comments, or content shared on TradingView. Any opinions, links, or messages posted by users on TradingView do not represent our views or recommendations.
Please exercise your own judgment and due diligence when engaging with any external content or user commentary.
This video represents the opinion of Optimus Futures and is intended for educational purposes only. Chart interpretations are presented solely to illustrate objective technical concepts and should not be viewed as predictive of future market behavior.
In our opinion, charts are analytical tools, not forecasting instruments.

Stop Loss: Feelings vs. Statistics (Why Fixed SL Fails)Most traders set their Stop Loss based on feelings: "I’ll put my stop below this wick" or "I always risk 50 points."
The problem? The market doesn't care about your 50 points.
The market has a natural heartbeat called Volatility. If you use static rules (fixed pips) in a dynamic market, you are gambling, not trading. Today, we replace "feelings" with Statistics using the Average True Range (ATR).
1. The Statistical Reality
Market volatility expands and contracts.
In low volatility: A 50-point move is a trend change.
In high volatility: A 50-point move is just "noise" (random fluctuation).
If your Stop Loss is placed inside the "Noise Zone," you will get stopped out even if your direction was correct. You are paying the market a fee for being too tight.
2. The Solution: The ATR Bands
The Average True Range (ATR) measures the average size of the last 14 candles. It calculates the "noise."
Instead of a fixed number, your Stop Loss should be dynamic. The Rule: A statistical stop loss should be outside the current noise—usually 2x the ATR.
3. The Tool in pinescript example
I have written a simple script for you. It draws a "Noise Channel" around the price.
If price is inside the gray zone: It is just noise.
If price breaks outside the band: The trend is statistically significant.
Open your Pine Editor and paste this in : ( before you paste the code to your pine editor keep the first line which is the version 6 then delete everything and past this code )
indicator("Kodologic: ATR Noise Bands", overlay=true)
// 1. Input for Sensitivity
multiplier = input.float(2.0, title="ATR Multiplier (Stop Distance)")
length = input.int(14, title="ATR Period")
// 2. Calculate the 'Heartbeat' (Volatility)
atrValue = ta.atr(length)
// 3. Define the Upper and Lower Statistical Bands
upperBand = close + (atrValue * multiplier)
lowerBand = close - (atrValue * multiplier)
// 4. Plotting
// The Gray Zone represents 'Market Noise'.
// A safe Stop Loss usually belongs OUTSIDE this zone.
p1 = plot(upperBand, color=color.new(color.red, 50), title="Statistical Short Stop")
p2 = plot(lowerBand, color=color.new(color.green, 50), title="Statistical Long Stop")
fill(p1, p2, color=color.new(color.gray, 90), title="Noise Zone")
4. The "Secret" to Consistency
When you switch to ATR stops, your Stop Loss distance will vary. Sometimes it will be wide, sometimes tight.
"But what if the ATR stop is too far away for my account?"
Do not tighten the stop. Lower your position size.
Amateurs try to force the market to fit their account size.
Pros adjust their position size to fit the market's reality.
Trade the data, not the hope.
I am building a series on how to move from subjective trading to objective, data-driven strategies using Pine Script. Follow for the next update.

USDJPY - H1 | UpdateSl hit. GBPJPY broke the diagonal resistance and successfully closed above 203.200 which could signal further bullish momentum heading all the way up to 204.5xx in the mid - short term.

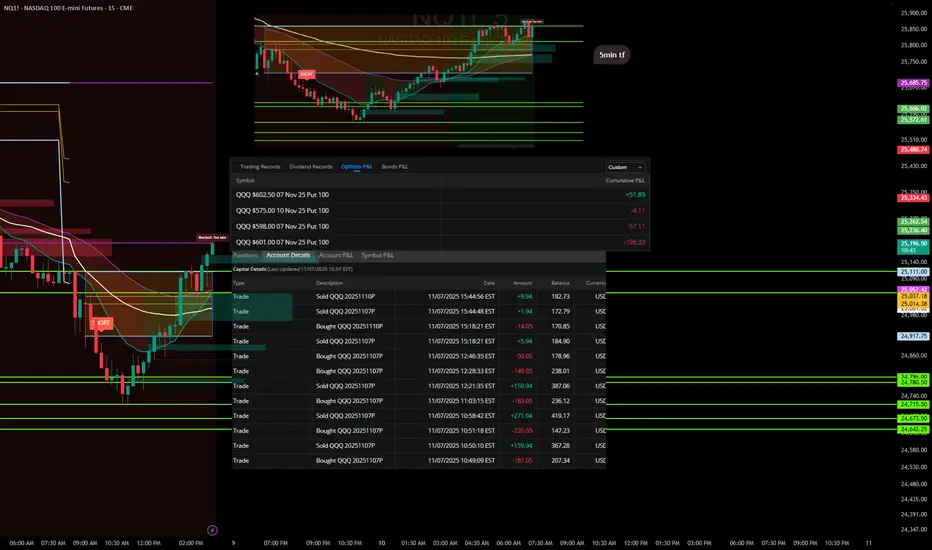
Trades with B – Daily Recap (Nov 7, 2025) "Lesson Learned"Ticker: QQQ / NQ1!
Strategy: ORB Pro + Fib Confluence + EMA Trend Filters
Result: Small red day – self-inflicted
🧭 Market Context
Today’s price action gave a clear short opportunity during the mid-morning fade, but momentum stalled mid-session. The first entries lined up beautifully with the ORB breakdown and EMA confluence, offering solid profits early on.
Where it fell apart was after the first wins — I overstayed, chasing secondary flushes that never came. The market started to base, and I kept expecting continuation instead of taking what the chart gave me.
📉 Trade Summary
Multiple put entries between $601–$602 levels
Early trades locked quick gains (+$271.94, +$159.94)
Gave back a chunk re-entering late into chop
Final P/L across contracts: -$205.66 total
Cumulative Options P/L breakdown:
QQQ $602.50 07 Nov 25 Put – +$51.89
QQQ $575 10 Nov 25 Put – -$4.11
QQQ $598 07 Nov 25 Put – -$57.11
QQQ $601 07 Nov 25 Put – -$196.33
💡 Lessons & Takeaways
The first clean move is often the best move. Don’t overcomplicate a confirmed win.
Late-day trades = low probability. Volume dries up, conviction fades.
Protect the capital, not the ego. There’s no “making up” missed points — only protecting what’s already earned.
🧘♂️ Reflection
“The setup worked, but I didn’t. I tried to extract more from a move that was already complete. Next time, once my target hits, I’m walking away.”
Liquidity Zones Explained: Where Smart Money GoesMarkets don’t move randomly. Every candle, spike, or reversal happens for a reason and that reason is liquidity.
Liquidity is what fuels price movement. It’s where buy and sell orders are concentrated, and where large players execute positions without showing their hand.
Understanding where liquidity lies gives traders a major advantage, because price doesn’t move to levels by accident. It moves there to fill orders.
Liquidity represents the pool of resting orders waiting to be filled — stop losses, pending buys, or sells.
When price reaches these areas, volume spikes, and the market finds enough counterparties for large players to enter or exit positions.
Liquidity isn’t just numbers on the book. It’s the invisible map of trader behavior:
– Stops above highs (where breakout traders get trapped)
– Stops below lows (where panic selling occurs)
– Consolidation zones (where both sides accumulate orders)
These areas become magnets for price movement.
When you see sharp wicks above or below key levels, it’s often not manipulation — it’s collection.
Smart money drives price into these zones to trigger stop losses and capture liquidity before reversing in the true direction.
The move looks random, but it’s calculated.
The goal is to fill large positions efficiently, using retail orders as exit liquidity.
Instead of chasing price, learn to wait for liquidity grabs.
The simplest method is to mark obvious highs and lows and observe how price reacts when those levels are taken.
If price breaks a key high but fails to continue — and momentum shifts back down — it’s often a sign of a liquidity sweep, not a breakout.
These moments reveal where the real players are positioning themselves.
Trading liquidity is about reaction, not prediction.
Liquidity zones reveal where traders are trapped and where professionals engage.
If you stop focusing on where price is and start paying attention to why it moves there, you’ll see the market with far more clarity.

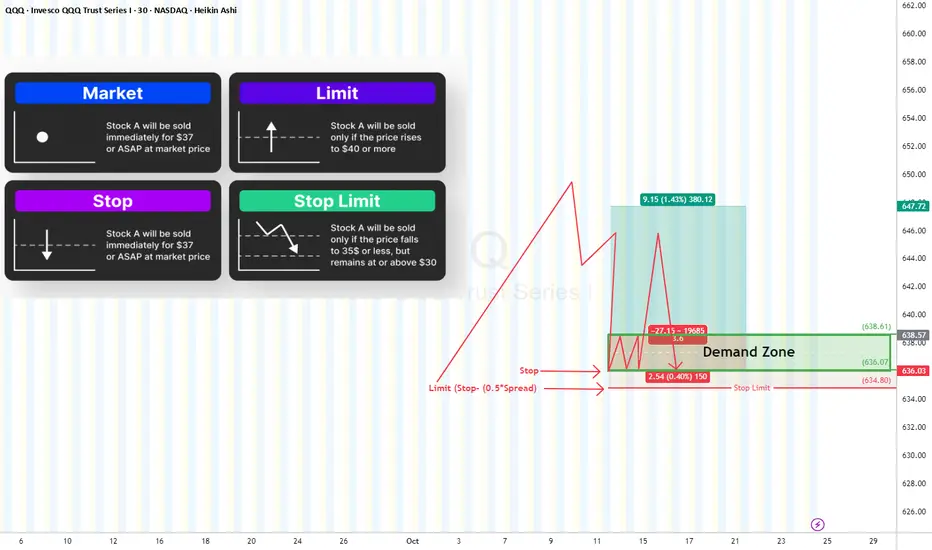
Why My Stop Loss Didn’t Trigger?”🛑 “Why My Stop Loss Didn’t Trigger?”
Let’s talk about Stop Orders, Stop Limits, Spreads, and the Outside-RTH trap.
Before we blame the broker, it’s crucial to understand how each order type actually works:
🔹 Market Order
Executes immediately at the best available price.
✅ Guarantees execution
⚠️ Doesn’t guarantee price (can slip during volatility).
🔹 Limit Order
Executes only at your specified price or better.
✅ Price control
⚠️ Might never fill if market doesn’t reach your limit or gap down.
🔹 Stop Order (Is a Stop “Market” Order)
Activates when price hits your stop level, then converts into a market order.
✅ Great for stop-loss protection
⚠️ May fill at much lower price than your stop due to slippage.
🔹 Stop Limit Order
Activates at the stop trigger, then becomes a limit order — meaning it only executes if the market trades at your limit price or better.
✅ Full control over fill price
⚠️ Risk of not executing at all if price moves away quickly.
Regular Trading Hours (RTH):
Market orders are supported → Stop Market
Outside RTH (Pre/Post-market):
Market orders are not supported therefore, only Stop Limit works.
Now, Why Your Stop Might Not Trigger?
1- You used a Stop-Limit (not Stop Market)
If the market gaps beyond your limit, there’s no fill (Buyer) at this price.
Price “touched” your stop — but never traded through your limit price.
2- You traded Outside RTH
During pre-market or after-hours, If you didn’t enable “Outside RTH” trading, your stop simply didn’t activate.
3- Thin Liquidity
Low volume = fewer buyers/sellers near your stop → delayed or partial fills.
This is especially true Outside RTH, where spreads widen and depth disappears. Or you are trading an equity or ETFs with slim volume (check the volume first before trading any asset)
✅ Recommendation:
Use Stop-Limit + “Allow Outside RTH+GTC” and make your limit “marketable” to ensure execution.
Offset guide for Stop-Limits (Δ):
• At least 0.5× spread
• Or ¼ to ½ ATR(5) for your timeframe
Example for a long position:
• You bought at $100, want to exit if it breaks $99.80.
• Pre-market spread = $0.12
• Set: Stop = 99.80, Limit = 99.68 (≈0.12 below stop)
→ Gives room for spread expansion and slippage so the stop fills quickly.
How to Set a Reliable Stop-Limit
Market Order Type Settings Notes
Equities & ETFS (RTH) Stop Market Standard stop Fastest execution
Equities & ETFS (Outside RTH) Stop Limit + GTC Limit offset = Spread Needed for after-hours fills
Futures / FX / Crypto Stop Market 24h trading Market fills OK
The Best Setup
✅ Inside RTH → Stop Market (guaranteed execution)
✅ Outside RTH → Stop Limit + GTC enabled with marketable offset
✅ Always give buffer beyond supply/demand levels (0.1–0.3%)
✅ Watch spread and volume before placing stops
Final Takeaway
Your stop loss isn’t just a line on the chart — it’s an engineered safety net.
Use the right order type for the session, give it breathing room, and understand how spread, liquidity, and RTH rules impact execution.
Because a stop loss that doesn’t trigger… isn’t a stop loss at all. 🛑
Position Sizing and Risk ManagementThere are multiple ways to approach position sizing. The most suitable method depends on the trader’s objectives, timeframe, and account structure. For example, a long-term investor managing a portfolio will operate differently than a short-term trader running a high-frequency system. This chapter will not attempt to cover all possible methods, but will focus on the framework most relevant to the active trader.
Equalized Risk
The most practical method for position sizing is known as equalized risk per trade. This model ensures that each trade risks the same monetary amount, regardless of the stop loss distance. The position size will be calculated based on the distance between the entry price and the stop loss, which means a closer stop equals more size, where a wider stop equals less size. This allows for a more structured and consistent risk control across various events.
Position Size = Dollar Risk / (Entry Price − Stop Price)
Position Size = Dollar Risk / (Entry Price × Stop in %)
For example, an account size of $100,000 and risk amount of 1% will be equivalent to $1,000. In the scenario of a $100 stock price, the table below provides a visual representation of how the position size adapts to different stop loss placements, to maintain an equalized risk per trade. This process can be integrated into order execution on some trading platforms.
The amount risked per trade should be based on a fixed percentage of the current account size. As the account grows, the dollar amount risked increases, allowing for compounding. If the account shrinks, the dollar risk decreases, which helps reduce the impact of continued losses. This approach smooths out the effect of random sequences. A percentage-based model limits downside exposure while preserving upside potential.
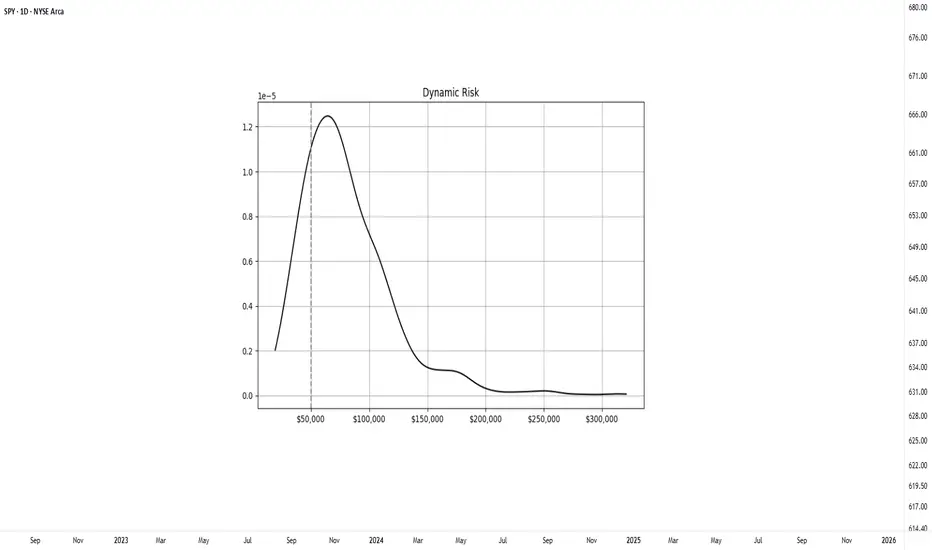
To better illustrate how position sizing affects long-term outcomes, a controlled simulation was conducted. The experiment modeled a system with a 50% win rate and a 1.1 to 1 average reward-to-risk ratio. Starting with a $50,000 account, the system executed 500 trades across 1000 separate runs. Two position sizing methods were compared: a fixed dollar risk of $1000 per trade and a dynamic model risking 2% of the current account balance.
Fixed-Risk Model
In the fixed-risk model, position size remained constant throughout the simulation. The final outcomes formed a relatively tight, symmetrical distribution centered around the expected value, which corresponds to consistent variance.
Dynamic-Risk Model
The dynamic-risk model produced a wider and more skewed distribution. Profitable runs experienced accelerated increase through compounding, while losing runs saw smaller drawdowns due to self-limiting trade size. Although dynamic risk introduces greater dispersion in final outcomes, it allows scalable growth over time. This compounding effect is what makes a dynamic model effective for achieving exponential returns.
A common question is what percentage to use. A range between 1–3% of the account is generally considered reasonable. Too much risk per trade can quickly become destructive, consider that even profitable systems may experience a streak of losses. For instance, a series of five consecutive losses at 10% risk per trade would cut the account by roughly 41%, requiring over a 70% return to recover. In case catastrophic events occur; large position sizing makes them irreversible. However, keeping position size and risk too small can make the entire effort unproductive. There is no such thing as a free trade, meaningful reward requires exposure to risk.
Risk Definition and Stop Placement
Risk in trading represents uncertainty in both the direction and magnitude of outcomes. It can be thought of as the potential result of an event, multiplied by the likelihood of that event occurring. This concept can be formulated as:
Risk = Outcome × Probability of Outcome
This challenges a common assumption that using a closer stop placement equals reduced risk. This is a common misconception. A tighter stop increases the chance of being triggered by normal price fluctuations, which can result in a higher frequency of losses even when the trade idea is valid.
Wide stop placements reduce the likelihood of premature exit, but they also require price to travel further to reach the target, which can slow down the trade and distort the reward-to-risk profile. An effective stop should reflect the volatility of the instrument while remaining consistent with the structure of the setup. A practical guideline is to place stops within 1–3 times the ATR, which allows room for price movement without compromising the reward-risk profile.
When a stop is defined, the distance from entry to stop becomes the risk unit, commonly referred to as R. A target placed at the same distance above the entry is considered 1R, while a target twice as far is 2R, and so on. Thinking in terms of R-multiples standardizes evaluation across different instruments and account sizes. It also helps track expectancy, maintain consistency, and compare trading performance.
In summary, risk is best understood as uncertainty, where the outcome is shaped by both the possible result and the probability of it occurring. The preferred approach for the active trader is equalized risk per trade, where a consistent percentage of the account, typically 1–3%, is risked on each position regardless of the stop distance. This allows the account to develop through compounding. It also reinforces the importance of thinking in terms of sample size. Individual trades are random, but consistent risk control allows statistical edge to develop over time.
Practical Application
To simplify this process, the Risk Module has been developed. The indicator provides a visual reference for position sizing, stop placement, and target definition directly on the chart. It calculates equalized risk per trade and helps maintain consistent exposure.
Diamond Vault Setup: 5 Fundamental + 7 Technical Stacks in Full OANDA:USDCHF USDCHF — Diamond Vault Setup: 5 Fundamental + 7 Technical Stacks in Full Alignment
The USDCHF setup stands out as a Diamond Vault trade — where both Fundamental and Technical confluence align with precision.
We are stacked with the Big 5 Fundamentals: softening US inflation, dovish Fed commentary, firm Swiss GDP resilience, stabilizing risk sentiment, and ongoing safe-haven flows into the Franc.
On the Technical side, all 7 stacks are in play — price trading below every EMA, RSI under 45, a clearly negative MACD, and an ADX above 25 with strong −DI dominance, confirming sustained bearish pressure.
This alignment represents a rare high-probability setup where macro and momentum are synchronized.
A break below 0.79 could open the door toward 0.7750 with confirmation from continued divergence across momentum oscillators.
⚠️ Reminder: Even with full confluence, proper money management is key.
Position sizing should respect your ATR-based risk model — Stop Loss = 1.52×ATR, Take Profit = 2.6×Risk minimum.
Protect capital first, profits second.
Bias: 🔻 Extremely Bearish
Classification: 🟩 Diamond Vault (5 Fundamentals + 7 Technicals)
ADX: 17.39 (rising) | −DI dominance: confirmed
suggest SL 0.8033 TP 0.7748

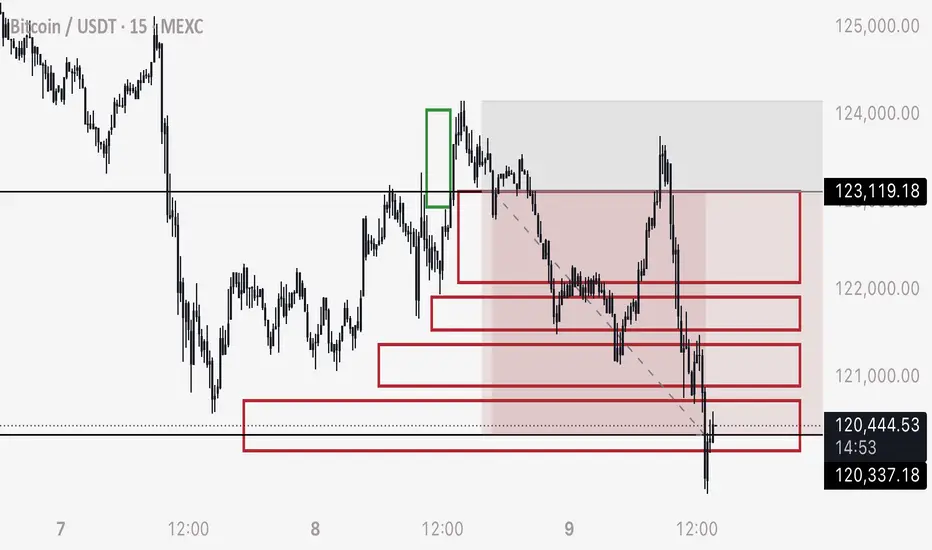
Result - Using Order Blocks to Predict Bitcoins MovementHere is the result from our first practical demonstration of the effectiveness of using order blocks (stop loss orders) and liquidity analysis to predict price movement on BTC.
Both the upwards movement and downward moment was able to be predicted with absolute accuracy.
I hope this result serves as proof for my thesis:
What moves Bitcoin is Stop Loss and Liquidation orders, which can be analyzed by looking back at open candles and length of consolidation to predict speed.
And
There is no market manipulation other than price being CONTROLLED to attract positions to be opened and consequently stop loss orders. Fast, sudden movements are a natural phenomenon caused by traders stop losses triggering into one another. Traders manipulate themselves.
I have applied this to two more examples on the higher time frames. And as those complete they will be reviewed.
PLEASE SEE ORIGINAL IDEA LINKED BELOW AS WELL AS OTHER PLANS AND IDEAS RELATED.
Any questions please comment below.
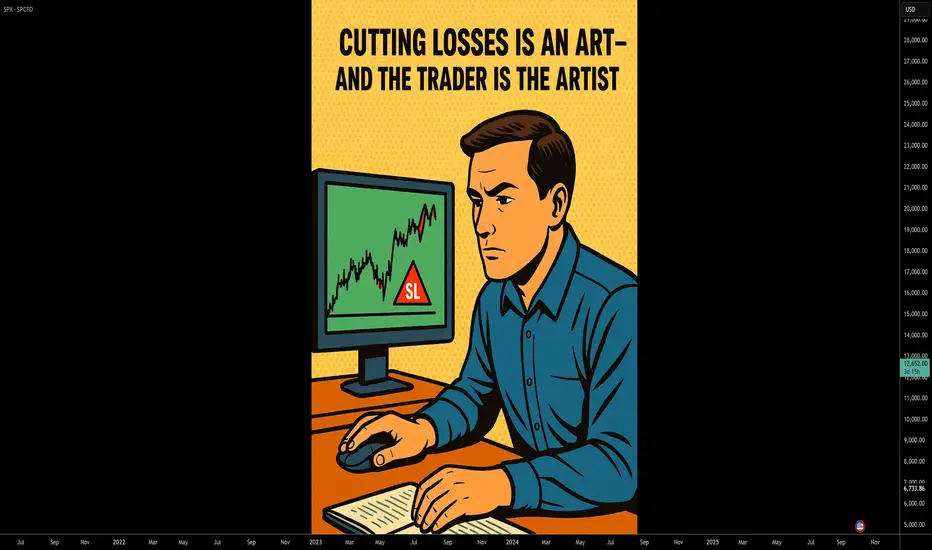
Cutting Losses is an Art – and the Trader is the Artist.🎨 Cutting Losses is an Art – and the Trader is the Artist.
Why Traders Struggle with Losses
In theory: cut your losses early, let your winners run.
In practice? It's an art – forged through discipline, experience, and the battle within.
Many enter the market quickly, full of hope, with no plan or risk awareness.
One wrong click – and they rely on luck instead of a system.
Anyone who trades without a setup or stop-loss isn't playing the game –
they're gambling.
Stop-Loss Isn’t Just Technical – It’s a Mirror of Your Discipline
It should be placed where your idea is objectively invalidated,
not where it just "feels okay."
Why is that so hard?
Because money is emotional
Because losses feel like personal failure
Because the market teaches you with pain if you don’t learn
🧠 “You should consider the money gone the moment you enter a trade.”
That’s not cynicism – it’s psychological armor.
If the trade fails, your self-worth and peace of mind remain intact.
That’s how you protect your mental capital and stay in the game – in trading and in life.
Technical Control + Psychological Honesty = Survival
Ask yourself:
Where is my personal pain threshold?
When do my hands start to sweat?
What is “a lot of money” – to me, objectively and emotionally?
Can I lose without falling apart emotionally?
Because the market will test you.
📉 It will test your ego.
💸 It will take without giving – if you're not prepared.
⏳ Patience is your sharpest weapon.
⚔️ And your greatest enemy? Greed, fear, hope.
A Pro Cuts Losses Mechanically – Not Emotionally
Every trade is just a try – with risk, with expectation, but no guarantee.
In the end, it’s not about how often you win –
it’s about how little you lose when you’re wrong.
📊 Chart Examples: Real-World Loss Management in Action
✅ Disciplined Exit
Clean stop-loss executed as planned. No hesitation, no hope.
“My setup was invalidated. The loss was expected, sized correctly, and accepted.”
❌ Emotional Hold
Ignored the stop-loss, hoping for a reversal.
“I hoped instead of acted. This was costly and unnecessary.”
⚖️ Clean Loss Despite Perfect Setup
All rules followed – but still hit the stop.
“Good trade, bad outcome. Still the right decision. Long-term edge remains.”
💬 How do YOU handle losses? Share your thoughts in the comments below.
🔔 Follow me for more on trading psychology, risk management & real chart breakdowns.
Stop Losses: The Good, The Bad and The UglyLet’s be honest — few things trigger more emotion in trading than a stop loss being hit.
But not all stop losses are created equal.
Even though the title says “The Good, the Bad, and the Ugly”, let’s start with the Bad — because that’s where most traders get stuck.
________________________________________
🚫 The Bad Stop Loss
The bad stop loss is the arbitrary one.
You know the type:
“I trade with a 50-pip stop loss.”
“My stop is always 1% below entry.”
No matter what the chart looks like.
No matter what the volatility of the asset is.
No matter if you’re trading Gold, EurUsd, or Nasdaq.
This kind of stop loss doesn’t respect market structure or context — it’s just a random number.
You might get lucky a few times, but over the long run, it’s a losing game.
If your stop loss doesn’t make sense on the chart, then it doesn’t make sense in the market either.
There’s no nuance here — it’s bad, period.
________________________________________
✅ The Good Stop Loss
The good stop loss is strategic.
It’s placed based on structure, volatility, and logic — not habit or emotion.
You define it after you’ve studied:
• Where invalidation occurs on your idea
• The volatility range of the asset
• The natural “breathing room” of the market
When this kind of stop loss is hit, it’s not a tragedy.
It’s information.
It means your prediction was wrong.
You expected the market to go up, but it went down — simple as that.
No panic. No revenge trading.
You step away, clear your mind, and wait until the next day.
Then, you redo your analysis without bias.
If the new structure confirms that the market has truly flipped direction — then, and only then, you can trade the opposite way.
That’s professionalism.
That’s how you stay consistent.
________________________________________
😬 The Ugly Stop Loss
Now, this one hurts.
The ugly stop loss is the good stop loss that gets hit… and then the market reverses immediately.
You were right — but your stop was just a little too tight.
That’s the emotional pain every trader knows.
But here’s the key:
This situation only counts as ugly if your original stop loss was good — meaning, logical and based on structure.
If it was arbitrary, then it’s not ugly — it’s just bad.
So, what do we do when a good stop loss turns ugly?
We do exactly the same thing:
• Wait until the next day.
• Reanalyze the chart with fresh eyes.
• If the setup is still valid, re-enter in the original direction.
It’s rare for both the first and second stop to be “hunted.”
Patience gives you clarity — and clarity gives you edge.
________________________________________
💭 Final Thoughts
Stop losses aren’t just a risk tool — they’re a psychological mirror.
They reveal whether you trade with emotion or with structure.
The bad stop loss shows a lack of respect for the market.
The good stop loss shows discipline and logic.
The ugly one shows that even good decisions can lead to short-term pain.
But pain is not failure — it’s feedback.
So the next time your stop gets hit, don’t see it as punishment.
See it as a test of your ability to stay rational when the market challenges you.
Because in the long run, consistency doesn’t come from winning every trade.
It comes from handling the losing ones correctly. ⚖️

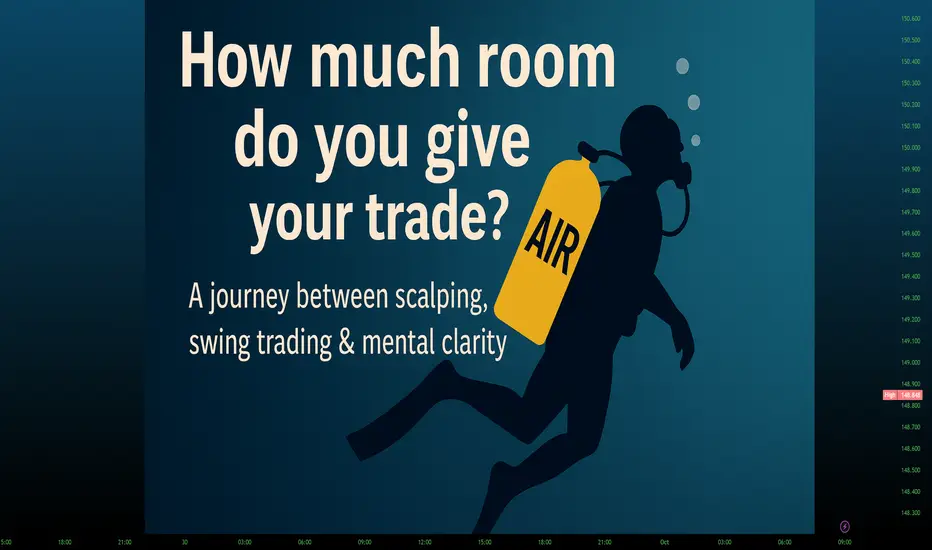
Hedging, Scalping & Swingtrading – was passt zu dir?🧠 How much air do you give your trade?
A journey between scalping, swing trading & mental clarity
📝 Summary
Scalper → tight SL, little room, many stop-outs
Swing trader → wide SL, more room, more patience
Hedging → tool, not a substitute for discipline
In the end → your rules & mindset decides
1. The core question
👉 How much air do you give your trade?
Tight Stop-Loss (SL) → tool of the scalper
✔️ Quick execution, defined risk
❌ High chance of being stopped out by small moves
Wide SL → typical for swing traders
✔️ More breathing room, more time for observation
❌ Higher emotional & financial cost
It’s about more than numbers – it’s about your nerves, your setup understanding & your rulebook.
🎯 Hedging & trend structure
Not every trade needs to be forced – sometimes securing is smarter than hoping.
👉 I use hedges, but only within a precise plan.
📌 Rule: I only hedge when pullbacks within the trend structure are likely.
➡️ No hedging against every pullback
➡️ No knee-jerk actions
➡️ Only with plan & confirmation
❌ Back and forth – pockets empty.
(Note: Hedging is optional – more complex than a stop, but a powerful tool for experienced traders.)
🧱 Trend structure is everything
Swing traders look for setups with fundamental and technical confirmation.
Example: USDJPY during times of large interest rate differentials:
📊 Rate advantage → long trades earn positive swaps
💡 Strategy: Swing trade + passive income through swaps
🔹 The scalper chases the move
🔹 The swing trader plans his income
💼 The mindset difference
A hedge is not retreat, but tactical protection, when:
The market ranges
Pullbacks are likely
R:R no longer fits
🔥 But: a hedge also ties up capital – it must be integrated wisely.
2. My journey
👉 Trading is not gambling – it’s a profession.
At first, I searched for the “holy grail”. Soon I realized:
➡️ Profit doesn’t come from clickbait gurus – but from discipline + your own rules.
Just like in the gold rush: it wasn’t the seekers who got rich – but the shovel sellers.
3. The “stingy” trader
Many traders set their SL so tight the market can’t breathe.
❌ Result: lots of small losses, frustration, overtrading.
✔️ Advantage: fast loss-cuts.
📌 BUT:
How often has the market “breathed out” your money, even though your setup was still intact?
4. The swing trader
Swing trading = building a house:
🏡 Plot = foundation
🧱 House = setup
💰 Sale = take profit
Based on highs/lows, order blocks & Fibonacci levels.
➡️ SLs must fit structure – not emotion.
5. The mental side
Tight SL → doesn’t kill your account, but your head.
Wide SL → doesn’t kill your head, but maybe your account.
👉 Losing streaks with tight SLs trigger revenge trading & self-doubt.
➡️ Find your way to avoid chasing illusions in small timeframes.
6. The middle way
🌓 It’s never black or white – it’s balance.
Practical tools:
⟳ ATR-Stops (adapt to volatility)
⚖️ Fixed risk limits (1–2% per trade)
🧠 SL = airbag, not enemy
7. Lose consciously
❌ Repeating mistakes = poison.
❗ Fear of new setups = time for a break.
🔀 Return with a clear head – your rules are your shield.
🔚 Conclusion
Scalper → tight SL, little room, many trades
Swing trader → wide SL, more room, fewer trades
⚠️ Danger comes when your SL doesn’t fit your strategy, timeframe & position size.
👉 In the end, it’s not the market that decides –
but your rules and your mindset.
“The market always breathes – the only question is whether your SL breathes with it or kicks you out.”
THE PROFESSIONAL GUIDE TO STOP LOSS PLACEMENT
🎯Introduction: Why Stop Loss Placement Separates Winners from Losers
Stop loss placement isn't just about limiting losses—it's the cornerstone of professional trading that determines your long-term survival in the markets. 📊 Amateur traders place stops randomly, while professionals use systematic, logic-based approaches that maximize profitability while minimizing risk.
🧠 The Psychology Behind Stop Loss Placement
😰 Common Emotional Mistakes
Fear-Based Placement: Setting stops too tight due to loss aversion
Greed-Driven Risks: Placing stops too wide hoping for larger profits
Hope Trading: Moving stops against you when price approaches
Revenge Trading: Removing stops entirely after being stopped out
💪 The Professional Mindset
✅ Acceptance: Losses are part of the business, not personal failures
✅ Systematic Approach: Every stop placement follows predetermined rules
✅ Risk-First Thinking: Position size determined by stop distance, not gut feeling
✅ Mechanical Execution: Emotions don't influence stop placement decisions
📏 Technical Stop Loss Placement Methods
1️⃣ 🏗️ Support & Resistance Based Stops
🔴 For Long Positions:
Place stops 5-10 pips below significant support levels
Account for spread and potential stop hunting
Use previous swing lows as reference points
🟢 For Short Positions:
Place stops 5-10 pips above significant resistance levels
Consider psychological round numbers as additional resistance
Previous swing highs become your stop reference
💡 Pro Tip: Never place stops exactly at round numbers (1.3000, 1.2500) - institutions hunt these levels aggressively! 🎯
2️⃣ 📊 Volatility-Based Stop Placement
📈 Average True Range (ATR) Method:
Conservative: 1.5 x ATR from entry point
Moderate: 2.0 x ATR from entry point
Aggressive: 1.0 x ATR from entry point
Example Calculation:
EUR/USD Entry: 1.0950
ATR(14): 0.0080
Conservative Stop: 1.0950 - (1.5 × 0.0080) = 1.0830
🌊 Bollinger Band Stops:
Long positions: Stop below lower Bollinger Band
Short positions: Stop above upper Bollinger Band
Accounts for current market volatility automatically
3️⃣ 🕯️ Candlestick Pattern Stops
🔥 Reversal Pattern Stops:
Hammer/Doji: Stop below the low of the pattern candle
Engulfing Patterns: Stop beyond the high/low of the engulfed candle
Pin Bars: Stop 5-10 pips beyond the pin bar's tail
📊 Continuation Pattern Stops:
Flags/Pennants: Stop beyond the pattern's boundary
Triangles: Stop outside the triangle's trendline
Wedges: Stop beyond the wedge's support/resistance
4️⃣ 🎯 Percentage-Based Stops
💰 Fixed Percentage Method:
Risk 1-2% of trading capital per trade
Calculate stop distance: (Account Balance × Risk%) ÷ Position Size
Automatically adjusts for different position sizes
⚖️ Risk-Reward Ratio Stops:
Determine target profit level first
Set stop to achieve desired R:R ratio (1:2, 1:3, etc.)
Ensures consistent risk management across all trades
🏛️ Institutional Stop Hunting: Protecting Yourself
🎣 How Big Players Hunt Stops
Liquidity Sweeps: Brief moves to trigger stops before reversal
Round Number Targeting: Stops at 00, 50 levels get hunted first
Obvious Level Hunting: Support/resistance levels where retail places stops
🛡️ Anti-Hunting Strategies
✅ Buffer Zones: Add 5-20 pip buffers beyond obvious levels
✅ Time-Based Stops: Exit if setup doesn't work within X hours
✅ Hidden Stops: Use mental stops instead of placing orders
✅ Multiple Timeframe Confirmation: Ensure stop makes sense on higher TF
⏰ Time-Based Stop Management
📅 Session-Based Stops
Asian Session: Tighter stops due to lower volatility
London Session: Moderate stops accounting for increased movement
New York Session: Wider stops during high-impact news
Overlap Periods: Most volatile - use wider protective stops
🕐 Time Decay Stops
Trade Setup Rules:
- If profitable within 2 hours: Move to breakeven
- If neutral after 4 hours: Consider exit
- If losing after 6 hours: Evaluate stop adjustment
- Maximum hold time: 24 hours for day trades
💎 Advanced Stop Loss Techniques
🌊 Trailing Stops Mastery
📈 ATR Trailing Stop:
Long Position Trailing Logic:
New Stop = Highest High since Entry - (2 × Current ATR)
Only move stop higher, never lower
🔄 Percentage Trailing:
Trail stop by 50% of favorable movement
Example: 40 pip profit = move stop 20 pips in your favor
🎯 Partial Position Management
🏗️ Scale-Out Strategy:
Close 50% at 1:1 R:R, move stop to breakeven
Close 25% at 2:1 R:R, trail remaining position
Let final 25% run with trailing stop
📊 Risk Management Integration
💰 Position Sizing Formula
Position Size = (Account Risk Amount) ÷ (Entry Price - Stop Price)
Example:
Account: $10,000
Risk per trade: 2% = $200
Entry: 1.0950
Stop: 1.0900
Pip Value: $10/pip (1 standard lot)
Position Size = $200 ÷ (50 pips × $10) = 0.4 lots
📈 Portfolio Heat Management
Maximum Risk: Never risk more than 6-8% across all open positions
Correlation Awareness: Reduce position sizes for correlated pairs
Drawdown Limits: Reduce risk after 3 consecutive losses
🚨 Common Stop Loss Mistakes to Avoid
❌ The "Set and Forget" Trap
Market conditions change - stops should adapt
News events can invalidate technical levels
Always monitor price action around your stops
❌ The "Moving Stop Against You" Disease
Never move stops to give losing trades more room
This single mistake destroys more accounts than anything else
If your stop is hit, accept it and analyze what went wrong
❌ The "No Stop Loss" Gamble
"I'll watch the screen" is not a strategy
Computer crashes, internet fails, emotions take over
Professional traders ALWAYS use protective stops
🎯 Putting It All Together: A Professional Framework
📋 Pre-Trade Checklist
✅ Stop level identified using multiple methods
✅ Position size calculated based on stop distance
✅ Risk-reward ratio meets minimum 1:2 criteria
✅ Stop placement accounts for market volatility
✅ Buffer added for potential stop hunting
🔄 In-Trade Management
✅ Monitor price action around stop level
✅ Move to breakeven when appropriate
✅ Trail stops on profitable positions
✅ Stick to predetermined exit rules
📊 Post-Trade Analysis
✅ Was stop placement optimal for the setup?
✅ Did market volatility match expectations?
✅ Any signs of stop hunting activity?
✅ How can stop placement be improved next time?
🏆 Conclusion: Your Path to Professional Stop Placement
Mastering stop loss placement isn't about finding the "perfect" level—it's about developing consistent, logical approaches that protect your capital while allowing profitable trades to flourish. 🌟
Remember: The best stop loss is the one that keeps you in the game long enough to become profitable. Every professional trader has been stopped out thousands of times, but they survived because they never risked more than they could afford to lose.
🎯 Your mission: Start implementing these professional techniques today. Your future profitable self will thank you for building these crucial risk management habits now!
💡 Pro Tip: Print this guide and keep it near your trading setup. Reference it before every trade until proper stop placement becomes second nature. The markets will always be there tomorrow—make sure you are too! 🚀

Exit Psychology 1/5 : The Initial StopNOTE – This is a post on Mindset and emotion. It is NOT a Trade idea or strategy designed to make you money. If anything, I’m taking the time here to post as an effort to help you preserve your capital, energy and will so that you are able to execute your own trading system as best you can from a place of calm, patience and confidence.
This 5-part series on the psychology of exits is inspired by TradingView’s recent post “The Stop-Loss Dilemma.” Link to the original post at the end of this article.
Here’s a scenario:
You set a clean initial stop beneath structure. Price drives down, tags just above it, hesitates… Your chest tightens. Thoughts race: “It’s just noise… give it room.” You widen it. Minutes later you’re out with a larger loss, shaken confidence and a strong urge to make it back.
How behaviour shows up with initial/safety stops:
When discomfort builds, many traders start negotiating with themselves. This often leads to small adjustments that feel harmless in the moment, but gradually undermine the original plan:
Widening the stop as price approaches (turning limited risk into larger or open-ended risk).
Nudging to break-even too soon (seeking relief more than edge).
Cancelling the hard stop and promising a “mental stop” (self-negotiation begins).
When traders choose not to place hard stops:
Not every trader chooses to place a hard stop in the market. For some, it’s a deliberate decision, part of their style:
They want to avoid being caught in stop-hunts around key levels.
They prefer to manage risk manually, based on discretion and market feel.
They use options, hedges, or smaller size as protection instead of stops.
They accept gap/slippage risk as part of their style.
These can all be valid approaches. But avoiding a fixed stop doesn’t remove the psychological pressures it simply shifts them:
Discipline under stress : Without an automatic exit, you rely entirely on your ability to act quickly and decisively in real time. Stress can delay action.
Mental drift : A “mental stop” is easy to move when pressure builds. The more you rationalize, the further you drift from your plan.
Cognitive load : Constant monitoring and decision-making can create fatigue and reduce clarity.
Risk of paralysis : In fast markets, hesitation or second-guessing can lead to missed exits or larger losses.
What’s really underneath (the psychology-layer):
So why do these patterns repeat, regardless of style? It’s rarely about the chart itself. It’s about how the human mind responds to risk and uncertainty:
Loss aversion : Losses hurt ~2x more than equivalent gains feel good which leads to an impulse to delay the loss (widen/erase stop).
Regret aversion : After a few “wick-outs,” the mind protects against future regret by avoiding hard stops or going break-even too early.
Ego/identity fusion : “Being wrong” feels like I am wrong and then to protect self-image one moves the line.
Illusion of control : Tweaking the stop restores a feeling of agency, even if it reduces expectancy.
Sunk-cost & escalation : More time/analysis invested makes it that much harder to cut.
Time inconsistency : You planned rationally; you execute emotionally in the moment (state shift under stress).
Physiology : Stress narrows perception (tunnel vision, shallow breath, tight jaw), pushing short-term relief behaviors over long-term edge.
Reframe:
The initial stop isn’t a judgment on you. It’s a premeditated boundary that keeps one trade from becoming a career event. It’s not about being right; it’s about staying solvent long enough to let your edge express itself.
Practical tips … the How:
Turning insight into action requires structure. A few ways to anchor the stop as your ally, not your enemy:
Pre-commit in writing : “If price prints X, I’m out. No edits.” Put it on the chart before entry.
Size from the stop, not the other way around : Position size = Risk per trade / Stop distance. If the size feels scary, the size is wrong, not the stop. Do not risk what you can not afford on any one trade / series of trades.
Use bracket/OCO orders to reduce in-the-moment negotiation. If you insist on mental stops, pair them with a disaster hard stop far away for tail risk.
Tag the behaviour : In your journal, checkbox: “Did I move/delete the stop? Y/N.” Review weekly; if you track the behaviour consciously you will be more likely to respect your stops.
Counter-regret protocol : After a stop-out, don’t chase a re-entry for 15 minutes. Breathe, review plan, then act.
For those that choose not to place stops in the market, but use mental stops instead, I’d offer the following thoughts to help manage the shift from automation to discipline.
Define exit conditions before entry (levels, signals, timeframes) and write them down.
Pair mental stops with “disaster stops” in the system, far enough away to only trigger in extreme cases.
Size positions conservatively so you can tolerate wider swings without emotional hijack.
Use check-ins (timers, alerts) to prevent emotional drift during the trade.
Build routines that reduce decision fatigue so you can act clearly when the market turns.
Closing thought:
A stop isn’t a punishment; it’s tuition. Pay small, learn quickly and keep your psychological capital intact for the next high-quality decision. One of my favourite sayings told to me by a trader many years ago stands true even to this day. Respect your capital and ‘live to trade another day’.
This is Part 1 of the Exit Psychology series .
👉 Follow and stay tuned for Part 2: The Break-Even Stop - Comfort or Illusion?
A link to the original article as promised:
