STR/BTC Beginning to looks bullishGreen FIbonacci retracement from past recent lowest point on weekly chart
Yellow Fibonacci retracement from recent high and recent low on daily chart
White Fibonacci retracement from recent low and recent high on 1 & 4 hour chart
- MACD selling pressure cannot manage to continue for a while and creating a lower low instead since may 2019.
- EMA lines begin to converging with each other with a possible golden cross in near future..
- CMF is creeping upward into bullish territores..
- yellow line represent possible movement within ascending triangle, surely if the price could bouncing around 0.236 and 0.386 yellow fib for a long time could create a bullish flag if still bullish in near future.
right now it's testing 200 EMA line as a support in 4 hour.. if candle closes above 1900(50EMA in daily) is very bullish trends await.
please take this idea as a grain of salt as reality always differ from what i expect as this post merely just an opinion.
and please feel free to share what your thought on comment section.
peace.
STR

XLM (Stellar)(Binance) Bull Run is started = PUMPXLMUSD (Binance) Bull Run is started.
- Looks like this summer will be very hot!
- Trend lines from past interact well with current local Trend bottom.
- Next challenge to maximum price.
Someone said that Stellar coin (Like Phoenix future coin) of Rothschild and the future, but you can play on the price increase and Pump.
- BTC Dominance is down (we have long target)
Target 1 = $0.29 (+87.10%)
Target 2 = $0.41 (+164.52%)
Target 3 = $1.00 (+545.16%)

There is a trading opportunity to buy in STRUSDTechnical analysis:
. Stellar/Dollar is in a range bound and the beginning of uptrend is expected.
. The price is below the 21-Day WEMA which acts as a dynamic resistance.
. The RSI is at 46.
. While the RSI downtrend and the price downtrend in the daily chart are not broken, bearish wave in price would continue.
Trading suggestion:
. There is a possibility of temporary retracement to suggested support zone (0.09934000 to 0.08942000). if so, traders can set orders based on Price Action and expect to reach short-term targets.
Beginning of entry zone (0.09934000)
Ending of entry zone (0.08942000)
Entry signal:
Signal to enter the market occurs when the price comes to " Buy zone " then forms one of the reversal patterns, whether " Bullish Engulfing ", " Hammer " or " Valley " in other words,
NO entry signal when the price comes to the zone BUT after any of the reversal patterns is formed in the zone.
To learn more about " Entry signal " and the special version of our " Price Action " strategy FOLLOW our lessons:
Take Profits:
TP1= @ 0.11930000
TP2= @ 0.13400000
TP3= @ 0.14770000
TP4= @ 0.17342000
TP5= @ 0.18912000
TP6= @ 0.20730000
TP7= @ 0.23610000
TP8= @ 0.28670000
TP9= @ 0.33745000
TP10= Free

Stellar Lumens Ready For a 10X!!!Welcome back!
Today I wanted to go over stellar lumens because I see massive profit potential coming very soon.
This was a coin I already made lots of money on back in the last cycle and I see the EXACT same set up happening right now.
DONT MISS OUT!
This idea will give you an in depth analysis on XLM and what I see happening in this cycle moving forward.
Based on Market Cycles I have successfully traded this pattern sequence for serious profits.
This sequence has 3 parts that I call, "Blow Off Top, Accumulation Distribution, and Final Sell Off."
Many top alts follow this pattern which is why I expect them to make us serious returns moving forward.
Let's dive right in and show you what I mean!

XLM/BTC potential plunge downward??doesnt looking good for Stellar/btc as the btc keep rallying/btc dominance rising..
broke a longterm trendline is a bad sign for str/btc ..
though the indicator is flashing a good buy. in term of past support/resistance..
Stellar didnt have much support nearby.. the nearest support saddly around 1500 satoshi..
but we will see what happen...

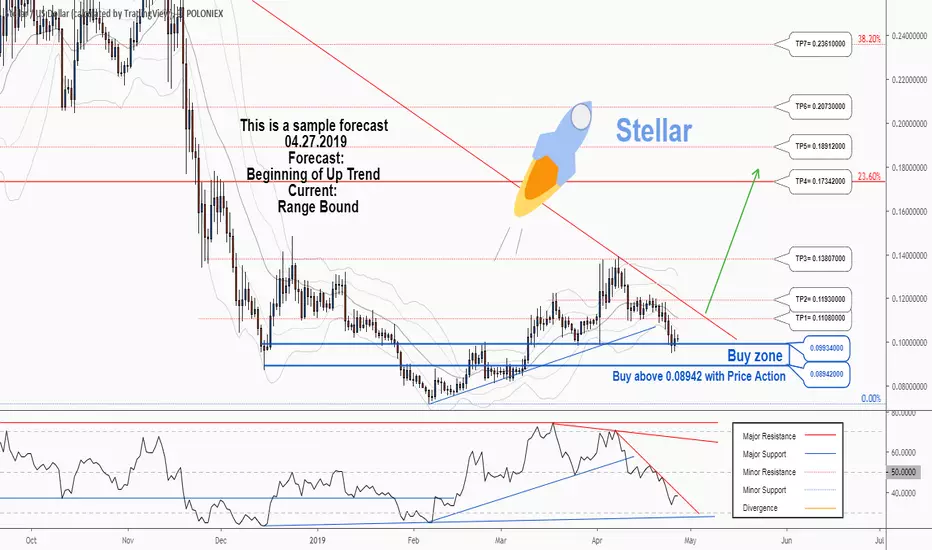
There is a possibility for the beginning of an uptrend in STRUSDTechnical analysis:
. STELLAR/DOLLAR is in a range bound and the beginning of uptrend is expected.
. The price is below the 21-Day WEMA which acts as a dynamic resistance.
. The RSI is at 38.
. While the RSI downtrend and the price downtrend in the daily chart are not broken, bearish wave in price would continue.
Trading suggestion:
. There is a possibility of temporary retracement to suggested support zone (0.09934000 to 0.08942000). if so, traders can set orders based on Price Action and expect to reach short-term targets.
Beginning of entry zone (0.09934000)
Ending of entry zone (0.08942000)
Entry signal:
Signal to enter the market occurs when the price comes to " Buy zone " then forms one of the reversal patterns, whether " Bullish Engulfing ", " Hammer " or " Valley " in other words,
NO entry signal when the price comes to the zone BUT after any of the reversal patterns is formed in the zone.
To learn more about " Entry signal " and the special version of our " Price Action " strategy FOLLOW our lessons:
Take Profits:
TP1= @ 0.11080000
TP2= @ 0.11930000
TP3= @ 0.13807000
TP4= @ 0.17342000
TP5= @ 0.18912000
TP6= @ 0.20730000
TP7= @ 0.23610000
TP8= @ 0.28670000
TP9= @ 0.33745000
TP10= Free

A trading opportunity to buy in STRUSDTechnical analysis:
. STELLAR/DOLLAR is in a range bound and the beginning of uptrend is expected.
. The price is above the 21-Day WEMA which acts as a dynamic support.
. The RSI is at 69.
Trading suggestion:
. There is a possibility of temporary retracement to suggested support zone (0.11789000 to 0.09560000). if so, traders can set orders based on Price Action and expect to reach short-term targets.
Beginning of entry zone (0.11789000)
Ending of entry zone (0.09560000)
Entry signal:
Signal to enter the market occurs when the price comes to " Buy zone " then forms one of the reversal patterns, whether " Bullish Engulfing ", " Hammer " or " Valley " in other words, NO entry signal when the price comes to the zone BUT after any of reversal patterns is formed in the zone. To learn more about " Entry signal " and the special version of our " Price Action " strategy FOLLOW our lessons :
Take Profits:
TP1= @ 0.14580000
TP2= @ 0.17342000
TP3= @ 0.18912000
TP4= @ 0.20730000
TP5= @ 0.23601000
TP6= @ 0.25526000
TP7= @ 0.28668000
TP8= @ 0.33745000
TP9= @ 0.40960000
TP10= @ 0.50150000
TP11= Free

A trading opportunity to buy in STRUSDTechnical analysis:
. STELLAR/DOLLAR is in a range bound and the beginning of uptrend is expected.
. The price is above the 21-Day WEMA which acts as a dynamic support.
. The RSI is at 69.
Trading suggestion:
. There is a possibility of temporary retracement to suggested support zone (0.11789000 to 0.09560000). if so, traders can set orders based on Price Action and expect to reach short-term targets.
Beginning of entry zone (0.11789000)
Ending of entry zone (0.09560000)
Entry signal:
Signal to enter the market occurs when the price comes to " Buy zone " then forms one of the reversal patterns, whether " Bullish Engulfing ", " Hammer " or " Valley " in other words,
NO entry signal when the price comes to the zone BUT after any of the reversal patterns is formed in the zone.
To learn more about " Entry signal " and the special version of our " Price Action " strategy FOLLOW our lessons:
Take Profits:
TP1= @ 0.14580000
TP2= @ 0.17342000
TP3= @ 0.18912000
TP4= @ 0.20730000
TP5= @ 0.23601000
TP6= @ 0.25526000
TP7= @ 0.28668000
TP8= @ 0.33745000
TP9= @ 0.40960000
TP10= @ 0.50150000
TP11= Free


XRP Will Likely Remain Neutral Until July (Elliott Wave)Based on the long-term Neely-Elliott Wave count, we are likely in the middle of wave-D. Time targets for the end of wave-D are =(b+c)/2, which puts us right at July, same time target that we have for BTC.
Based on the three day chart, it appears that we've completed wave-B of what is probably a triangle, and we should get a wave-C that will take us to at least 0.24, after wave-C we will have likely hit the bottom and then we'll make a higher low for wave-E and after that point which should happen in july, we'll begin a violent wave up.
For now, it's best to remain neutral on XRP until July. At that point, if the triangle has formed like expected, or if we see another completed standard pattern, then we can aggressively enter the market. Also because there are several possibilities here on the three day, we can be pretty confident that we're in the middle of a pattern, rather than the end of a pattern, so it's unlikely that we see a long-term trend change until we see the possibilities being reduced down to one. For the next few months price action will probably be extremely choppy to shake out as many traders as possible before the next bull run.


There is a trading opportunity to buy in STRBTCTechnical analysis:
. STELLAR/BITCOIN is in a range bound and the beginning of uptrend is expected.
. The price is below the 21-Day WEMA which acts as a dynamic resistance.
. The RSI is at 40.
Trading suggestion:
. There is a possibility of temporary retracement to suggested support zone (0.00002925 to 0.00002800). if so, traders can set orders based on Price Action and expect to reach short-term targets.
Beginning of entry zone (0.00002925)
Ending of entry zone (0.00002800)
Entry signal:
Signal to enter the market occurs when the price comes to " Buy zone " then forms one of the reversal patterns, whether " Bullish Engulfing ", " Hammer " or " Valley " in other words,
NO entry signal when the price comes to the zone BUT after any of the reversal patterns is formed in the zone.
To learn more about " Entry signal " and the special version of our " Price Action " strategy FOLLOW our lessons:
Take Profits:
TP1= @ 0.00003120
TP2= @ 0.00003190
TP3= @ 0.00003320
TP4= @ 0.00003480
TP5= @ 0.00003720
TP6= @ 0.00003950
TP7= @ 0.00004290
TP8= @ 0.00004720
TP9= @ 0.00004970
TP10= @ 0.00005700
TP11= Free

A trading opportunity to buy in STRBTCTechnical analysis:
. STELLAR/BITCOIN is in a downtrend and the beginning of uptrend is expected.
. The price is below the 21-Day WEMA which acts as a dynamic resistance.
. The RSI is at 31.
Trading suggestion:
. There is a possibility of temporary retracement to suggested support zone (0.00002990 to 0.00002840). if so, traders can set orders based on Price Action and expect to reach short-term targets.
Beginning of entry zone (0.00002990)
Ending of entry zone (0.00002840)
Entry signal:
Signal to enter the market occurs when the price comes to " Buy zone " then forms one of the reversal patterns, whether " Bullish Engulfing ", " Hammer " or " Valley " in other words,
NO entry signal when the price comes to the zone BUT after any of the reversal patterns is formed in the zone.
To learn more about " Entry signal " and the special version of our " Price Action " strategy FOLLOW our lessons:
Take Profits:
TP1= @ 0.00003190
TP2= @ 0.00003320
TP3= @ 0.00003480
TP4= @ 0.00003720
TP5= @ 0.00003950
TP6= @ 0.00004290
TP7= @ 0.00004720
TP8= @ 0.00004970
TP9= @ 0.00005700
TP10= Free

STELLAR [XLMBTC] Looks ready for another Failed Rally!Hello, PLEASE SUPPORT CHART WITH LIKES AND COMMENTS ;)
This thing called Stellar LUMEN (XLM, STR) well known project with huge community and support. It has a HardFork at 9 December (from another dev-team)
But what behind all of this?
-Whales and big money, inside traders and people related to the project...
SO how to benefit from it for regular traders and investors?
-You need to know simple market models, market sentiments and to be cold minded person
Today i want to share with you simple market model called Wyckoff Distribution.
It appears in different timeframes, and located at the tops.
Check this schematics:
i0.wp.com
So, looks like we are going into failed rally stage, so be careful with your portfolio, I suggest to avoid such risky trades like XLM (STR)
Good luck

Stellar Lumens (XLM) corrective phase (STR/USDT at Poloniex)From a technical perspective stellar needs to correct like almost all other altcoins. But be very cautious in these times. Mother BTC and upcoming news can always influence the price behavior and with the rumors XLM being listed at Coinbase and a active fork coming at 9th of December it's good to have a stoploss in place.
ENTRY
I've put the entry signal at 13,46 cents AFTER a clean break and a hook to form first. Only when that is formed correctly place your bets.
STOP-LOSS
Stoploss is at 15,73 cents.
Every time a target is reached we move our stop to the previous target.
TARGETS
The targets are:
T1 Target 1 is the 11,37 cents (USDT) ZONE and is based on the .88 retrace with confirmation of extended fibs.
T2 Target 2 is 8,17 cents (USDT) and is based on a major support zone with confirmation of extended fibs.
T3 Target 3 is around 5 cents (USDT) and is based on a major support zone with confirmation of extended fibs. This zone is hit by many of the alts and is known as a reset zone.
Please let me know what you guys think.


STR Stellar Capability & Prospect SUPERSTR or Stellar analysis show that STR is on stable price despite from BTC bearish downfall. For overall 2018 STR recorded a lowest price at 0.17. Compared to current price the last recorded lowest price for November is around 0.19 during BTC downfall. This has encourage holders & investors to pay more attention to STR as we know its been on a grey area from time to time. Even though this coins are gaining some popularity recently; there's always an early ICO investors that has turn STR into liquid gold during early Jan 2018.
Lets get to TA , Icloud shown there is 50:50 ratio for STR to be bullish, on contradictory RSI seems to favors towards bullish due to oversold recently. MACD indicated a 50:50 ratio similar to Icloud. I think STR going to consolidate for a time before reaching a new conclusion. Resistance keep getting lower behave similar like BTC but the difference is on support lowest price STR which increased gradually from 0.15,0.17, 0.18 and latest 0.19.
Personally its a good time for STR Entry due to high ratio of profit against risk. The potential is significantly shown averagely around 60-70% upwards.

Stellar (XLM): A look at basic TA on a daily timeframeXLM on the daily looks a little bearish now.
RSI starting to drop, MACD momentum is evening out and I expect a crossing over in the few days. The first red candle has appeared since October 1st.
Unless we see a big rally I can see us slipping further down as outlined in my last analysis.

For anyone shorting XLM now, be carefulI have closed my previous trade
at 4140. RSI on the hourly plus a look at previous consolodation period was my reasoning behind this. If you continue to short XLM it may make sense but I am just making this update to show what I am doing. Do you agree or disagree? Let me know
Have fun trading out there and be careful.

Short Term Forecast not good for XLM (Stellar)RSI suggests XLM was overbought. I have entered a shirt at 4400 and I expect to close at the 4100 mark where we may see a short revival.
Targets are as follows:
1: 4100
2: 4000
3: 3800
From 3800-3900 I will be entering a long again.
Disclaimer: This is not trading advice, just what I plan on doing.
