AUDJPY - Bullish Continuation | HTF Cycle ResetFrom a higher-timeframe perspective, AUDJPY remains structurally bullish, with clear higher highs and higher lows printed on the chart. Momentum candles show strong participation and volume, confirming institutional interest during expansion.
Zooming out to the cycle:
• Price formed a tight accumulation range
• Expansion followed, validating bullish intent
• We are now seeing distribution pull price back into prior accumulation
This pullback is constructive, not bearish. It’s part of the re-accumulation process.
As price works lower, I’m allowing bears to print lower-high fragments into our key POI — the orange HTF order block. That behavior is what builds a higher low, setting the stage for continuation.
Once price reaches the POI, I’ll be waiting for a lower-timeframe shift in market character / structure to realign with bullish momentum and target midterm and HTF highs.
Until then — patience is key.
Tracking remains the edge. Let the cycle complete.
Let’s go.
Structure

GBPUSD - Bullish Continuation | HTF Cycle in PlayPrice remains bullish from a higher-timeframe perspective, and I’m attending a continuation scenario.
We saw price take inducement and engineer liquidity, followed by a break in external structure, which then delivered price directly into our HTF order block of interest beneath the sweep.
What actually unfolded here was a complete macro cycle:
• Price accumulated bullish momentum within a clear accumulation range
• Expansion followed, confirming smart money intent
• Price then transitioned into distribution
• From distribution, we observed manipulation back into prior accumulation territory
This pullback is not weakness — it’s repositioning.
From here, I’m tracking the microcycle completion (re-accumulation → confirmation → expansion) to extend delivery in the bullish direction.
Until that cycle fully confirms, patience is key.
No chasing. No forcing. Tracking is the edge.
Letting smart money do what it does best — deliver.
Let’s go.

19.01.26 Daily ForecastPairs on Watch -
FX:EURUSD
FX:USDCAD
FX:NZDJPY
TVC:USOIL
A short overview of the instruments I am looking at for today, multi-timeframe analysis down to what I will be looking at for an entry. Enjoy!

AUDCAD- Daily Bird's- Eye View | Tracking PhaseFrom the daily bird’s-eye perspective, I’m waiting for distribution back into mid-term accumulation. The focus is on how price behaves once it reaches those levels — specifically whether they hold and produce a clear change in character.
Until that confirmation appears, there’s no urgency to engage. This is a tracking phase, not an execution phase.
➡️ HTF context: Daily overview
➡️ Area of interest: Mid-term accumulation
➡️ Confirmation: Change in character
➡️ Edge: Patience and tracking
Patience is key. Tracking is the edge.

USDCAD- HTF Continuation | Tracking PhaseSeeking continuation on the higher-timeframe leg as price expands. On the minor framework, price is collecting sell-side liquidity (SSL) and rotating into a minor accumulation zone.
Once mitigation is complete, I’ll be looking for a lower-timeframe structure shift back into HTF alignment before considering execution. Until that confirmation shows, there’s no rush — the focus is on tracking behavior, not forcing entries.
➡️ HTF bias: Continuation
➡️ Minor context: SSL draw → accumulation
➡️ Execution: After mitigation + LTF shift
➡️ Edge: Tracking, not anticipation
Patience is key. Tracking is the edge. Let’s go.

USDCHF - Post Mid- Term Shift | Advanced Bullish ModelFollowing the flow after a mid-term structure shift. The lower high was breached, confirming a change in intent, and an advanced bullish model is now in play.
This is a high-difficulty environment (5⭐), so execution is secondary to alignment. I’m focused on how price reacts around key levels as we continue through the delivery cycle.
No forcing, no chasing — just letting structure and behavior guide the next decision.
➡️ Context: Mid-term shift confirmed
➡️ Trigger: LH breach
➡️ Model: Advanced bullish framework
➡️ Focus: Reaction at key levels
➡️ Edge: Tracking the flow, not prediction
Patience is key. Tracking is the edge. Let’s go.

EURUSD- Post --Sweep Monitoring | Accumulation PhasePrice has completed a liquidity sweep, and I’m now monitoring volume reactions as the market collects courtyard liquidity and rotates back into full accumulation.
At this stage, I’m expecting a potential shift toward delivery, but there’s no stress and no chasing. The only job here is to watch the tape and let smart money reveal intent through structure and displacement.
Until that confirmation shows, I remain patient.
➡️ Context: Sweep → Accumulation
➡️ Focus: Volume response & tape behavior
➡️ Execution: Only after confirmation
➡️ Edge: Tracking, not forcing
Patience is key. Tracking is the edge. Let’s go.

EURGBP - 7H Bird's-Eye View | Patience Before SizeFrom the 7H bird’s-eye perspective, price has already distributed into a strong higher-timeframe accumulation territory. Within that environment, I participated with point buys during the minor bullish legs, targeting internal highs as part of the ongoing delivery.
That said, the full mid-term structure shift has not yet completed. Until we see a clear mid-term shift followed by controlled pullbacks, I’ll remain selective and patient. Full position size only comes after structure confirms, not before.
Until then, the job is simple:
track price, study behavior, and let the cycle complete.
➡️ HTF context: Accumulation
➡️ Current participation: Minor bullish legs only
➡️ Full exposure: After mid-term shift + pullback
➡️ Edge: Tracking, not forcing
Patience is key. Tracking is the edge. Let’s go.

CADJPY - Bullish Framework | Patience Before DeliveryPrice remains bullish on the higher-timeframe scale, with the mid-term and minor structure aligned within the same cycle.
We’ve seen price mitigate the mid-term order block (orange), followed by an initial expansion, leaving clear footprints of where distribution is likely to occur. Current bearish momentum is contextual, occurring as price rotates back into a higher-timeframe accumulation area, not as a trend reversal.
From this zone, I’ll be tracking internal structure and displacement for confirmation of renewed buy-side intent. Buy executions are only valid once price confirms delivery from accumulation — until then, patience is the edge.
➡️ Bias remains bullish
➡️ Focus is on tracking, not forcing entries
➡️ Execution comes after confirmation, not anticipation

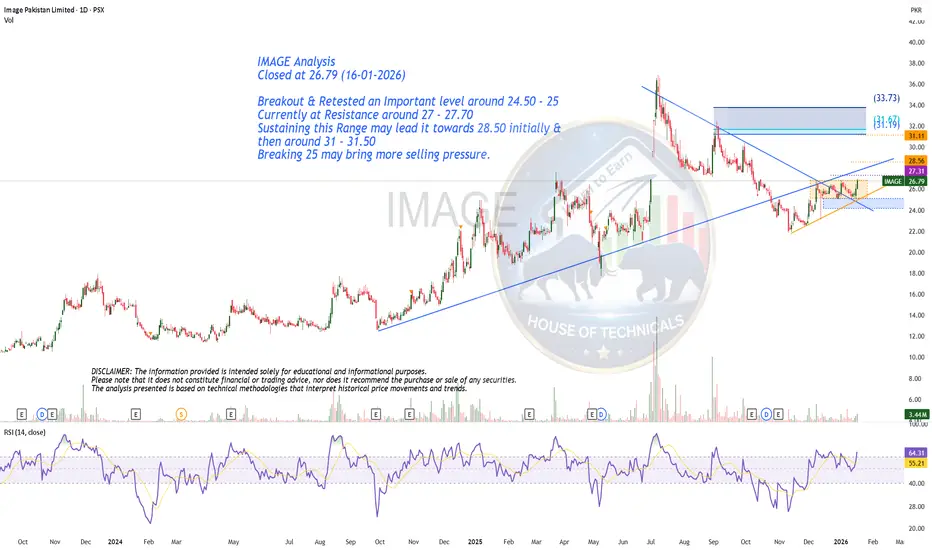
Breakout & Retest!IMAGE Analysis
Closed at 26.79 (16-01-2026)
Breakout & Retested an Important level around 24.50 - 25
Currently at Resistance around 27 - 27.70
Sustaining this Range may lead it towards 28.50 initially &
then around 31 - 31.50
Breaking 25 may bring more selling pressure.
16.01.26 Daily ForecastPairs on Watch -
FX:USDCAD
FX:EURCAD
FX:GBPCAD
A short overview of the instruments I am looking at for today, multi-timeframe analysis down to what I will be looking at for an entry. Enjoy!

MNQ Premarket Plan (POI Map) — 1/15🚨 MNQ Premarket Plan (POI Map) — 1/15
Bias/Context: We’re pressing the 25,870–25,880 decision zone (POI1 / near PDH). This is where trend day continuation OR rejection can start.
📍 Upside POIs (targets)
• POI1 25,871.25
• POI2 25,920.50
• POI3 26,006.00
• POI4 26,083.50
• POI5 26,106.25
📍 Downside POIs (supports)
• 25,738.75 → 25,652.75 → 25,615.50
• then 25,554.50 / 25,538.00
• deeper: 25,502.25 → 25,450.25 → 25,388.00 → 25,357.75 (FVG mid)
• worst case: 25,295.75
✅ Gameplan
Bull case: Hold/reclaim above 25,871–25,879 → push 25,920.50 then 26,006.00. If momentum stays strong, runner toward 26,083.50–26,106.25.
Bear case: Rejection at 25,871/25,920 → break back under 25,738.75 → target 25,652.75 then 25,615.50. If weakness accelerates, look for the next shelves below.
Rules today: First 15m range + POI retests only. No chasing mid-candle. If spreads/volatility spike → size down.

MINISO (MNSO) - Can You Play Ping-Pong With the Market?This chart is a perfect example of how markets bounce , not break.
Look at what keeps repeating on MINISO:
• Price drops into the TrendGo Accumulate line
• Accumulation appears (selling pressure gets absorbed)
• Price immediately reacts and travels back to the same resistance zone
• Rinse. Repeat.
Every single touch of the Accumulate zone has led to a ~25–35% move back toward resistance around $25.50.
This is not prediction.
This is behavior.
The market is playing ping-pong:
• Accumulate zone = the table
• Resistance = the net
• Price keeps bouncing between them.
Right now, price is once again reacting from the Accumulate area.
If this rhythm holds:
➡️ the natural target is the same resistance zone
➡️ the real question is what happens there this time
Will it:
• bounce again?
• or finally break the pattern?
Most traders lose money because they chase the move.
This chart rewards those who wait for context first.
So let me ask you:
👉 Do you play ping-pong with the market…
or do you keep running after the ball?
Context decides. Not emotions.

15.01.26 Daily ForecastPairs on Watch -
FX:NZDJPY
FX:EURJPY
A short overview of the instruments I am looking at for today, multi-timeframe analysis down to what I will be looking at for an entry. Enjoy!

1/14 Pre-Market Read - Game plan Pre-market POIs / Game Plan (MNQ 15m)
Key context from the chart:
• We mapped the session range + prior levels and stacked POIs to create a clean “ladder” for targets.
• Important nearby references on your screenshot: Asia High ~25926, Asia Low ~25852.50, London High ~25878.75, London Low ~25701, PDL ~25803.25, and upside POIs.
My POI Ladder (targets)
Upside
• POI 1: 25,871.25
• POI 2: 25,920.50
• POI 3: 26,006.00
• POI 4: 26,083.50
• POI 5: 26,106.25
Downside
• Bear POI 1: 25,738.75
• Bear POI 2: 25,652.75
• Bear POI 3: 25,615.50
How I’m trading it today (simple rules)
Bullish idea
• If price reclaims/holds POI 1 (25,871) and starts holding above POI 2 (25,920) → I’m looking for step-ups into POI 3 (26,006) then POI 4/5.
• Best entries: retest/hold of POI after a breakout candle (confirmation > guessing).
Bearish idea
• If price loses PDL (~25,803) and can’t reclaim, that’s a warning.
• Break + hold below POI 1 (25,871) opens the door to Bear POI 1 (25,738) then Bear POI 2 (25,652).
What to watch at open
• Reaction at POI 1 / POI 2 (they’re your “decision levels”).
• Sweeps into a POI then immediate reclaim = reversal trigger.
• Clean hold above POI = continuation trigger.
Not financial advice — just my plan + levels from my system.

14.01.26 Daily ForecastPairs on Watch -
FX:USDCAD
FX:NZDJPY
A short overview of the instruments I am looking at for today, multi-timeframe analysis down to what I will be looking at for an entry. Enjoy!

Options Blueprint Series [Intermediate]: Breakout With A Buffer1. Market Context: Strength at the Surface, Fragility Underneath
The NASDAQ-100 futures market currently occupies a rare and structurally important zone. Price is trading above a prior all-time high, yet remains below the most recent all-time high, with only a relatively modest distance separating current price from historical extremes.
From a purely technical standpoint, this positioning can be interpreted as constructive. Markets that hold above former highs often retain the potential to transition into renewed expansion and price discovery. However, context matters. This strength exists alongside broader signals of vulnerability across U.S. equity markets—signals that have been explored in prior work and that suggest upside continuation is not guaranteed.
This creates a dual-risk environment:
Upside risk: missing participation if the NASDAQ resumes trending higher.
Downside risk: absorbing full exposure if price fails near historical extremes.
In such conditions, directional certainty is low, but volatility risk is high. This is where outright futures exposure may be less efficient, and where options structures can offer a more robust framework.
2. The Problem With Linear Exposure at Elevated Levels
Holding NASDAQ-100 futures outright implies linear exposure:
Every point higher benefits the position.
Every point lower damages it.
Near historical highs, that symmetry becomes problematic. A trader must be correct not only on direction, but also on timing. Even a structurally bullish thesis can fail if volatility expands or if price retraces before resuming higher.
Linear exposure forces a binary outcome:
Be early and absorb drawdowns.
Be late and miss opportunity.
The goal of this blueprint is to avoid that binary trap by reshaping exposure, not eliminating it.
3. Why Options Are Better Suited for This Environment
Options allow traders to separate direction from risk. Rather than committing capital to a single path, options structures can be designed to:
Define maximum loss in advance
Shift break-even points away from current price
Allow time and volatility to work in favor of the position
Importantly, this blueprint does not rely on forecasting. It assumes uncertainty and builds around it.
The objective is not to predict whether the NASDAQ will break higher or fail lower. The objective is to remain functional across multiple outcomes.
4. Instruments Used: NQ and MNQ Options
This structure applies to:
NASDAQ-100 E-mini futures options (NQ)
NASDAQ-100 Micro E-mini futures options (MNQ)
The logic is identical across both contracts. The difference lies in scale:
NQ offers larger notional exposure and fewer contracts.
MNQ allows finer position sizing, particularly useful when structuring multi-leg options strategies.
Both instruments support the same conceptual framework.
5. Introducing the “Breakout With A Buffer” Concept
The core idea behind this blueprint is simple:
Do not chase price near highs
Do not stand aside entirely
Create a buffer below price while retaining upside access
This is achieved by combining:
A bull put spread placed well below current price
A long call positioned above current price
Together, these components transform uncertainty into a structured payoff.
6. Strategy Construction: Step by Step
The structure consists of three legs:
Short put at approximately 22,000
Long put at approximately 21,000
Long call at approximately 28,750
The bull put spread generates a net credit. That credit is then used to fund the long call.
This matters. Rather than paying outright for upside exposure, the structure monetizes downside stability to finance it.
7. Why a Bull Put Spread and Not a Naked Put
Selling naked puts would introduce undefined downside risk, which contradicts the purpose of this blueprint.
The long put:
Caps downside exposure
Converts the position into a defined-risk structure
Clarifies the maximum loss from the outset
This is not about maximizing credit. It is about controlling tail risk.
8. Strike Selection: Structural, Not Arbitrary
The selected put strikes align with:
The prior all-time high region
A visible concentration of UFOs (UnFilled Orders) acting as structural support
UnFilled Orders represent areas where institutional activity previously absorbed selling pressure. Positioning the put spread near such zones introduces a structural buffer, rather than relying on random distance.
The call strike, by contrast, is intentionally placed far above current price. This avoids overpaying for near-term momentum and instead positions for a regime where price transitions into sustained expansion.
9. Why This Is Not a Collar or a Covered Strategy
It is important to distinguish this blueprint from more common approaches:
Collars require long underlying exposure.
Covered calls cap upside and remain fully exposed to downside.
Outright calls depend heavily on timing and volatility expansion.
This structure does none of those things. It:
Does not require owning futures
Does not cap upside
Does not rely on immediate directional movement
Instead, it converts time and uncertainty into functional components of the trade.
10. Risk Profile: Defined, Asymmetric, Intentional
The resulting payoff has several key characteristics:
Maximum risk is limited to the width of the put spread (approximately 1,000 NASDAQ points), adjusted for net credit.
Break-even is pushed far below current price, near the 22,000 area.
Moderate upside benefits from both time decay on the put spread and directional exposure through the call.
Strong upside allows the long call to dominate the payoff.
This asymmetry is intentional. The structure sacrifices linear gains in exchange for survivability.
11. Scenario Analysis
At the time of constructing this case study, NASDAQ-100 futures trade near 25,900.
Possible outcomes:
Gradual advance: The put spread decays, the call gains sensitivity.
Strong breakout: The call drives returns.
Sideways consolidation: Time decay works in favor of the structure.
Moderate decline: The buffer absorbs volatility.
Deep decline below support: The defined maximum loss is realized.
Every outcome is known in advance. That clarity is the edge.
12. Volatility Considerations
This structure is volatility-aware:
Short puts benefit from volatility contraction.
Long calls benefit from volatility expansion during upside moves.
Rather than betting on volatility direction, the structure balances exposure across regimes.
13. NQ vs MNQ Implementation
For NQ:
Fewer contracts
Larger notional exposure
Greater margin efficiency per leg
For MNQ:
More granular sizing
Easier scaling
Reduced psychological pressure per contract
The strategy logic remains unchanged.
14. Contract Specifications
NQ Tick size: 0.25 points = $5
MNQ Tick size: 0.25 points = $0.50
Options multipliers mirror the futures contracts. Margin requirements vary by broker and volatility regime, currently:
NQ margin requirement = $33,500 per contract
MNQ margin requirement = $3,350 per contract
15. Risk Management Is the Strategy
Defined risk does not remove responsibility. This blueprint requires:
Proper sizing
Acceptance of worst-case outcomes
Discipline in structure selection
Options do not eliminate uncertainty. They make it visible.
16. Key Takeaways
Elevated markets demand adaptive exposure.
Options allow participation without blind commitment.
The Breakout With A Buffer blueprint prioritizes risk clarity first, opportunity second.
This framework is reusable whenever markets hover near historical extremes amid conflicting signals.
Data Consideration
When charting futures, the data provided could be delayed. Traders working with the ticker symbols discussed in this idea may prefer to use CME Group real-time data plan on TradingView: www.tradingview.com - This consideration is particularly important for shorter-term traders, whereas it may be less critical for those focused on longer-term trading strategies.
General Disclaimer
The trade ideas presented herein are solely for illustrative purposes forming a part of a case study intended to demonstrate key principles in risk management within the context of the specific market scenarios discussed. These ideas are not to be interpreted as investment recommendations or financial advice. They do not endorse or promote any specific trading strategies, financial products, or services. The information provided is based on data believed to be reliable; however, its accuracy or completeness cannot be guaranteed. Trading in financial markets involves risks, including the potential loss of principal. Each individual should conduct their own research and consult with professional financial advisors before making any investment decisions. The author or publisher of this content bears no responsibility for any actions taken based on the information provided or for any resultant financial or other losses.

APA Corporation (APA) – Weekly ChartThis is what accumulation looks like before the breakout - not after it.
APA is entering a classic accumulation + compression phase that most traders completely ignore.
Price is tightening inside a well-defined accumulation zone , sitting just below the local resistance at $27.15.
No distribution. No panic. Just time being exchanged for structure .
This is exactly the phase where markets prepare - quietly.
⸻
What the chart is telling us
• Price compression under resistance → pressure is building, not resolving.
• Repeated stabilization inside the accumulation zone → supply is being absorbed.
• No impulsive selling → this is not a topping structure.
When markets stop falling but also stop rising, someone is working orders .
⸻
Key levels
• $27.15 → first structural test. A break and hold changes the short-term narrative.
• ~$33.00 → major long-term resistance. Only above this level does a true trend expansion become possible.
Until then, this remains a pre-decision zone .
⸻
Two possible paths
✔️ Constructive scenario:
Price continues to hold the accumulation zone and eventually breaks above 27.15.
⚠️ Patience scenario:
Compression extends. No breakout yet. More time spent absorbing supply.
Both outcomes are healthy. What’s dangerous is forcing a trade before resolution .
⸻
Question for you
Do you prefer:
• Observing accumulation before the move starts?
or
• Reacting after price escapes the range?
Markets don’t announce accumulation.
They reveal it only to those who watch structure.
Let’s hear your thoughts 👇

13.01.26 Daily ForecastPairs on Watch -
FX:GBPUSD
FX:EURCAD
FX:USDCAD
A short overview of the instruments I am looking at for today, multi-timeframe analysis down to what I will be looking at for an entry. Enjoy!

MINISO Group Holding (MNSO) - Accumulation Phase After DowntrendMINISO is currently displaying a clear accumulation structure following a prolonged corrective phase. After the prior impulse move higher, price entered a controlled downtrend and has now stabilized back around the long-term mean, where TrendGo Accumulate has been consistently active .
This is an important shift in behavior: instead of acceleration to the downside, price is now moving sideways with reduced volatility , suggesting absorption of supply rather than distribution.
TrendGo System Read
• Accumulate: Multiple accumulation signals have appeared during the base-building phase, historically aligning with areas where downside pressure fades and positioning begins.
• Structure: Price is holding around the long-term reference line, forming a flat, compressed range rather than lower lows.
• Context: Institutional volume remains low, which often characterizes early-stage accumulation rather than late-cycle breakouts.
What matters next
This is not a breakout environment yet - it is a preparatory phase .
For a constructive continuation, we want to see:
• Sustained holding above the accumulation zone
• Gradual expansion in range and participation
• Follow-through rather than single-candle reactions
If price fails to hold the base, the accumulation thesis weakens and the structure resets.
TrendGo perspective
This is how trends are born quietly - compression first, expansion later.
No prediction, no urgency. Context before decisions.
The question is not “ will it go up tomorrow? ”
The real question is whether this base is being respected over time.

12.01.26 Daily ForecastPairs on Watch -
FX:NZDJPY
FX:GBPJPY
FX:EURCAD
A short overview of the instruments I am looking at for today, multi-timeframe analysis down to what I will be looking at for an entry. Enjoy!

09.01.26 Daily ForecastPairs on Watch -
FX:GBPUSD
FX:AUDUSD
FX:EURCAD
A short overview of the instruments I am looking at for today, multi-timeframe analysis down to what I will be looking at for an entry. Enjoy!

08.01.26 Daily ForecastPairs on Watch -
FX:AUDUSD
FX:GBPUSD
FX:GBPCAD
FX:EURCAD
A short overview of the instruments I am looking at for today, multi-timeframe analysis down to what I will be looking at for an entry. Enjoy!
