EURGBP - Bullish ContinuationHTF (4H) showing bullish intent — waiting on full mitigation of the internal OB. This zone carries strong significance, mapped from higher timeframe structure with volume confirming sustained interest, making it a high-quality area to work from.
On the 30M, I’m looking for alignment confirmation — once the LH is broken, bullish bias is validated and continuation becomes favored.
LTF (5M): once the mid-zone is mitigated and a clear CHoCH prints, I’ll wait for a pullback into clean demand to execute buys.
Patience is key.
Tracking is the edge.
Let’s get it. 🔥
Structure

CADJPY - Bullish ContinuationHTF (4H) showing clean bullish structure — tape reading confirms strength and continuation intent.
On the 30M, structure remains bullish as price works toward the SSL. Waiting for price to dip into the internal OB test area before engagement.
LTF (5M): once mitigation occurs, I’ll wait for a clear LH break and pullback into the bullish leg — targeting liquidity above mid and HTF highs.
Patience is key.
Tracking is the edge.
Let’s get it. 🔥

GBPJPY - Bullish ContinuationHTF (4H) structure remains bullish, printing higher highs and higher lows with strong volume supporting key pivot points.
On the 30M, I’m waiting for a deeper pullback — looking for price to sweep SSL and tap into the underlying OB. Once full candle mitigation is confirmed, I’ll shift into execution mode.
LTF (5M): after mitigation, I’m waiting for a clean LH break followed by a pullback into fresh demand to take buy entries targeting mid and major highs.
Patience is key.
Tracking is the edge.
Let the market do the work. Let’s go. 🔥

USDJPY - Bullish ContinuationHTF (4H) showing strong bullish intent — solid momentum supported by clean volume expansion.
On the 30M, price respected the refined prior-week OB, with engineered liquidity swept into the zone.
LTF (5M) delivered confirmation: bullish break of structure, higher high established, and a clean pullback entry.
Buy executed on the retrace — higher low holding, volume supporting continuation.
Now it’s just patience and execution.
Trade is active. Let the market deliver.

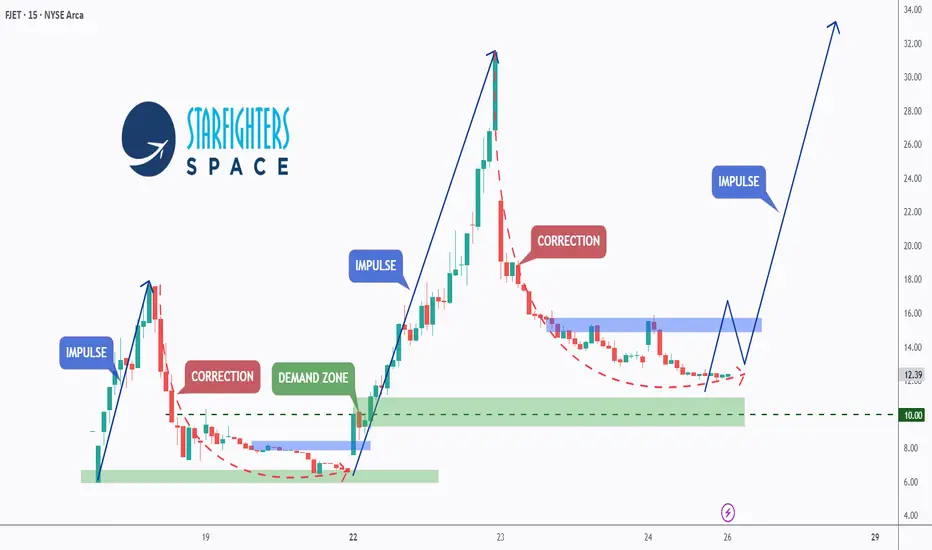
FJET - Post-IPO Structure Is Taking Shape!After its public debut, Starfighters Space ( AMEX:FJET ) delivered exactly what strong listings tend to do:
an impulsive expansion 📈, followed by a healthy correction 📉, and now the early signs of structure forming.
This phase is where real opportunities usually start to emerge.
📊 Technical Analysis
Cycles are clearly repeating on FJET.🔄
In the previous cycle, FJET printed a strong impulse move from around $6.4 to approximately $31, representing a ~400% expansion🚀 .
That rally was followed by a curved correction , after which price retested the $10 demand zone and used it as a base for continuation.
🔄Now, we are seeing the same structure forming again.
FJET is currently trading within another curved correction , gradually rotating lower toward a newly formed demand zone between $10 and $11 . Importantly, this correction is unfolding with decreasing downside momentum, suggesting absorption rather than aggressive selling.
🏹The key trigger remains the last high marked in blue around $16.
A clean break and hold above this level would confirm bullish continuation and signal the start of the next impulse move, with the potential to push FJET toward new all-time highs above $31.
⚔️As long as the $10 demand zone holds, the structure continues to favor continuation over reversal.
💡 Bigger Picture
Now that FJET is officially public📊, the narrative has shifted from anticipation to execution.
Starfighters Space is not a speculative concept, it’s an operating aerospace company:
- Flying missions out of NASA’s Kennedy Space Center👩🚀
- Operating the world’s only commercial Mach 2-capable fleet
- Backed by validation from NASA, Lockheed Martin, GE, and the U.S. Air Force🛩
Post-IPO phases like this are often where institutions begin evaluating structure, liquidity, and follow-through, not at the highs, but during consolidation.
📘 Bottom line
FJET has moved past the chaos of its debut and is now building a base.🪨
If demand continues to hold and momentum rebuilds, this consolidation could be the pause before the next expansion.
This is the phase where patience matters most.
📌 Always do your own research and speak with your financial advisor before investing.
📚 Stick to your trading plan, entry, risk management, and execution.
All Strategies Are Good, If Managed Properly!
~ Richard Nasr
Disclaimer: I have been paid $800 by CDMG, funded by Starfighters Space, to disseminate this message.
MNQ (15m) POI Map — Why These Levels Matter and how to use themMNQ (15m) POI Map — Why These Levels Matter (and how I’m using them)
I don’t like “winging it” once the market starts moving fast. So before the session (or during quieter pre-market hours), I mark **Points of Interest (POIs)** that I expect price to **react from**—either as support/resistance, liquidity targets, or “decision zones” where bias can flip.
These POIs are not magic lines. They’re **locations where order flow has already proven itself**, and where I want to be *ready* instead of *surprised*.
---
## How I chose these POIs (my filter)
Each POI on this chart was mapped using 3 things:
1. **Structure (15m swings / pivots)**
Where price previously *broke structure* or *rejected hard*.
2. **Liquidity (obvious targets)**
Equal highs/lows, clean swing points, and “everyone sees it” areas where stops sit.
3. **Reaction history (clean reactions)**
Levels that have already caused a noticeable bounce, stall, or reversal = worth respecting again.
---
## The Levels (Bull POIs)
### **BULL POI #1 — 25,810.50**
This is my **first decision level** in the current zone. It’s the closest “line in the sand” where:
* Holding above it keeps bullish continuation alive
* Losing it opens the door for a rotation back into the lower POIs
**How I use it:**
If we tag this area and **hold/accept above** (strong bodies, wicks getting bought, reclaim after a sweep), I’m looking for longs targeting the next POI up.
---
### **BULL POI #2 — 25,874.25**
This one is a **higher pivot / reaction zone**—the type of level where price often:
* pauses to consolidate
* rejects for a pullback
* or breaks through and turns into support
**How I use it:**
If price is trending up, this is a logical **first major target** and a spot to either scale profit or look for a clean break-and-retest to continue.
---
### **BULL POI #3 — 25,927.00**
This is a **liquidity + swing area**. It’s the kind of level that’s attractive for:
* stop runs above prior highs
* profit-taking
* reversal setups if momentum stalls
**How I use it:**
I treat this as a “reaction expected” level. If we arrive with weak momentum, I’m cautious chasing longs into it.
---
### **BULL POI #4 — 25,949.25**
This is my **upper extreme POI**—usually a bigger “decision area” where:
* late longs get trapped if momentum dies
* reversals can form (especially after a sweep)
* or we get continuation if the tape is strong
**How I use it:**
I’m more likely to **take profit into this** than initiate fresh longs unless the market is clearly in expansion.
---
## The Levels (Bear POIs)
### **BEAR POI #1 — ~25,754 zone (25,754.25 on my map)**
This is my **bearish trigger / pivot**. If price loses Bull POI #1 and continues lower, this becomes the next major “prove it” level.
**How I use it:**
If we break down into this area and **reject** (heavy wicks, failed reclaim), I’ll look for continuation shorts toward the next bear POIs.
---
### **BEAR POI #2 — 25,649.75**
This is a deeper **demand/reaction pocket**—a level I expect price to *respect* or at least *pause* at.
**How I use it:**
This is a common “bounce zone.” If shorts are in profit, I’m scaling here. If we sweep it and reclaim, I’m watching for reversal setups.
---
### **BEAR POI #3 — 25,622.25**
This is the **lower extreme / liquidity pool** level—where panic moves can exhaust and snap back.
**How I use it:**
I’m not trying to short *into* this level late. This is where I expect **either**:
* a final flush and reversal attempt
**or**
* a strong breakdown continuation (if the day is truly risk-off)
---
## The whole point of mapping POIs
These levels give me a simple plan:
* **Hold above Bull POI #1 → bullish bias stays active**
* **Lose Bull POI #1 → expect rotation to Bear POI #1**
* **Each POI is either a target, a reaction zone, or a bias flip zone**
I’m not predicting. I’m preparing.
---
## Execution Rules (what I wait for at a POI)
At any POI, I want confirmation like:
* **Sweep + reclaim** (liquidity grab then strong close back through)
* **Break + retest** (clean structure change)
* **Rejection candles** (wicks + follow-through away from the level)
* **Acceptance** (multiple closes above/below = level flips)
Then I manage risk using a simple concept:
**Invalidation goes just beyond the POI. Targets are the next POI.**
---
### If you’re using my tool stack:
These POIs pair well with:
* **ORB direction/bias**
* **VWAP/EMA context**
* **Reversal confirmations** (only when the POI + context agree)
---
**Not financial advice. Futures are high risk—size accordingly and protect your downside.**
If you want, I can turn this into a cleaner “TradingView publish-ready” format with a tighter intro + bullet layout, and add your usual TRADESWITHB call-to-action at the end.

23.12.25 Daily ForecastPairs on Watch -
FX:EURUSD
FX:EURNZD
FX:EURJPY
A short overview of the instruments I am looking at for today, multi-timeframe analysis down to what I will be looking at for an entry. Enjoy!

'Two Charts, Same Pattern, Totally Different Market - Here's Why🔥 THE DEEPEST TRUTH MOST TRADERS NEVER LEARN: CONTEXT IS THE MARKET’S REAL LANGUAGE
If you stare at enough charts, you’ll start to see a pattern problem — and it’s destroying traders every single day. Everyone wants to react to what price looks like, instead of learning how price behaves.
Two charts can look exactly the same — same pattern, same shape, same pullback, same consolidation, same breakout — and still produce completely opposite outcomes.
Why?
Because context isn’t visual.
Context is structural.
Context is narrative.
Context is market psychology expressed through order flow.
A lot of traders are studying candles… but the candles aren’t the truth.
The phase is the truth.
The position inside the leg is the truth.
The liquidity story is the truth.
And if you don’t know the truth, the market punishes you.
⸻
🔥 THE DIFFERENCE BETWEEN WINNING AND LOSING IS NOT THE PATTERN — IT’S THE ENVIRONMENT
Let’s break it down clean:
A pullback inside a strengthened, impulsive uptrend is opportunity.
Smart money is reloading.
Volume supports the continuation.
Liquidity is building below swing lows.
The correction is healthy — supported by momentum, structure, and expansion.
But here’s the flip:
A pullback inside a weakened, distributive market is a death trap.
The leg is tired.
Momentum is fading.
Liquidity is drying out.
Smart money is offloading inventory — not accumulating.
To the naked eye, both pullbacks look the same.
To the trained eye, they couldn’t be more different.
This is why top-down analysis matters.
⸻
🔥 BREAKOUTS PROVE IT EVEN CLEARER
A breakout during a momentum phase is fuel.
It tells you price is expanding with force, not faking direction.
But a breakout inside distribution?
That’s manipulation.
That’s inducement.
That’s the market selling strength to buyers who don’t understand phase transitions.
From the outside, both breakouts look clean.
Both breakouts feel bullish.
Both breakouts trigger emotion.
But one breakout is confirming continuation —
The other breakout is preparing reversal.
And traders who don’t understand context end up buying the exact candle professional money is using to exit.
⸻
🔥 THIS IS WHY MOST TRADERS LOSE: THEY TRADE SHAPES, NOT STORIES
Most people can read candles.
Very few can read intention.
Most people see structure.
Very few understand order flow.
Most people memorize patterns.
Very few study phases, accumulation, distribution, inducements, and macro positioning.
And when you’re blind to context, price movement starts looking random — not because it is random, but because your process is incomplete.
⸻
🔥 TOP-DOWN ANALYSIS IS THE ANTIDOTE
When you move from 4H → 30M → 5M, the entire game changes.
You start seeing:
• What leg price is responding to
• Whether the move is correction or expansion
• Whether the premium/discount environment supports continuation or reversal
• Whether volume aligns with market direction
• Whether structural shifts have real intention
• Whether the pullback is healthy or distributive
• Whether you’re trading strength or exhaustion
This is not about finding entries.
This is about understanding story.
And when you understand the story, the market stops attacking you — it starts communicating with you.
That’s why I always say:
📌 Structure without context is noise.
📌 Patterns without narrative are traps.
📌 Entries without phase analysis are gambling.
⸻
🔥 SMART MONEY DOESN’T TRADE CANDLES — IT TRADES PHASES
Accumulation → Manipulation → Expansion → Distribution.
That cycle has existed forever — way before candlesticks, way before indicators, way before retail charts.
Jesse Livermore was teaching it 100 years ago without even using modern language:
Price doesn’t move because of patterns — price moves because of positioning.
And that’s the same message today, just spoken through volume, OBs, HTF narrative, inducements, liquidity sweeps, and structural transitions.
Context IS Smart Money Concepts.
Context IS the real edge.
Context IS the only reason price behaves the way it does.
⸻
🔥 FINAL MESSAGE FOR TRADERS: IF YOU CAN’T SEE CONTEXT, YOU’RE NOT SEEING THE MARKET
If trading feels confusing, unpredictable, inconsistent, emotional — it’s not because you’re bad at trading.
It’s because you’re trading charts instead of trading environments.
Two charts can be identical.
Only context tells you whether the pullback deserves your money —
or your patience.
Only context tells you whether the breakout deserves conviction —
or caution.
Only context tells you whether the structure deserves participation —
or avoidance.
Context tells the truth.
Everything else is noise.

AUDCAD - Bullish OutlookMulti-Timeframe:
Alignment is syncing — waiting for full confirmation before active execution.
HTF (4H):
Strong bullish structure intact — short and simple, momentum is clear.
Mid-Term (30M):
Applying continuation logic. Fresh SSL was taken, pushing price into the mid-term OB (orange zone). The zone has been refined to identify real smart money buy interest. Clean mitigation observed, waiting for trend change and sync back into bullish to catch the move without being in front of it.
LTF (5M):
Waiting for LH break to confirm intent and track the pullback for minor liquidity and buy points into the bullish leg. Price and volume will lead, along with smart money signals, until execution.
Patience is key.
Tracking is the edge.
Let’s go. 🚀

USDCAD - Bullish OutlookHTF (4H):
Strong bullish structure intact. Price swept previous structure and is now moving toward a strong test area, maintaining bullish intent.
Mid-Term (30M):
Waiting for alignment. Once LH breaks and trend change is confirmed, my interest becomes active. After the break, I’ll track price for fresh liquidity and OB mitigation before considering execution.
LTF (5M):
Once full alignment is in place, I’ll wait for the final CHoCH and pullback to identify buy points along the existing trend.
Patience is key.
Tracking is the edge.
Let’s go. 🚀

USDCHF - Bullish OutlookMulti-Timeframe:
Alignment intact — waiting for full sync before execution.
HTF (4H):
Bullish structure remains intact. Price is in a ranging environment but leaning bullish overall, showing strong structural support.
Mid-Term (30M):
OB has been mitigated, with bullish pressure visible in the orange zone to the left. Smart money engineered liquidity, leading price toward the LTF OB at the discounted origin zone.
LTF (5M):
Price is currently mitigating the internal OB near the origin block (green zone). I’m looking for full candle bodies inside the zone to confirm smart money intent. If not, I’ll continue tracking until a fresh BOS, clean POI, and liquidity levels form.
Patience is key.
Tracking is the edge.
Let’s go. 🚀

EURUSD - Bullish OutlookHTF (4H):
Bullish alignment restored. Price is heading toward the HTF objective at 1.19183, showing clean momentum.
Where the untrained eye might see confusion, the trained eye sees a guided navigation road map.
Mid-Term (30M):
CHoCH confirmed — previous strong LH has been taken out, leaving directional footprints and structure hints.
Now waiting on full candle mitigation inside the mid-term OB to align the next push toward the HTF objective.
LTF (5M):
Once price taps the zone, I’ll track for a minor LH break to confirm zone strength, with volume supporting interest for continuation.
Until then — patience is key.
Tracking is the edge.
Smart Money leads.
Let’s go. 🚀

EURGBP - Bullish OutlookHTF (4H):
Bullish structure is clean and controlled — rhythm is easy to read, directional intent is clear. I want to be part of that continuation phase once the lower timeframes sync.
Mid-Term (30M):
Previous week’s mid-term OB was violated, driving price directly into the stronger HTF OB below. Solid mitigation there. Now I’m expecting a mid-term CHoCH + LH break to flip structure back bullish. Until full alignment forms and the market syncs correctly, I’m staying patient and monitoring.
LTF (5M):
Once the 30m LH breaks, I’ll look for a fresh SSL and newly formed OB near the sweep. That’s when I’ll drop into LTF to confirm the flip and validate that mid-term zone is ready to hold and launch.
Patience is key. Tracking is the edge.
Let’s go. 🚀

CADJPY - Bullish OutlookHTF (4H):
Bullish momentum remains intact as price continues to build off previous week’s structure. Narrative is still expansion, nothing broken, no change in intent.
Mid-Term (30M):
Looking to join the continuation phase, but expecting distribution first. Waiting for bears to drive price lower to sweep liquidity (SSL) and deliver price into the mid-term OB. That’s the area I want to see mitigated before aligning with the next leg up.
LTF (5M):
Once price taps the mid-term zone, I’ll drop down for confirmation—LH break + full CHoCH to validate continuation and position flow. Until then, staying patient.
Patience is key. Tracking is the edge.
Let’s see what unfolds — let’s go.

GBPJPY - Bullish OutlookHTF (4H):
Market is in a clean expansion phase with strong volume supporting bullish momentum. New structure has formed, and the narrative remains continuation to the upside as long as current structure holds.
Mid-Term (30M):
Price has shown continuation flow, but I’m expecting short-term bearish movement first — a drive lower to sweep liquidity and complete full SSL into the OB below. Once that zone is fully mitigated (candle bodies included), next step is confirmation for continuation.
LTF (5M):
Waiting on a CHoCH and LH break to align with the broader narrative. From there, I’ll focus on recent liquidity structure + fresh OB development for potential execution.
Patience is key. Tracking is the edge.
Let’s see what this week offers — let’s work.

AUDJPY - Bullish OutlookHTF (4H):
Price remains bullish with clean continuation flow to the upside. Current leg is expanding with strong momentum, and the next HTF objective is 104.402.
Mid-Term (30M):
Price pushed higher into continuation structure, and we saw mitigation of the refined orange OB. That zone held clean with solid volume follow-through — supporting ongoing upside intent. Market structure remains aligned with the HTF expansion narrative.
LTF (5M):
A clean CHoCH formed as the major LH was taken, opening the path for continuation toward the highs. I’m still tracking price closely for deeper mitigations into LTF OBs before considering execution — letting price come to me rather than chasing early imbalance.
Plan:
Patience stays the key. Tracking is the edge. Waiting for price to sweep and deliver a cleaner OB mitigation before stepping in. The bullish narrative remains intact until proven otherwise.
Let’s see what the week delivers — focus and execution.

USDJPY - HTF Bullish Narrative + IDM Mechanics + LTF OutlookHTF (4H):
Structure remains bullish.
HTF external liquidity target sits at 157.905 with market intent showing continued expansion toward that level.
⸻
Mid-Term (30M):
Price is holding previous week’s structure and continuing its bullish progression toward mid/HTF highs. We saw mitigation of the refined OB before price reversed, using IDM to pull traders into the refined zone and engineer liquidity for continuation.
⸻
LTF (5M):
Major CHoCH swept inducement and engineered liquidity beneath the move. Strong volume and candle exhaustion show clear bullish intent reacting off the green zone.
Entry was possible there, but I chose discipline — I want full alignment before stepping in.
⸻
Expectations:
Looking for a fresh LTF liquidity sweep to lead price back into a clean LTF OB, which aligns with imbalance on the zoomed-out structure.
This week, it’s patience:
Track → Align → Execute.
Let’s see how price delivers.
Until then — patience is key, tracking is the edge.
Let’s go. 🚀

USDJPY Breakeven Trade Recap 20.12.25In this recap I break down my USDJPY long position I took last week as a flip and failure of structure, initially looking for the short than then presented a great long opportunity when that structure failed.
Full explanation as to why I executed on this position and also why I managed aggressively once price moved back into profit.
Any questions you have just drop them below 👇

19.12.25 Daily ForecastPairs on Watch -
FX:USDJPY
FX:GBPJPY
A short overview of the instruments I am looking at for today, multi-timeframe analysis down to what I will be looking at for an entry. Enjoy!

AUDCAD - Stuck in a Range… Bears Eye the Upper Boundary!📦AUDCAD has been moving inside a clear horizontal range , with price repeatedly rejecting the upper resistance zone highlighted in red. Each time price tapped this area, sellers regained control and pushed it downward.
⚔️Price is now approaching that same resistance once again. As long as this zone holds, we will be looking for sell setups, expecting AUDCAD to reverse back toward the lower bound of the range.
📉The bias remains bearish within this structure unless buyers manage to break and close above the resistance with strength.
Do you think AUDCAD will respect the range again? Share your thoughts below 👇
⚠️ Disclaimer: This is not financial advice. Always do your own research and manage risk properly.
📚 Stick to your trading plan regarding entries, risk, and management.
Good luck! 🍀
All Strategies Are Good; If Managed Properly!
~Richard Nasr

18.12.25 Daily ForecastPairs on Watch -
FX:GBPAUD
FX:NZDUSD
A short overview of the instruments I am looking at for today, multi-timeframe analysis down to what I will be looking at for an entry. Enjoy!

How to Use VWAP in Confluence with StructureVWAP is one of the few indicators that consistently adds value when used correctly. It does not predict direction and it does not replace market structure, but it provides a powerful reference point for where fair value sits within the current session or trend.
When combined with structural analysis, VWAP helps you filter trades, improve timing, and avoid impulsive entries that fight the underlying flow.
The first step is understanding what VWAP represents. It shows the average price weighted by volume, reflecting where most transactions have occurred. When price trades above VWAP, it signals that buyers are in control of the session.
When price trades below it, sellers dominate. This context becomes meaningful only when it aligns with the higher timeframe structure.
Start by establishing your bias through market structure.
If the higher timeframe is in an uptrend and price trades within a discount zone, VWAP becomes a dynamic confirmation tool. A reclaim of VWAP after a liquidity sweep or after a break of structure is one of the cleanest signals that buyers are stepping back in.
The same applies in reverse for downtrends: a VWAP rejection after a pullback into premium strengthens the short bias.
VWAP also adds clarity during intraday consolidation. Ranges often form around VWAP because it reflects the session’s equilibrium. Breakouts that occur away from VWAP without pullbacks frequently lack durability.
However, a breakout followed by a retest of VWAP shows acceptance and builds confidence in continuation. This combination turns a common indicator into a reliable filter rather than a standalone signal.
Another effective use of VWAP is identifying exhaustion. When price aggressively pushes far above or below VWAP, it often signals that the move is extended. This does not mean you fade the trend, but it does mean you tighten expectations and wait for structure to align before entering. Once price reconnects with VWAP and shows intent, the next move becomes more sustainable.
VWAP becomes particularly powerful when paired with session logic. Trading above VWAP in a bullish higher timeframe environment during London or New York sessions often leads to cleaner impulses.
Trading against VWAP during low-volume hours produces far more false signals. Timing, structure, and VWAP together create a cohesive framework.
Used in confluence, not in isolation, VWAP supports disciplined decision-making.
It aligns entries with momentum, filters low-quality setups, and clarifies whether the market accepts or rejects a level. When you combine VWAP with structure, liquidity, and session context, your trades become more intentional, less emotional, and significantly more consistent.
17.12.25 Daily ForecastPairs on Watch -
FX:GBPAUD
FX:CADJPY
FX:EURNZD
A short overview of the instruments I am looking at for today, multi-timeframe analysis down to what I will be looking at for an entry. Enjoy!
