CADJPY- Bullish ContinuationDaily:
Bullish.
⸻
4H:
Clear higher highs and higher lows. Strong bullish momentum remains intact and continuation remains in sync.
⸻
30M:
Price broke major highs and left upside liquidity. Currently waiting for SSL to be taken and for price to deliver into an OB beneath. Execution comes only after mitigation and confirmation.
⸻
5M:
Once the 30M mid-term zone is tapped, I’ll wait for LTF structure to confirm the hold. If applied, buy execution will follow the bullish leg.
Until then — patience is key.
Structure

GBPJPY - Bullish Continuation | Alignment in ProgressDaily Bias:
Bullish.
⸻
🔹 Higher-Timeframe Context (4H)
Strong bullish momentum remains intact.
Continuation to the upside is the primary expectation.
⸻
🔹 Mid-Term Setup (30M)
• Waiting for SSL to be taken
• Looking for delivery into a mid-term OB
• After mitigation, I’ll wait for confirmation, not assumption
Discount first. Execution later.
⸻
🔹 Lower-Timeframe Execution (5M)
Once the mid-term OB is mitigated:
• I’ll wait for a lower-high (LH) break
• Structure must confirm bullish intent
• Buy execution will follow the bullish leg, not the drawdown
⸻
🎯 Objectives
• 5M highs
• Higher-timeframe objectives
Until alignment completes — patience remains the edge.
⸻
🧠 Mindset Note
Continuation rewards discipline, not anticipation.
⸻
Let’s go.

AUDJPY - Bullish Continuation | Alignment WatchDaily Bias:
Bullish.
⸻
🔹 Higher-Timeframe Context (4H)
Strong bullish momentum remains intact.
Trend is clearly to the upside, so continuation is the primary focus.
⸻
🔹 Mid-Term Setup (30M)
• Waiting for SSL to be taken
• Once applied, I’ll look for full mitigation into the mid-term OB
• Area will be tested for acceptance, not assumed
Confirmation comes after delivery.
⸻
🔹 Lower-Timeframe Execution (5M)
Once the mid-term zone is mitigated:
• I’ll wait for a structural flip on LTF
• Direction must be confirmed by structure, not candles
• Only when all timeframes align will execution occur
⸻
🎯 Objectives
• 5M highs
• Mid-term highs
• HTF objectives
Until then — patience remains the edge.
⸻
🧠 Mindset Note
Alignment creates opportunity.
Execution is the reward for waiting.
⸻
🔔 Status
Monitoring and waiting.
Let the market invite the trade.
Let’s go.

USDJPY - Bullish Continuation | Alignment - Based ExecutionDaily Bias:
Bullish.
⸻
🔹 Higher-Timeframe Context (4H)
Strong highs were established, immediately shifting focus to continuation, not reversal.
HTF structure remains intact and supportive of higher prices.
⸻
🔹 Mid-Term Delivery (30M)
• Price took SSL, initiating drawdown
• Delivery fell into a refined mid-term OB
• Zone was respected cleanly over time
This confirmed price was seeking proper discount, not breaking bias.
⸻
🔹 Lower-Timeframe Execution (5M)
After mitigation of the mid-term OB:
• I waited for CHOCH / structural flip
• Lower high (LH) was broken, confirming bullish intent
• Engineered liquidity was then taken
• Price delivered into bullish OBs, supporting continuation
Execution followed structure, not impulse.
⸻
🎯 Trade Plan
I’m attending bullish continuations only.
Targets remain active until 5M highs are breached.
Until then — patience is the edge.
⸻
🧠 Mindset Note
Continuation trades aren’t rushed —
they’re allowed to mature.
⸻
📌 Update
I’ll be posting micro moves in my Minds later this week.
We stay active — let’s go.

GBPUSD -- Alignment - Based Bullish ContinuationDaily Bias:
Bullish.
⸻
🔹 Higher-Timeframe Context (4H)
Price delivered clear bullish momentum:
• Mid-term lower high (LH) was broken
• SSL was taken, confirming continuation intent
• Structure remains intact and supportive of higher prices
HTF objective is still active.
⸻
🔹 Mid-Term Execution (30M)
After the SSL was taken:
• Price reacted into nearby OBs but failed to hold
• This was expected — price was seeking stronger discount
• Delivery continued into a 4H origin OB
Once the mid-term LH was broken:
• Price took additional SSL
• Move was engineered into a deeper mid-term OB for proper mitigation
No structure failure — just alignment.
⸻
🔹 Lower-Timeframe Read (5M)
After mitigation of the mid-term OB:
• I dropped to LTF to read structure, not candles
• Mapping structure tells the story — not single candle reactions
• Waiting for internal bullish framework to confirm
Execution comes after alignment, not during drawdown.
⸻
🎯 Trade Plan
I’ll be attending bullish continuations only.
Execution will be based on LTF structural confirmation, not impulse.
I’ll remain active and update later in the week once alignment completes.
⸻
🧠 Mindset Note
Failed near OBs don’t mean the idea is wrong —
they mean price is seeking better pricing.

12.12.25 Daily ForecastPairs on Watch -
FX:AUDUSD
FX:EURGBP
A short overview of the instruments I am looking at for today, multi-timeframe analysis down to what I will be looking at for an entry. Enjoy!

11.12.25 Daily ForecastPairs on Watch -
FX:EURGBP
FX:EURNZD
OANDA:JP225USD
A short overview of the instruments I am looking at for today, multi-timeframe analysis down to what I will be looking at for an entry. Enjoy!

GBPUSD (GU) - Weekly Bullish OutlookHigher-Timeframe Bias:
GU remains bullish. On the HTF, price continues to break significant highs, confirming bullish order-flow and directional intent. Structure is clean — no confusion here.
Middle-Timeframe Context:
Dropping into the mid-timeframes, we can see sell-side liquidity (SSL) taken cleanly. Price reacted off the first orange zone far left, but that reaction didn’t sustain — instead, price delivered a decisive push deeper into the 4H strong order block (OB).
This is where things got interesting:
• Price landed into the 4H OB
• Delivered a professional sweep (not a break — structure held)
• Then printed a midterm CHoCH, confirming bullish continuation intent
Once that midterm CHoCH was confirmed, we immediately had our next point of interest for continuation.
Refined POI:
After clearing sell-side liquidity, price tapped into the nearest orange OB, where structure held on lower timeframes.
We don’t trade candles — we trade structure. And structure told us to prepare for continuations.
LTF View:
On lower timeframes, we’ve already seen multiple clean bullish continuations into the upside. The market is respecting zones, respecting order-flow, and respecting structure.
My Plan for Market Open:
I’ll be patiently waiting for price to revisit and mitigate the internal LTF structure order block.
From that mitigation, I’ll be looking to ride resistance longs targeting:
• Midterm highs
• HTF highs
Direction is set. Structure is clean. Liquidity has been collected.
Now it’s patience until the market opens.
Smart money leads; we follow. Let’s work.

Gold intra-day selling opportunity showed after Fibo & OB bounceXAUUSD (Gold/US Dollar).
Timeframe: 15-minute chart (15m).
Trend Context: The price experienced several increase and decrease but made an imbalance on 1H timeframe yesterday, and it's probably going to decline till closing the FVG on 1h.
There is a major ascending orange trendline acting as dynamic support. The price recently tapped this line and bounced, creating the current upward retracement, but in the last 4 hours, it is showing a probability to break this line down.
I see what I see depending on several reasons:
1. ChoCh (Change of Character) indicating a structural shift that often precedes a retracement or reversal.
2. Fibonacci & Key Levels
The price is trying to bounce back from the golden area of the recent bearish swing (high to low)
0.5 Level (Equilibrium): Located at 4203.330. The price is currently testing this area.
0.618 Level (Golden Zone): Located at 4206.995. This level acts as strong resistance and aligns with the entry zone.
3. Trade Setup (Short/Sell Idea)
The setup is a bearish continuation play, looking to short the market as it retraces into a supply zone.
The entry is just before the OB on 15 min
The target is set near the recent swing low, anticipating that the price will reject the Order Block and fall back down.
⚠️ Note
This is a technical outlook based on my POV to the chart. Always manage risk carefully and adapt if market conditions change
I would be grateful to get your feedback on this idea if you have any opinions to share.
✽ Improve your awareness to seek a great analysis ✔
@AbdullahTech ♾

10.12.25 Daily ForecastPairs on Watch -
FX:EURGBP
FX:GBPUSD
OANDA:AU200AUD
A short overview of the instruments I am looking at for today, multi-timeframe analysis down to what I will be looking at for an entry. Enjoy!

AUDNZD Trade Recap 09.12.25In this recap I break down my AUDNZD short position I took last week using the 4H in combination with the 5M to refine my entry.
Full explanation as to why I executed on this position, using the 4H to my advantage but also understanding why I managed the way I did for a breakeven.
Any questions you have just drop them below 👇

09.12.25 Daily ForecastPairs on Watch -
FX:GBPCAD
FX:AUDCAD
FX:EURGBP
A short overview of the instruments I am looking at for today, multi-timeframe analysis down to what I will be looking at for an entry. Enjoy!

08.12.25 Daily ForecastPairs on Watch -
FX:CADJPY
FX:AUDJPY
FX:AUDUSD
FX:EURGBP
A short overview of the instruments I am looking at for today, multi-timeframe analysis down to what I will be looking at for an entry. Enjoy!

"The Liquidity Trap 90% of Traders Completely Miss"🔥 EVERY TRADER GETS TRAPPED HERE… EXCEPT THE ELITE
You watch the highs and lows, the support and resistance, the obvious levels…
And you think you’re safe.
You’re not.
The real move comes from liquidity inside the swing — the part most traders never notice.
1️⃣ External Liquidity is What Retail Chases… Not the Real Move
• Traders see obvious highs, obvious lows, support, resistance.
• They think: “Price will reverse here.”
• This is the illusion the market creates.
Here’s the truth:
External liquidity is bait, not the target.
It’s where most traders get trapped.
⸻
2️⃣ Internal Liquidity is Where the Smart Money Lives
Inside every swing — every leg up or down — exists hidden liquidity:
• Micro Order Blocks
• Lower highs / higher lows inside the leg
• Stop clusters designed to trigger retail exits
Most traders don’t look inside the leg. They only see the edges.
That’s the trap. That’s where your edge comes in.
Nugget: The move you want usually comes after the internal liquidity is cleared, not at the obvious high/low.
⸻
3️⃣ The Sequence Traders Must See (Stop Losing to the Trap)
Here’s the real SMC sequence, step by step:
A. External Sweep → The Bait
• Everyone watches it
• Everyone reacts
B. Internal Liquidity Run → The Real Target
• Hidden inside the leg
• Where stops, inducements, and OBs cluster
• The market clears this before the real move
C. Displacement → The Delivery
• After internal liquidity clears, price finally moves in the “true” direction
• This is when smart traders enter with confidence
Nugget: If you chase the sweep and ignore internal liquidity, you’re giving your edge to the market.
⸻
4️⃣ How to Spot Internal Liquidity Like a Pro
Look for these patterns inside the leg:
• Lower highs / higher lows forming in micro OBs
• Price clustering around imbalance areas
• Fake breaks that lure retail orders
• Zones where price pauses before real expansion
Golden Nugget: Price gives clues every time. The problem is, 90% of traders don’t see them.
⸻
5️⃣ Why Traders Lose Even When They’re “Right”
• You can have the right bias
• You can see the sweep
• You can even pick the “obvious OB”
But if you enter too early or in the wrong micro-structure, your stop gets taken, and the move happens without you.
This is why SMC isn’t about guessing.
It’s about understanding sequence, intention, and liquidity footprint.
⸻
6️⃣ Mindset Shift: Read Market Intention, Not Candles
Stop asking:
• “Did it break the high?”
• “Did it hit my level?”
Start asking:
• “Where is the internal liquidity being cleared?”
• “What is the smart money engineering?”
• “Where will the market take the stops before the real move?”
Nugget: Reading price action without seeing internal liquidity is like driving blind.
⸻
7️⃣ The SMC Edge You Must Internalize
• External liquidity = bait → observe
• Internal liquidity = real objective → anticipate
• Displacement = delivery → execute
When you see it unfold:
• Your entries become surgical
• Your stops make sense
• Your bias is confirmed before most traders even blink
You’re not reacting to the market.
You’re predicting its intentional sequence.
⸻
🔥 Final Takeaway (Save This)
The market isn’t random.
It’s designed to trap traders.
External liquidity tricks 90% of traders into early stops.
Internal liquidity reveals where the real move will come.
Learn to see it.
Respect it.
Trade it.
This is the real sauce of SMC trading.
Not flashy indicators. Not random setups.
Sequence, liquidity, inducement.
Pro Nugget: Once internal liquidity is in your sights, price becomes predictable.
The rest? Just execution.

AUDCAD - Bullish Outlook | Weekly * MidtermHigher-Timeframe Bias:
AUDCAD is bullish. HTF structure is clean, price has broken major and significant highs, showing clear bullish intent and directional control.
Mid-Term Structure:
On the mid-term perspective, structure is mapped and ready for continuation.
Currently, we’re waiting for:
• A sell-side liquidity sweep
• Inducement taken
• Price falling into the internal-framework OB just underneath
Once full mitigation occurs, we drop to lower timeframes for confirmation.
Lower-Timeframe Execution:
On LTF, we’re looking for:
• Internal micro lower-high break
• Pullback within the bullish leg
• Entry points to target:
• Mid-term highs
• HTF highs
• LTF highs
Plan:
Until the market opens, we stay patient.
Smart Money leads direction; we track footprints. Our job is to monitor structure, map zones, and execute when the algorithm delivers.
Patience is key. Follow the footprints. Let’s go.

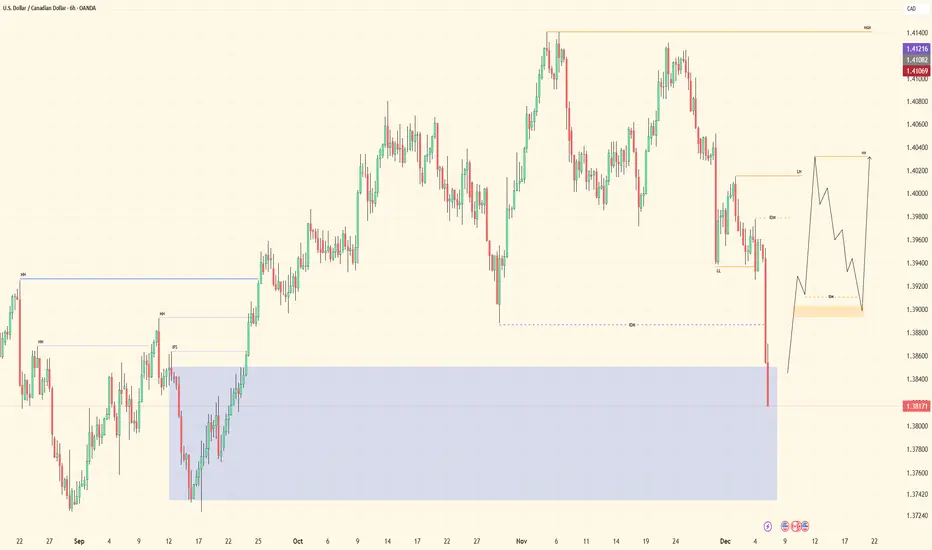
USDCAD - Bullish Outlook | Weekly * Midterm Higher-Timeframe Bias:
USDCAD is bullish. HTF structure is clean — price has broken major and significant highs to the left, maintaining a clear bullish trajectory.
Mid-Term Structure:
Price initially disrespected the mid-term flow but landed into a HTF internal-framework structure zone.
• From here, we wait for a mid-term CHoCH (trend change)
• Once the CHoCH occurs and a new POI is refined, the plan is:
• Wait for mitigation
• Drop to lower timeframes to play continuations
Execution Approach:
This setup will take time to fully develop. Until then, we track price, follow the footprints, and remain aligned with structure.
Plan for the Week:
We stay patient and observe — let Smart Money lead the direction.
Structure first, entries second.
Patience is key. Follow the footprints. Let’s go.
USDCHF - Bullish Outlook | Weekly * MidtermHigher-Timeframe Bias:
USDCHF remains bullish. Price has maintained clear HTF bullish structure, breaking highs and respecting higher-high / higher-low sequencing. Corrections have been deep, but structure remains intact.
Mid-Term Structure:
From the mid-term perspective:
• Price took out sell-side liquidity
• Mitigated both mid-term and HTF order blocks
• When price reached the HTF OB, we normally wait for a mid-term CHoCH
However, lower-timeframe structure is cleanly holding within the mid-term OB, giving confidence that continuation is intact.
Lower-Timeframe Execution:
While the LTF micro charts aren’t physically visualized here, from a broader bird’s-eye view:
• Price switched lower-timeframe structure
• Delivered bullish push power toward mid-term and HTF highs
• Inducement and engineered liquidity were taken in the green structure far to the right
Lower-timeframe entries will be looking to ride continuation, targeting:
• 5-minute highs
• Mid-term highs
Plan:
Until market opens, we remain patient, observing how Smart Money directs price.
If price doesn’t give our ideal setup, we track, monitor, and adjust — no cracks, no forced entries.
The Job:
Map structure → Track footprints → Follow the flow.
Patience is key. Let Smart Money lead. Let’s go.

EURGBP - Bullish Outlook | Weekly * MidtermHigher-Timeframe Bias:
EURGBP remains bullish. On the HTF, we have a clean, event-driven structure:
Price has been breaking major highs, pushing the market into higher-high / higher-low context and maintaining bullish order-flow.
Mid-Term Structure:
On the mid-term perspective, I’m looking to attend continuations.
Inside the structure, this is what we see:
• Price took out the inducement from the top
• Engineered liquidity was collected
• Price fell into a thin, refined internal-framework structure order block (the orange line that might be hard to see)
However, while we did get an initial bullish reaction, price pushed deeper — tapping directly into the higher-timeframe internal-framework structure order block.
That deeper tap is the true reaction point.
Next Step — Midterm CHoCH:
From the HTF OB, we wait for:
• A mid-term CHoCH (trend change)
• A new refined mid-term POI to form
Once that refined POI forms, the plan is:
1. Wait for the inducement above the refined POI to be taken
2. Let price fall back into the mid-term order block
3. Once mitigated — drop down to LTF
Lower-Timeframe Execution:
After dropping to LTF, the model is simple:
• Wait for the internal LTF lower-high break
• Get the pullback inside the bullish leg
• Execute longs targeting:
• Mid-term highs, and
• Higher-timeframe highs
This keeps our entries aligned with both direction and structure.
The Approach:
We stay patient and we let Smart Money reveal the next step.
If price shifts deeper or accelerates early, we simply adjust — because our job is to track the footprints, map structure, and follow delivery.
Patience is key. Structure is king. Let’s work.

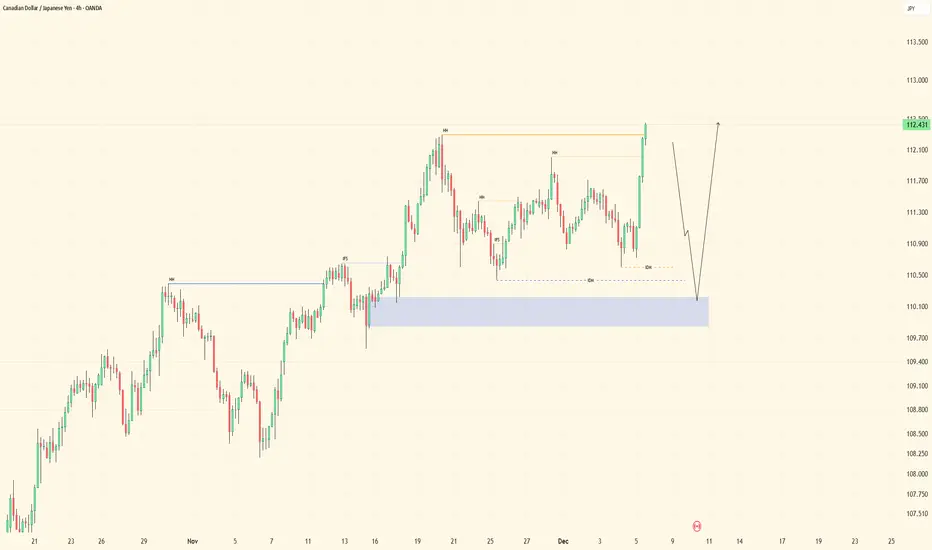
CADJPY - Bullish Outlook | Weekly * MidtermHigher-Timeframe Bias:
CADJPY remains bullish. HTF structure is clean, visual, and directional — price continues to respect bullish order-flow, confirming upward intent.
Mid-Term Perspective:
Going into the upcoming week, we’re looking for continuations.
I’m waiting on a sell-side liquidity sweep, but keep in mind:
Price is moving with strong volume and has already cleared mid-term highs.
That type of aggressive delivery typically leads to:
• A clean sweep of the current leg
• Followed by price dropping into the higher-timeframe order block below
That HTF OB is where the meaningful reaction is expected.
Important Note — Patience With LTF:
When price drops directly into a HTF structure, we do not jump straight to lower timeframes.
Reason:
LTF can easily be pushed around inside a HTF zone — it’s “big boy structure.”
Instead, we follow a disciplined, top-down sequence.
Execution Sequence:
1. Wait for price to sweep sell-side liquidity
2. Expect a drop into the HTF order block
3. Do not go to LTF yet
4. Wait for a mid-term CHoCH off the strong HTF zone
5. Once mid-term structure confirms, refine the POI
6. After mitigation of the refined mid-term POI → then drop to LTF for confirmation
This is the proper mapping sequence — a clean top-down approach.
If Price Doesn’t Follow Our Steps:
No panic, no emotion.
We simply:
• Track price
• Monitor delivery
• Follow the footprints
That’s our job as day traders — observe, map, adjust.
Plan:
We wait for market open.
We let Smart Money align the direction.
Then we execute with precision.
Patience is key. Follow the footprints. Let’s go.
GBPJPY (GJ) - Bullish Outlook | Weekly * MidtermHigher-Timeframe Bias:
GBPJPY remains bullish. On the HTF, price continues breaking major highs, printing a clean sequence of higher-highs and higher-lows. Direction is clear, structure is controlled, and Smart Money is maintaining bullish flow.
Mid-Term Perspective:
On the mid-term view, we want to play continuations. Price is currently sitting at a high, and the next step we’re waiting for is:
• A sell-side liquidity sweep,
• Followed by price falling into our internal-framework structure order block sitting underneath the inducement.
Once mitigation occurs, we move into execution mode.
Lower-Timeframe Execution Plan:
After price taps the refined OB, we want LTF confirmation:
• A trend change
• A clean internal LTF lower-high break
• Then a pullback into the bullish leg for our entry
From there, targets are:
• Mid-term highs
• Higher-timeframe highs
If Price Violates the Zone:
If price violates the orange zone and dips deeper — no fear, no panic.
We simply:
• Reassess
• Pull up the PD grid
• Locate the next valid order blocks in discounted territory
The OB we’re currently working with is aligned with near structure and current order-flow, but deeper discount is still valid if price chooses that path.
If Price Keeps Climbing:
If price continues pushing higher without giving our sweep/mitigation, that’s fine too.
We track the footprints, stay aligned with structure, and wait for the next clean opportunity.
Plan:
Direction is clear. Liquidity is in place. Structure is clean.
We stay patient, wait for Smart Money to reveal the next step, and execute when the algorithm delivers.
Patience is key. Follow the footprints. Let’s go.

AUDJPY (AJ) - Bullish Outlook| Weekly * MidtermHigher-Timeframe Bias:
AUDJPY is bullish on the high-term perspective. Price has been breaking major highs and significant highs, leaving us positioned at a precise, pinpoint high on the HTF.
Direction is clean — Smart Money is clearly leaning upward — so we continue to favor bullish continuations.
Mid-Term Structure:
On the mid-term perspective, structure is also bullish. Price already broke another significant high, keeping the continuation narrative intact.
Now the next steps are simple:
• Price needs to clear the volatility leg,
• Take out the side liquidity, and
• Then mitigate into our mid-term internal-framework structure order blocks
That mitigation gives us our refined POI.
Lower-Timeframe Execution:
Once price taps that mid-term OB, I’ll be dropping down to the LTF to confirm direction through:
• A clean LTF lower-high break,
• A sell-side liquidity sweep, and
• Structure holding inside the refined OB
When those align, I’ll be looking to ride longs toward mid-term highs and then HTF highs.
If Price Skips the Sweep:
If price refuses to sweep the side liquidity first, then we simply track the footprints as it falls into liquidity on the way down.
Never forcing the market — always following the algorithmic path.
Plan for Market Open:
Until market opens, we stay patient and let Smart Money lead direction.
We trade the footprint — not emotions.
Patience is key. Follow the footprints. Let’s go.

USDJPY (UJ) - Weekly Bullish OutlookHigher-Timeframe Bias:
USDJPY remains cleanly bullish. HTF structure is intact, with price consistently breaking major highs and pushing into new significant levels. Order-flow is controlled and directional — Smart Money is clearly favoring the upside.
From this perspective, we seek continuations, not reversals.
Mid-Term Structure Read:
On the mid-timeframe, structure is fully mapped out. Price recently swept sell-side liquidity, tapping directly into a refined internal-framework structure order block.
Once price entered that narrowly refined zone, we saw:
• Structure holding
• Rejection wicks protecting the level
• Clear evidence Smart Money had no intention of continuing a bearish phase
This zone is extremely refined on the mid-term view, so visually it may appear thin — but the reaction confirms its legitimacy.
Lower-Timeframe Expectations:
Going into market open, I’m waiting for:
1. A clean LTF lower-high (LH) break
2. A sell-side liquidity sweep
3. Price falling into the internal structure OB for mitigation
Once those three steps complete, I’ll be looking to execute longs with targets set toward:
• Mid-term highs, and
• Higher-timeframe highs
Plan:
Bias is bullish. Liquidity has been collected. Structure is holding.
Now we wait for LTF confirmation to align with the smart-money footprint.
Patience until market open — then let the algorithm deliver.
Let’s work.

05.12.25 Daily ForecastPairs on Watch -
FX:EURUSD
FX:AUDUSD
A short overview of the instruments I am looking at for today, multi-timeframe analysis down to what I will be looking at for an entry. Enjoy!
