AUDCAD| Bullish HTF Outlook |Mid-Range Inducement PlayHigh Timeframe (HTF):
AUDCAD remains bullish, printing higher highs and higher lows within a dominant trending environment. We’re currently sitting inside a range, but the broader narrative still supports upside continuation once liquidity objectives are satisfied.
Mid-Term View:
Price previously respected a mid-term order block sitting to the left. After breaking that level, instead of fully remapping the top-down, I chose to track price behavior dynamically — sharpening the eyes, sharpening the skill.
Price delivered a clean inducement sweep, but rather than continuing from the mid-range, it decided to dig deeper for more liquidity. It engineered liquidity around the second OB, which then became the holding point as we shifted into a mean-range consolidation.
Internal Structure:
Once price swept low-end liquidity, the micro-structure inside the range flipped bullish.
That sweep + micro shift = the reaction I wanted.
I executed buys after the engineered liquidity was taken and price fell into the mitigation zone beneath the range.
Intent:
HTF still shows bullish intent aiming to take out higher objectives.
LTF is aligned — LH break, micro BOS, and mitigation respected.
Now I’m simply holding, waiting for market open and clean follow-through from smart money.
Mindset:
Follow the footprints.
Let the delivery unfold.
Patience pays.
Structure

EURCAD| BULLISHHTF (4H / 6H / Daily):
Structure is breaking significant highs with clear upside momentum. We have a clean corrective phase forming on the right side, and price took out major IDM. No HTF OB mitigation yet, but the mid-term demand is fully confirmed.
Price turned bullish immediately after the HTF sweep — confirming directional intent.
⸻
MTF (30M / 1H):
Price swept SSL, fell directly into our mid-term order block, and gave a full mitigation rotation.
From there, structure held firm and continued delivering higher.
That told me the demand is active and the bullish leg is valid.
⸻
LTF Confirmation (5M → 1M):
Once the trend shift completed, everything aligned.
Price gave:
• the SSL sweep,
• the mitigation,
• the shift,
…which was my green light to go.
From that point, price engineered deeper liquidity, re-tapped the OB, and climbed again with strong bullish momentum. The move even synced perfectly with the 6H 50% candle alignment, showing continuation strength.
⸻
Going Forward:
Holding my bias.
Now I just want to see where Smart Money leads us into market open — structure is clean and the story is clear.

XAUUSD INTRADAY – Breakout + Retest Reaction SetupFOREXCOM:XAUUSD
Key Scenarios
✅ Bullish Case (Primary Bias)
If price holds the 4060–4070 retest zone and prints bullish confirmation, buyers may target:
🎯 1st Target: 4105–4112
🎯 2nd Target: 4150–4165
This scenario remains valid as long as price stays above 4040.
❌ Bearish Case (Invalidation Trigger)
If price fails to hold above 4040 and breaks below the demand zone, a deeper sell-side expansion may follow toward:
Only a clean break below 4040 shifts sentiment bearish.
Current Levels to Watch
Supply Zone: 4060–4075
Support Zone / Entry Interest: 4045–4040
Key Demand: 4025–4035
Major Resistance: 4165–4175
⚠️ Disclaimer:
This analysis is for educational purposes only. It is not financial advice. Please manage risk and trade based on your own strategy.

PEPEUSDT is near major weekly support also trendline retest herePEPEUSDT appears to be concluding its bearish phase, with price action having breached a significant daily support level. The asset is now undergoing a critical retest of the broken trendline a common technical phenomenon where former Resistance(Red trendline) transforms into support . A successful rejection from this level could catalyze a robust bullish reversal. Based on the magnitude of the preceding decline and the strength of this support zone, we project a potential upward movement with an estimated appreciation target of 200% upon confirmed breakout confirmation.
DISCLAIMER: ((trade based on your own decision))
<<press like👍 if you enjoy💚

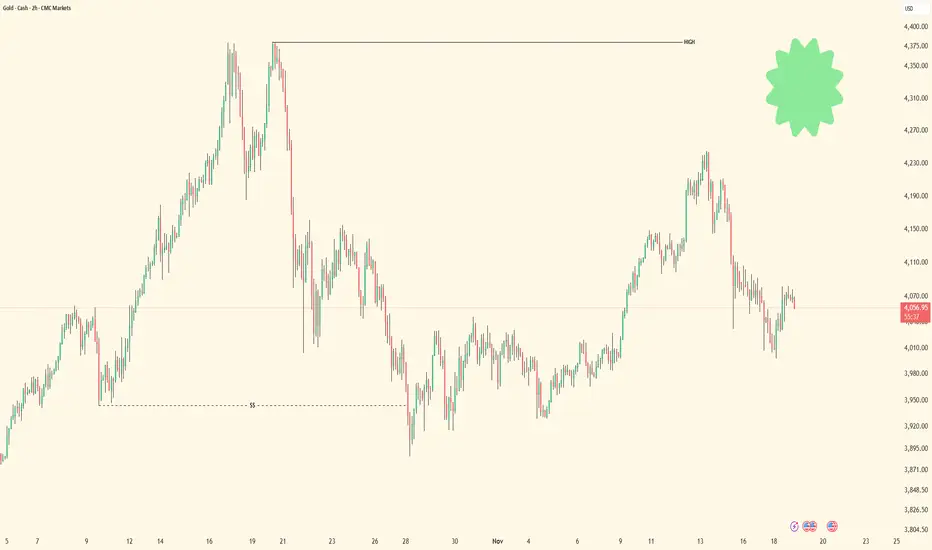
XAUUSD On the 1-hour chart, Gold is currently trading inside a tight symmetrical triangle, with price compressing between a rising trendline from the November 5th lows and a descending trendline from the November 14th highs.
Price is hovering around the $4,070 zone, which also aligns with the 50-period moving average, showing indecision but increasing pressure for a breakout.
A break and retest above the $4,085–4,095 resistance zone (highlighted in grey) may trigger a bullish momentum wave. The projected breakout target points toward the $4,180–4,220 region, based on the measured move from the previous swing.
As long as price holds above the rising trendline support, the structure remains bullish, with buyers expected to step in on any retest of support.

The Hard Truth About Trading: Too Much Knowledge is Hurting you A real breakdown for traders who actually want clarity, not confusion.
Most traders don’t fail because they’re “missing a secret concept.”
They fail because they’re drowning in information that doesn’t matter.
The truth is simple:
The more clutter you add, the less you can see.
The less you can see, the slower you think.
The slower you think, the more you hesitate.
Hesitation kills traders.
Let’s strip the ego out and get direct:
⸻
📍 1. The Market Only Runs on a Few Core Realities
Everything you see on the chart — every candle, every sweep, every displacement — connects back to a small handful of factors:
• External structure (macro swing flow)
• Internal structure (micro order flow)
• Premium/discount pricing
• Inducements / engineered liquidity
• Order flow shifts at key levels
• Narrative alignment across HTFs
That’s it.
No magic indicator.
No super-obscure model.
No 99-step “advanced SMC” blueprint.
If it’s not tied to structure or liquidity within structure,
it’s irrelevant noise.
⸻
📍 2. More Knowledge ≠ More Skill
Trading isn’t school.
You don’t get rewarded for memorizing more concepts.
Most of the “extra knowledge” traders chase only creates:
• Paralysis
• Over-marked charts
• Conflicting signals
• Emotional swings
• Analysis loops
• Missed moves
Pros don’t hunt for more concepts — they refine fewer ones.
The people who win long-term master what’s essential, not what’s trendy.
⸻
📍 3. Liquidity Without Structure Is Useless
A massive mistake in the community is labeling every high/low as “liq.”
Not true.
Not all sweeps are equal.
Not all liquidity is engineered.
Not every takeout is meaningful.
The only liquidity that matters is:
• IDM / engineered liquidity (purpose-driven)
• Inducements that fuel the real move
• Liquidity aligned with the HTF order block and narrative
Everything else?
Just market noise dressed up with fancy terminology.
⸻
📍 4. A Clean Blueprint Beats a Complicated One
The more experienced I became, the more I realized:
Trading mastery is deletion, not addition.
When you cut away unnecessary concepts, what’s left is:
• Cleaner charts
• Faster decisions
• Simpler narratives
• Higher confidence
• Fewer emotional flips
• More consistency
A trader with a refined system will always outperform a trader with a “complicated system.”
⸻
📍 5. Here’s the Real Pipeline of a Professional SMC Trader
If you want to win consistently, your process should be this clear:
HTF trend →
Premium/discount →
Identify the inducement →
Locate the OB →
Wait for the internal structure shift →
Execute with precision
That’s the Smart Money engine.
That’s the whole formula.
Everything else is just reworded versions of the same thing.
⸻
📍 Final Thought for Anyone Reading This
If you feel overwhelmed, confused, or inconsistent…
it’s not because you don’t know enough.
It’s because you know too much of the wrong things.
Trading becomes consistent when your blueprint becomes simple.
Less noise.
More clarity.
More precision.
More profits.
Strip the chart back to what matters —
and the market finally starts to make sense.

EURGBP | Bullish OutlookHTF Perspective:
Higher timeframe structure mapped and refined. Strong liquidity sits at 0.87623. Macro structure is bullish, reinforcing the upward trend.
MTF Perspective:
Mid-term mapped and followed. We spotted a sell-side liquidity sweep, after which price fell into near internal framework OBs, including a micro block underneath. This zone shows buy interest forming.
LTF Execution:
Waiting for lower timeframe confirmation to validate the shift/change. Once confirmed, buy points will be taken along the bullish leg targeting continuation into HTF highs.
Current Outlook:
Until LTF alignment occurs, we let Smart Money lead direction. Patience and discipline remain priority.
Let’s go!

CADJPY | Bullish OutlookHTF Perspective:
Higher timeframe remains bullish. Structure mapped and refined. Price broke significant highs, with HTF liquidity sitting at 109.558, a strong level to monitor. The macro bias is bullish, preparing for continuation.
MTF Perspective:
Mid-term mapped, spotting a sell-side liquidity sweep. Once liquidity is taken, price falls into our internal framework OBs, creating decisional zones for potential continuation plays.
LTF Execution:
Lower timeframes will confirm the shift/change in trend. Full candle bodies into the OB are required before considering entries — structure must validate the move.
Current Outlook:
Until LTF confirmation, we let Smart Money lead direction. Patience is key; no forcing trades.
Let’s go!

AUDCAD | Bullish Outlook
HTF Perspective:
Higher timeframe structure remains bullish. Price has been forming multiple courtyards (internal structures), signaling preparation for the next move.
MTF Perspective:
Waiting for the deep sell-side liquidity to be taken. So far, price is showing lower highs forming, which could act as resistance and indicate potential downward pressure.
LTF Execution:
If price reaches the mid-term order block, we’ll drop to lower timeframes to confirm structure and entries. Watch for lower-high breaks or flips before committing to continuation plays.
Current Outlook:
Until confirmations occur, we let Smart Money lead the direction. Patience is key — no forcing trades.
Let’s go!

EURCAD | Bullish OutlookHTF Perspective:
Higher timeframe structure is bullish. Price is breaking significant highs with clean formations, confirming continuation bias.
MTF Perspective:
Mid-term view aligns with the bullish trend. After waiting for the sell-side liquidity sweep, price delivered the sweep and fell into our mapped order blocks. This provides the key decision zones for continuation.
LTF Execution:
On lower timeframes, we confirmed structure (shift of character). From there, buy positions were taken targeting mid-term and HTF highs.
Current Outlook:
Waiting for the market open to see continuation toward the upside. Let Smart Money lead the direction.
Let’s go!

AUDJPY | Bullish OutlookHTF Perspective:
Higher timeframe remains bullish. Price is breaking significant highs, confirming the bullish macro structure.
MTF Perspective:
On the 30-minute timeframe, we spotted a sell-side liquidity sweep. Price took that liquidity and pulled into our internal framework OB sitting underneath. This OB represents a key mitigation zone.
LTF Execution:
From here, we’ll drop to lower timeframes to confirm the testing area:
• Look for lower-high break
• Pullback on the bullish leg
• Take buy points targeting mid-term and higher-timeframe highs
Mindset:
Until LTF confirmation, let Smart Money lead direction. Patience and discipline remain priority.
Let’s go!

CHFJPY | Bullish OutlookHTF Perspective:
Higher timeframe remains bullish. Price is making significant breaks to the upside, continuing the bullish narrative.
MTF Perspective:
Mid-term structure is aligned with the trend. We waited for the sell-side liquidity sweep, which has occurred. Price has now fallen into our near internal framework OB.
We’re observing if this OB holds as a reaction zone. If not, the next OB below becomes the true decisional zone. Both testing areas have the potential to flip back to bullish, setting up a continuation toward breaking major highs.
LTF Execution:
Lower timeframes will provide confirmation through structure shifts and inducements. Until then, we let Smart Money lead the direction.
Mindset:
Patience > prediction. Wait for clean confirmations. Let price do the talking.
Let’s go!

EURJPY | Bullish OutlookHTF Bias: Bullish
Higher timeframe structure remains clean to the upside. Macro momentum is still favoring continuation.
MTF View:
Mid-term structure aligns with the bullish trend. After the sell-side liquidity sweep, we want price to fall into our near internal framework OB before looking for the next leg.
LTF Execution Plan:
Once price reaches that OB, drop to lower timeframes (5M and below) to confirm:
• Lower-high break signaling a shift/change in trend
• Price pulling back into the refined OB to align with the trend continuation
Until then, we wait and let Smart Money lead the direction.
Patience and discipline over forcing moves.
Let’s go.

GBPJPY | Bullish OutlookThe higher timeframe remains firmly bullish, so the macro direction is already set.
Right now, it’s all about letting price complete the cleanup phase before we position for continuation.
⸻
🔹 HTF Narrative (4H & Above):
• Market is in a clear bullish structure
• We already broke a previous Higher High (HH)
• Now we’re waiting for price to clean out sell-side liquidity
• After the sweep, expectation is a drop into our Turn-Off Framework OB (the refined HTF demand)
Nothing to force — smart money is setting up the next leg.
⸻
🔹 Mid-Term Structure (30M – 2H):
The midterm flow is simple:
• Bias remains bullish
• We just need the sell-side sweep to confirm the discount pricing
• Once price taps the midterm OB inside the HTF zone, we’ll reassess order flow
• This becomes the first part of your 1–2 midterm continuation sequence
We’re waiting for price to come home before the trend resumes.
⸻
🔹 LTF Execution Layer (5M):
This is where the continuation becomes tradable.
What we’re waiting for:
• A clean Lower High (LH) breach to confirm the LTF shift
• A controlled pullback into a refined OB
• Continuation of the bullish leg once structure and order flow align
This is the classic 1–3–10 continuation pattern:
1. Sweep
2. Shift
3. Pullback
4. Trend expansion
Once all three layers line up, the continuation becomes high probability.
⸻
🔹 Final Outlook:
Right now, it’s simple:
Sweep → Tap Framework OB → LTF Flip → Continue Bullish.
Until that sequence completes, we wait for smart money to set the direction.
Let price come to us — not the other way around.
Let’s work.

GBPUSD | Bulish Bias After SSL Sweep
The higher timeframe continues to confirm a bullish environment.
Price swept the sell-side liquidity and tapped directly into a strong 4H demand zone, showing clear intention from institutions to accumulate at discounted territory.
That sets the macro narrative: HTF bullish.
⸻
🔹 HTF Narrative (4H & Macro):
• Major SSL sweep completed
• Price reached deep into discounted territory
• Clean reaction from 4H demand
• HTF structure still intact on the bullish side
• Displacement out of demand confirms higher timeframe control
This is where the shift begins: liquidity taken → premium to discount → demand mitigation → displacement.
⸻
🔹 Mid-Term Structure (30M – 2H):
This is where the bullish argument truly aligns.
• A Lower High (LH) was broken, creating the first real structure shift
• That break delivered a clear CHoCH, confirming bullish intent
• Price then reached into a refined OB inside discounted territory
• This OB becomes our decisional structure point, aligning perfectly with HTF demand
Mid-term confirms the path:
Sweep → shift → return to discount → decisional OB → continuation.
You’re now fully aligned top-down.
⸻
🔹 LTF Execution Layer (5M):
This is the part that confirms whether the macro narrative deserves entries.
Price behavior delivered exactly what we needed:
• LTF respected structure perfectly
• Minor LHs were breached, confirming a micro shift
• The internal flip aligns with the mid-term CHoCH
• After liquidity was taken, price began respecting the bullish order flow
This is your 5M green light:
LTF break of structure + liquidity taken + order flow flip.
When top-down aligns like this, it’s clean, mechanical, and consistent.
⸻
🧠 Final Notes:
The entire flow is textbook:
HTF sweep → Demand reaction → Mid-term CHoCH → OB in discount → LTF flip → Move with price.
Nothing forced.
Nothing chaotic.
Just structure doing exactly what it’s supposed to.

GBPCHF - Bears Waiting at Structure… Trend Shorts Ahead!📉GBPCHF remains overall bearish, trading inside a clean falling channel for months. Every rally has been capped by the upper bound of the channel, making it a strong dynamic resistance level.
As price approaches the orange structure zone, which aligns perfectly with the upper boundary of the falling channel, we will be looking for trend-following shorts. This area has rejected price multiple times and continues to act as a major barrier for the bulls.
As long as GBPCHF stays below this structure, the bearish trend remains in full control. A rejection from this zone could lead to another move toward the lower bound of the channel. Only a clean break and hold above the orange structure would weaken the bearish outlook.
We now watch the reaction… will the bears defend the trend once again? 🤔
⚠️ Disclaimer: This is not financial advice. Always do your own research and manage risk properly.
📚 Stick to your trading plan regarding entries, risk, and management.
Good luck! 🍀
All Strategies Are Good; If Managed Properly!
~Richard Nasr

21.11.25 Morning ForecastPairs on Watch -
FX:AUDUSD
FX:EURUSD
FX:CADJPY
FX:GBPJPY
A short overview of the instruments I am looking at for today, multi-timeframe analysis down to what I will be looking at for an entry. Enjoy!

GBPCAD – Triple Tap Trouble!GBPCAD has been trading within a well-defined range, with price rejecting the 1.8850 resistance zone multiple times in the past.
Each test of this area has led to strong bearish moves, highlighting its significance as a supply zone.
Here’s what the chart shows:
🔴 Resistance Zone: Price is approaching the upper bound of the range, where sellers have consistently stepped in.
🔵 Support Zone: The 1.8300 area remains a solid demand zone, holding price higher on several occasions.
📈 Rising Channel: The latest bullish leg is developing inside an ascending channel, but momentum is slowing near resistance.
⚠️ Short Opportunity: As long as price trades below the resistance, the area remains attractive for short setups targeting the mid-range or lower bound.
Confirmation with bearish candlestick patterns will strengthen the case for a downside move.
📌 Will GBP/CAD respect its range and roll over once again, or will the bulls finally break through?
This analysis is for educational purposes only, not financial advice. Always manage risk properly before taking trades.
📚 Stick to your trading plan regarding entries, risk management, and trade execution.
Good luck!
All Strategies Are Good; If Managed Properly!
~Richard Nasr

20.11.25 Morning ForecastPairs on Watch -
FX:GBPCAD
FX:NZDJPY
FX:GBPUSD
A short overview of the instruments I am looking at for today, multi-timeframe analysis down to what I will be looking at for an entry. Enjoy!

19.11.25 Morning ForecastPairs on Watch -
FX:EURUSD
A short overview of the instruments I am looking at for today, multi-timeframe analysis down to what I will be looking at for an entry. Enjoy!

"The Myth of Confirmation - What Retail Gets Wrong Every Day"🔥 THE TRUTH ABOUT MARKET “CONFIRMATION” (What Retail Never Realizes)
Most traders think confirmation comes from indicators, patterns, candle shapes, or repeating formations on lower timeframes.
This is the greatest misunderstanding in trading.
Confirmation does NOT come from the LTF.
Confirmation comes from alignment of the delivery cycle — and the LTF only expresses what the HTF already decided.
Retail thinks the 5M “creates” trend.
Institutions know the 5M merely reflects it.
Here’s the real breakdown institutions use:
⸻
1. Confirmation = Completion of a Phase, Not a Pattern
A market only confirms when a structural phase fully completes, meaning:
• Liquidity objective hit
• Internal structure reset
• Order flow aligned
• Efficient price or imbalance corrected
• Pullback cycle finished
• New impulsive leg prepared
This is confirmation.
Not a candle.
Not an indicator.
Not a shape on your chart.
⸻
2. LTF Structure Means NOTHING Without HTF Context
Retail loves reacting to:
• 5M BOS
• 1M pullback
• 15M FVG
• Candle patterns
• Trend lines
None of these matter if the HTF hasn’t finished its development cycle.
This is why traders lose:
They see “confirmation” while the HTF is still in a build-up, not a release phase.
⸻
3. The Market Confirms Twice — Retail Only Sees One
Institutional traders track two confirmations:
Macro Confirmation (HTF)
This tells the market what it wants to do next
— continuation or pullback.
Micro Confirmation (LTF)
This tells the market when it’s safe to execute
— trend shift + pullback + OB tap + displacement.
Retail only waits for micro confirmation.
They skip macro confirmation.
So they trade inside noise.
⸻
4. Candles Don’t Confirm — the Cycle Confirms
People over-read 5M candles, ignoring the fact that candles are only expressions of liquidity movement.
You can’t read intent from shape.
You read intent from position in the cycle.
The same candle means:
• continuation in one phase
• reversal in another
• manipulation in another
Only the cycle gives it meaning.
⸻
5. The Market Doesn’t Confirm For You — It Confirms ITSELF
This is the coldest truth most will never learn:
Price never confirms your bias.
Price only confirms where it is in the timeline.
If you don’t know the timeline,
you don’t know the confirmation.
TL;DR
(Beginner/Simple)
Confirmation = Cycle Completion + Alignment
NOT a candle pattern or indicator.
You don’t follow confirmation.
You follow timing.
18.11.25 Morning ForecastPairs on Watch -
FX:EURAUD
FX:EURUSD
A short overview of the instruments I am looking at for today, multi-timeframe analysis down to what I will be looking at for an entry. Enjoy!

A High-Impact Support Zone Meets a Breakout StructureIntroduction
Markets occasionally compress into areas where structure, momentum, and historical buying pressure align with surprising precision. When that compression occurs at a major higher-timeframe floor, traders often pay closer attention—not because the future is predictable, but because the chart reveals a location where price behavior typically becomes informative.
The current case study centers on a market pressing into a high-impact support zone visible on the monthly chart, while the daily chart displays a falling wedge pattern that has gradually narrowed the range of movement. This combination often highlights moments where the auction process is nearing a decision point. The purpose here is to dissect that confluence using multi-timeframe structure, pattern logic, and broad order-flow principles—strictly for educational exploration.
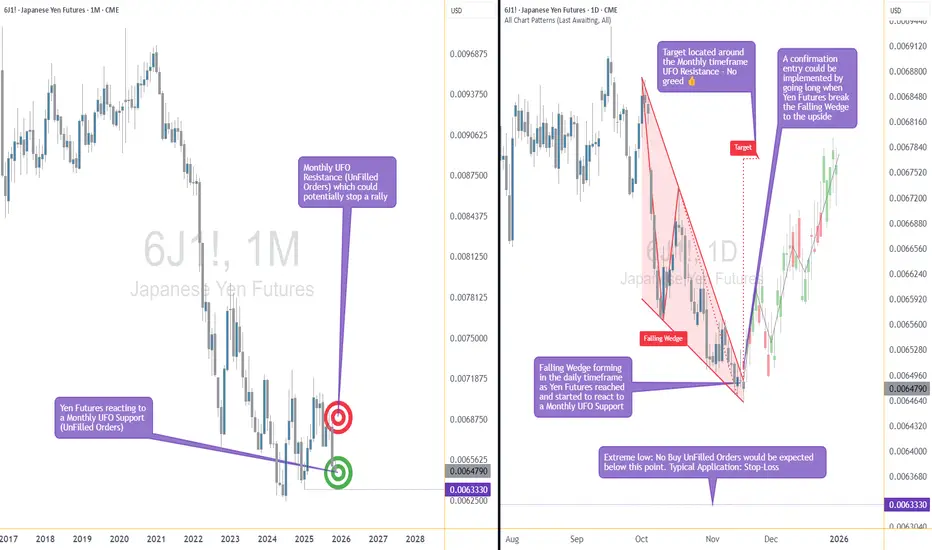
Higher-Timeframe Structure (Monthly)
The monthly chart shows price approaching a well-defined support area between 0.0065425 and 0.0063330, a region that has acted in the past as a base for significant reactions. These areas often develop because markets rarely absorb all buy interest in a single pass; pockets of unfilled orders may remain, leading to renewed reactions when price returns.
This type of zone does not guarantee a reversal. However, historically, when price reaches such levels, traders tend to monitor whether selling pressure slows or becomes less efficient. In this case, the structure suggests a recurring willingness from buyers to engage at these prices, forming a foundation that has held multiple swings.
The presence of a clear, higher-frame resistance at 0.0067530 anchors the broader range. When price rotates between such boundaries, the monthly context often acts as a roadmap: major support below, major resistance above, and room in between for tactical case-study exploration.
Lower-Timeframe Structure (Daily)
Shifting to the daily chart, price action has carved a falling wedge, a pattern often associated with decelerating downside movement. In wedges, sellers continue to push price lower, but with diminishing strength, as each successive low becomes less effective.
This type of compression structure can provide early evidence that the auction is maturing. Traders studying such patterns often watch for:
tightening of the range,
shorter waves into new lows,
initial signs that buyers are defending intraday attempts to drive price lower.
The daily wedge in this case sits directly on top of the monthly support zone—an alignment that strengthens its analytical relevance. The upper boundary of the wedge sits near 0.0065030, and a break above that line is often interpreted as price escaping the compression phase.
Multi-Timeframe Confluence
Multi-timeframe confluence arises when higher-frame structure provides the background bias and lower-frame patterns offer the tactical trigger. In this case:
The monthly chart signals a historically responsive support zone.
The daily chart shows structural compression and slowing downside momentum.
The interaction between them creates a scenario where educational case studies tend to focus on breakout behavior, as the daily timeframe may provide the first evidence that higher-frame buyers are engaging.
This confluence does not imply certainty. It simply highlights a location where structure tends to become more informative, and where traders often study the transition from absorption to response.
Order-Flow Logic (Non-Tool-Specific)
From an order-flow perspective, strong support zones typically develop where prior buying activity left behind unfilled interest. When price returns to that region, two things often happen:
Sellers begin to encounter difficulty driving price lower, as remaining buy orders absorb their activity.
Compression patterns form, as the market oscillates in a tightening range while participants test whether enough liquidity remains to cause a directional shift.
A breakout of the daily wedge represents a potential change in the auction dynamic. While sellers are still active inside the wedge, a breakout suggests their pressure may have become insufficient to continue the sequence of lower highs and lower lows. Traders studying market transitions often use such moments as part of hypothetical scenarios to understand how imbalances evolve.
Forward-Looking Trade Idea (Illustrative Only)
For educational purposes, here is how a structured case study could frame a potential opportunity using the discussed charts:
Entry: A hypothetical entry could be placed above the falling wedge, around 0.0065030, once buyers demonstrate the ability to break outside the compression structure.
Stop-Loss: A logical invalidation area in this case study would be at or below the monthly support, around 0.0063330, where failure would indicate the higher-timeframe zone did not hold.
Target: A purely structural wedge projection would suggest a target near 0.0067695, aligning closely with the broader resistance region on the monthly chart.
These price points yield a reward-to-risk profile that is measurable and logically linked to structure, though not guaranteed. This case study exists solely to illustrate how support-resistance relationships and pattern logic can be combined into a coherent, rules-based plan, not as an actionable idea for trading.
Yen Futures Contract Context
The larger (6J) and micro-sized (MJY) versions of this futures market follow the same underlying price but differ in exposure and margin scale. The standard contract generally carries a greater notional value and therefore translates each price movement into a larger monetary change. The micro contract mirrors the same structure at a reduced size, allowing traders to adjust position scaling more precisely when navigating major zones or breakout structures such as the one discussed in this case study:
6J equals 12,500,000 Japanese Yen per contract, making it suitable for larger, institutional players. (1 Tick = 0.0000005 per JPY increment = $6.25. Required Margin = $2,800)
MJY equals 1,250,000 Japanese Yen per contract, making it suitable for larger, institutional players. (1 Tick = 0.000001 per JPY increment = $1.25. Required Margin = $280)
Understanding margin requirements is essential—these products are leveraged instruments, and small price changes can result in large percentage gains or losses.
Risk Management Considerations
Strong support zones can attract interest, but risk management remains the foundation of any structured approach. Traders studying these transitions typically:
size positions relative to the distance between entry and invalidation,
maintain clear exit criteria when structure fails,
avoid adjusting stops unless the market has invalidated the original reasons for the plan,
adapt to new information without anchoring to prior expectations.
These principles emphasize the importance of accepting uncertainty. Even at major support zones, markets can remain volatile, and scenarios may unfold differently than anticipated.
When charting futures, the data provided could be delayed. Traders working with the ticker symbols discussed in this idea may prefer to use CME Group real-time data plan on TradingView: www.tradingview.com - This consideration is particularly important for shorter-term traders, whereas it may be less critical for those focused on longer-term trading strategies.
General Disclaimer:
The trade ideas presented herein are solely for illustrative purposes forming a part of a case study intended to demonstrate key principles in risk management within the context of the specific market scenarios discussed. These ideas are not to be interpreted as investment recommendations or financial advice. They do not endorse or promote any specific trading strategies, financial products, or services. The information provided is based on data believed to be reliable; however, its accuracy or completeness cannot be guaranteed. Trading in financial markets involves risks, including the potential loss of principal. Each individual should conduct their own research and consult with professional financial advisors before making any investment decisions. The author or publisher of this content bears no responsibility for any actions taken based on the information provided or for any resultant financial or other losses.