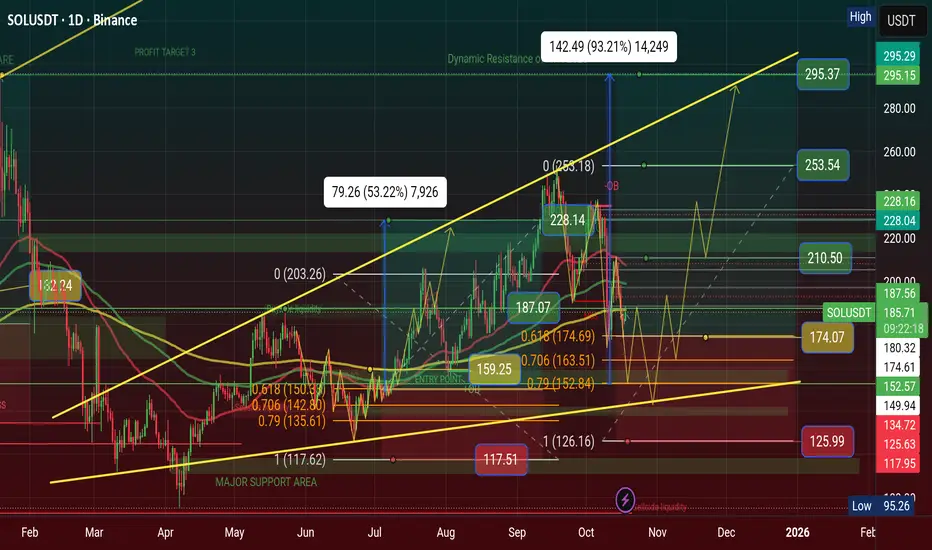
$SOL Showing Inverse Descending Triangle Pattern, $333 in 2026 CRYPTOCAP:SOL Showing Inverse Descending Triangle Pattern, $333 in 2026
💹 Inverse Descending Triangle Pattern
When This pattern will showing a chart than Price is waveing Descending Triangle Range of areas. Price will showing inverse and price moved too. we can make a trade plan to High area and low area. I'm using my Golden Fibonacci Tool, there are 3 point area of Buy position.
💲Position Setup: Open Long Position have 3 point areas, $152, $163, $174 and stoploss below area is $117. The Major Support Area is $101—$111 and Dynamic Resistance of ATH area is $293. My Long Position Target areas $210, $253, $293 and Incredible Price Target $333 areas in 2026
My Previous Long Setup will Hit $228 and complete my Trades. you can see my Previous analysis on this chart and now Waiting for confirmation of golden zone of Golden Fibonacci tool areas.
#Write2Earn #BinanceSquareFamily #Binance #SOL #SUBROOFFICIAL
Disclaimer: This article is for informational purposes only and does not constitute financial advice. Always conduct your own research before making any investment decisions. Digital asset prices are subject to high market risk and price volatility. The value of your investment may go down or up, and you may not get back the amount invested. You are solely responsible for your investment decisions and Binance is not available for any losses you may incur. Past performance is not a reliable predictor of future performance. You should only invest in products you are familiar with and where you understand the risks. You should carefully consider your investment experience, financial situation, investment objectives and risk tolerance and consult an independent financial adviser prior to making any investment.
Subroofficial
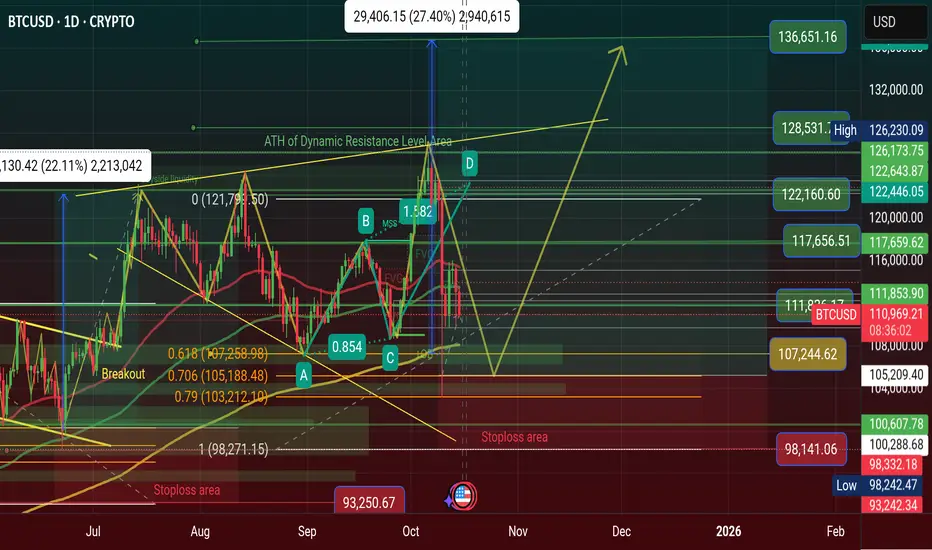
$BTC is showing a Unique Bullish Megaphone Pattern in ATH area, CRYPTOCAP:BTC is showing a Unique Bullish Megaphone Pattern in ATH area, Price will Hit $136K soon 2026
🚀 Dear, Binancians, My BTC Price Prediction will hit $136K in 2026 see on chart.
📈 Chart Analysis: Price is showing a Unique Bullish Megaphone Pattern and this is a Continuation Bull run Pattern. This Pattern is Very Rarely and it's made with on ATH areas. There is a False Breakout after the price will drop to support areas $105K - $108K and than pumping price very sharply. The price goes ATH area than falls breakout to Retested after Price will Break ATH areas. ATH area is a Dynamic Resistance area. When Fill this pattern it will be happened for $136K price areas 2026.
📊 Trading Setup: BTC Long Position setup guidelines: Major Support Areas is $98K and Dynamic Resistance area is ATH areas $126K, I'm using my Golden Fibonacci level for entry. There is 3 point of entry area is $103K, $105K, $108K and it's a Spot Position Entry point areas. Stoploss area is $98K and it's a support area. Profit the Target area is $111K $117K $122K $128K $136K.
#Write2Earn #TrumpTariffs #BTC #MarketPullback #SUBROOFFICIAL
Disclaimer: This article is for informational purposes only and does not constitute financial advice. Always conduct your own research before making any investment decisions. Digital asset prices are subject to high market risk and price volatility. The value of your investment may go down or up, and you may not get back the amount invested. You are solely responsible for your investment decisions and Binance is not available for any losses you may incur. Past performance is not a reliable predictor of future performance. You should only invest in products you are familiar with and where you understand the risks. You should carefully consider your investment experience, financial situation.
$ETH Price Prediction will hit $6K in 2026 see on chart...📈 Chart Analysis: Price is showing a Unique Bullish Megaphone Pattern and this is a Continuation Bull run Pattern. This Pattern is Very Rarely and it's made with on ATH areas. There is a False Breakout after the price will drop to support areas $3K - $3.5K and than pumping price very sharply. The price goes ATH area than falls breakout to Retested after Price will Break ATH areas. ATH area is a Dynamic Resistance area. When Fill this pattern it will be happened for $6K price areas 2026.
📊 Trading Setup: ETH Long Position setup guidelines: Major Support Areas is $3K and Dynamic Resistance area is ATH areas $4.9K, I'm using my Golden Fibonacci level for entry. There is 3 point of entry area is $3.4K, $3.6K, $3.8K and it's a Spot Position Entry point areas. Stoploss area is $3K and it's a support area. Profit the Target area is $4.2K $4.6K $5K $5.5K $6K.
🌍 Dominance Analysis: ETH Dominance is dumping ETH price will Pumping. The Dominance ATH is 22.38% of Resistance area in December 2021 and Support area is 6.95% in April 2025.
#Write2Earn #BinanceSquareFamily #Binance #BTC☀ #SUBROOFFICIAL
Disclaimer: This article is for informational purposes only and does not constitute financial advice. Always conduct your own research before making any investment decisions. Digital asset prices are subject to high market risk and price volatility. The value of your investment may go down or up, and you may not get back the amount invested. You are solely responsible for your investment decisions and Binance is not available for any losses you may incur. Past performance is not a reliable predictor of future performance. You should only invest in products you are familiar with and where you understand the risks. You should carefully consider your investment experience, financial situation, investment objectives and risk tolerance and consult an independent financial adviser prior to making any investment.

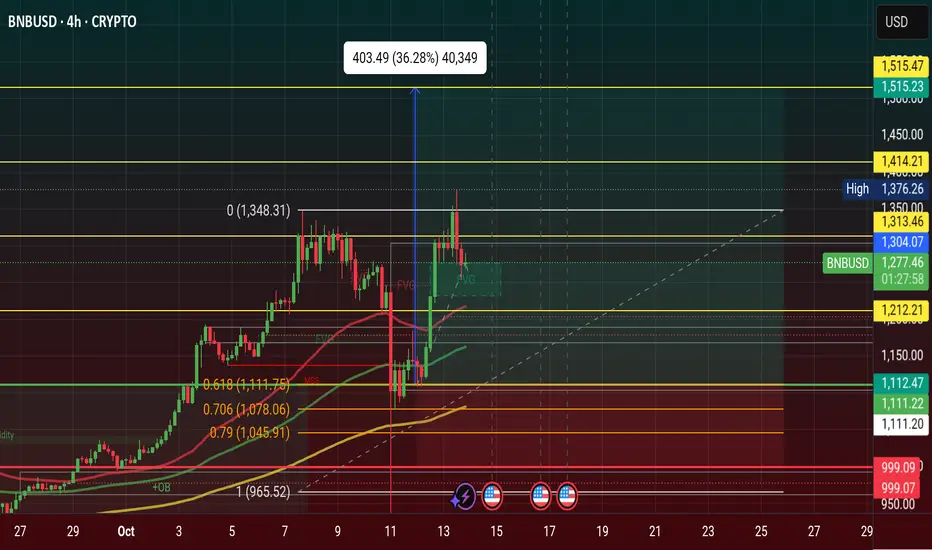
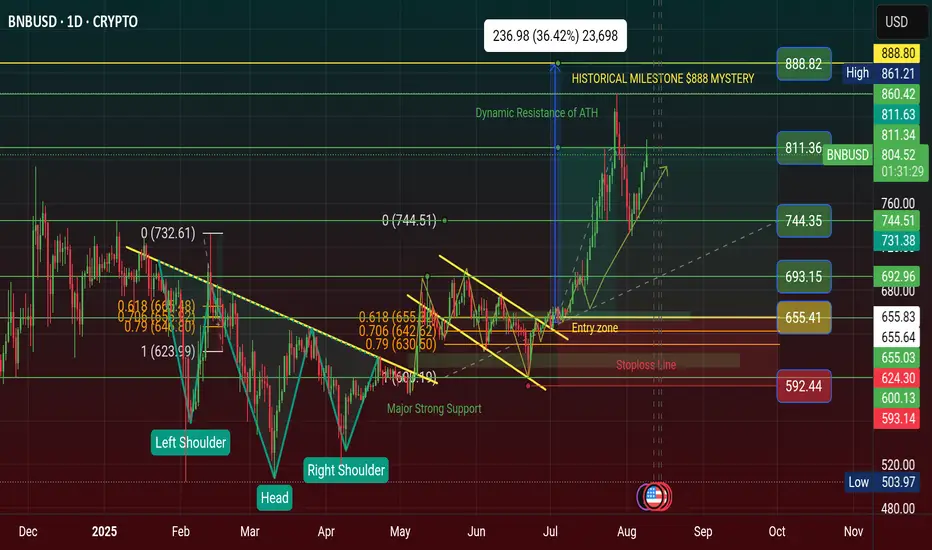
$BNB Price Will Hit $1,515 in this Q4 of 2025, See more chart...CRYPTOCAP:BNB Price Will Hit $1,515 in this Q4 of 2025, See more chart...The previous Resistance area is $888 and now it's Strong Support Zone. Chart is Showing the Price order block area is $999 area. The Main Enty is $1,111 this area. The Major Resistance is $1,212 area and last think this and The Dynamic Resistance is $1,313 area.
The 4 Point of Profit area. 1st Target will $1,212 area, 2nd Target will $1,313 and 3rd Target will $1,414 area, 4th Target will $1,515 area.
Stoploss will $999 area oand always use it. Never losing your all assets. just every trade using your strategy but it's will have using Stoploss and setup your Mind. The Losing Trade you will get if you don't use Stoploss on everyone.
Now Price Bounce Back $1,212 but if it's break the Resistance Area than it's will happened Fake Breakout. But price will Downfall again, if its breakout the ATH area than confirmed price goes to the $1,515 will touch Price level area.
#Write2Earn #BinanceSquareFamily #Binance #BNB #SUBROOFFICIAL
Disclaimer: This article is for informational purposes only and does not constitute financial advice. Always conduct your own research before making any investment decisions. Digital asset prices are subject to high market risk and price volatility. The value of your investment may go down or up, and you may not get back the amount invested. You are solely responsible for your investment decisions and Binance is not available for any losses you may incur. Past performance is not a reliable predictor of future performance. You should only invest in products you are familiar with and where you understand the risks. You should carefully consider your investment experience, financial situation, investment objectives and risk tolerance and consult an independent financial adviser prior to making any investment.
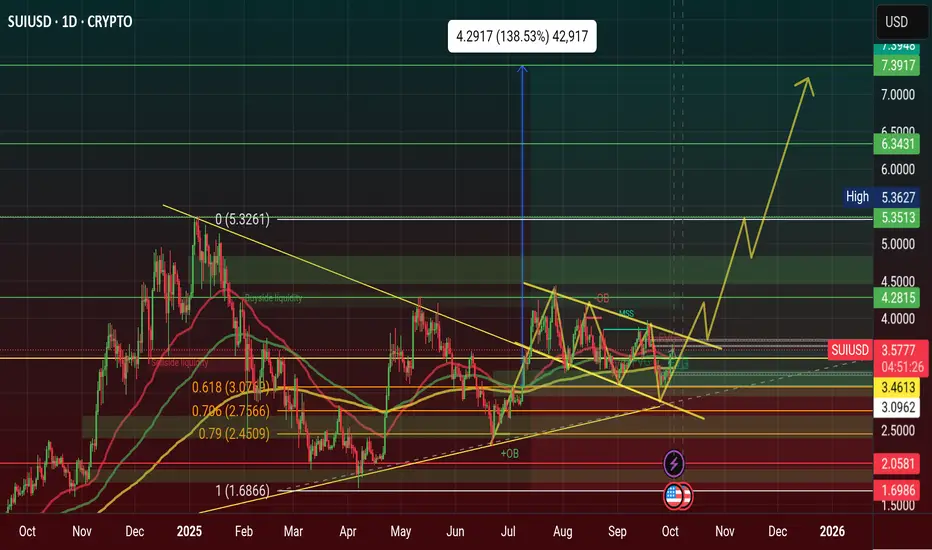
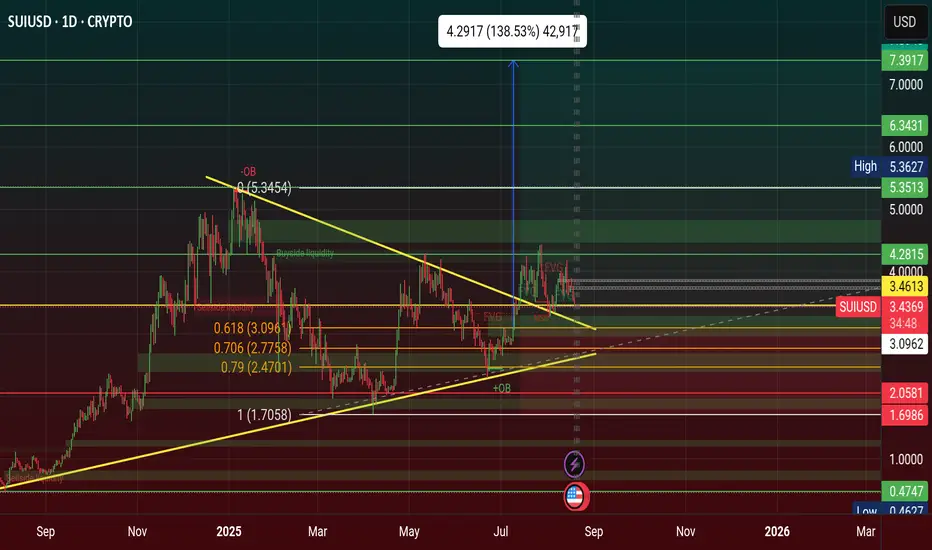
$SUI Showing a Bullish Flag Pattern Day Chart $7 Soon 2026CRYPTOCAP:SUI Showing a Bullish Flag Pattern Day Chart $7 Soon 2026
CRYPTOCAP:SUI was Showing a Reversal Pattern and now Reverse the Price. 3 Weekly showing a Bullish Flag Pattern in Day Chart. It's a Continuation Pattern. It's going to Upward Movement on Directly.
CRYPTOCAP:SUI Strong Support $2, Open position $3 and Strong Resistance $5, Never forget Target $7 and $11 in 2026
#Write2Earn #BinanceSquareFamily #Binance #SUI #SUBROOFFICIAL
Disclaimer: This article is for informational purposes only and does not constitute financial advice. Always conduct your own research before making any investment decisions. Digital asset prices are subject to high market risk and price volatility. The value of your investment may go down or up, and you may not get back the amount invested. You are solely responsible for your investment decisions and Binance is not available for any losses you may incur. Past performance is not a reliable predictor of future performance. You should only invest in products you are familiar with and where you understand the risks. You should carefully consider your investment experience, financial situation, investment objectives and risk tolerance and consult an independent financial adviser prior to making any investment.
$BTC SURPRISED $123K PROFIT DONE ($111K-$122K)CRYPTOCAP:BTC SURPRISED STEP BY STEP
$111K $115K $122K
2026 WILL MORE SURPRISED 2028 OF FUTURE
$122K $133K $144K $155K $166K $177K $188K $199K $211K
Bitcoin (BTC) to Hit Standard Chartered Predicts
At press time, it is trading within striking distance of a neW record high at $123,646.
The cryptocurrency's current record high of $124,517 was logged on Aug. 14 on Bitsamp. tandard Chartered believes that a prolonged shutdown will be bullish for Bitcoin. Kendrick has noted that Bitcoin has a positive correlation with U.S.
Treasury term premiums, which represent the extra yield that comes with holding longer-term bonds. They are currently on the rise due to significant uncertainty caused by the U.S. government shutdown.
Polymarket odds
According to Polymarket bettors, Bitcoin currently has a 7% chance of surpassing $200,000. At the same time, the odds of Bitcoin surpassing $135,000 as early as this October currently stand at 32%.
Meanwhile, there is also a 5% chance of Bitcoin dropping back below $100,000 this October.
#Write2Earn #BinanceSquareFamily #Binance #BTC☀ #SUBROOFFICIAL
Disclaimer: This article is for informational purposes only and does not constitute financial advice. Always conduct your own research before making any investment decisions. Digital asset prices are subject to high market risk and price volatility. The value of your investment may go down or up, and you may not get back the amount invested. You are solely responsible for your investment decisions and Binance is not available for any losses you may incur. Past performance is not a reliable predictor of future performance. You should only invest in products you are familiar with and where you understand the risks. You should carefully consider your investment experience, financial situation, investment objectives and risk tolerance and consult an independent financial adviser prior to making any investment.

$BNB SURPRISED $1,111 INCREDIBLE PRICE DONE ($999-$1,111)CRYPTOCAP:BNB SURPRISED $1,111 INCREDIBLE PRICE DONE ($999-$1,111)
Previous Incredible Price 2025
$777 $888 $999 $1,111
Future Incredible Price 2028
$2,222 $3,333 $4,444
#Write2Earn #BinanceSquareFamily #Binance #BNB #SUBROOFFICIAL
Disclaimer: This article is for informational purposes only and does not constitute financial advice. Always conduct your own research before making any investment decisions. Digital asset prices are subject to high market risk and price volatility. The value of your investment may go down or up, and you may not get back the amount invested. You are solely responsible for your investment decisions and Binance is not available for any losses you may incur. Past performance is not a reliable predictor of future performance. You should only invest in products you are familiar with and where you understand the risks. You should carefully consider your investment experience, financial situation, investment objectives and risk tolerance and consult an independent financial adviser prior to making any investment.

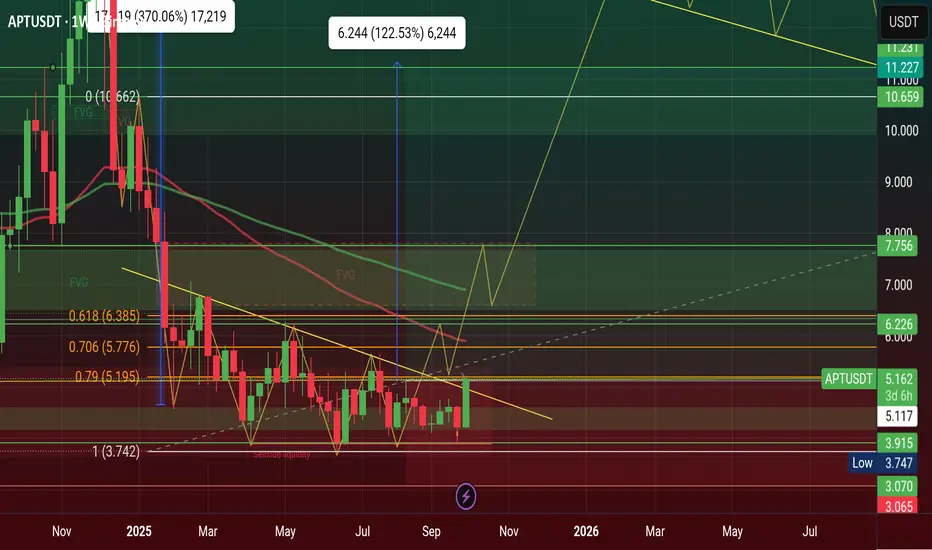
$APT Surprised $5.11 Today & Breakout Confirmed AMEX:APT Surprised $5.11 Today & Breakout Confirmed, price will Drive $11 on this 4th Quarter of 2025
Here’s Why Aptos (APT) Price Is Up Today
Aptos price is having a strong day, up more than 10% and now trading around $5.06, with trading volume climbing by 16%. The move comes after a series of bullish developments that have given traders plenty to get excited about.
One of the main reasons behind the surge is Aptos’ new partnership with World Liberty Financial (WLFI). Together, they’re bringing the USD1 stablecoin onto the Aptos blockchain, with the launch expected by October 6.
USD1 is already the fifth-largest stablecoin with a market cap of about $2.7 billion, and its arrival on Aptos is seen as a major liquidity boost. Stablecoins usually drive more DeFi activity, and APT’s price jump from $3.92 to $4.86 right after the news shows just how much optimism this created.
What the APT Chart Is Showing
Looking at the 4-hour chart, Aptos price has broken out of a downtrend that kept it under pressure for weeks. The price pushed up from the $4.20 support zone and is now testing resistance just above $5. The rally marks the strongest momentum since early July.
The RSI is approaching 70, showing strong buying strength but not yet at extreme overbought levels. The MACD is firmly green, and the widening histogram signals fresh momentum on the upside.
Open interest is holding near 8.97 million, while net shorts are dropping, a sign that sellers are closing out positions. Net longs remain steady, suggesting this move is being powered more by new inflows than leveraged bets.
If Aptos price can maintain its position above the $5 level, the next significant test will be around $5.40 to $5.60, which corresponds to the last local high. On the other hand, if the rally cools, $4.60 is the first support zone to watch.
APT Price Short-Term Outlook
Aptos looks strong going into October. The combination of fresh liquidity from the stablecoin launch and a new institutional product gives it both hype and substance.
If the bullish momentum continues, a push toward $5.60 seems realistic in the short term, with room for a run toward $6.20 later this month.
Of course, holding above $5 is key. As long as Aptos price defends that level, the trend favors the bulls. Right now, the market seems to agree that Aptos has found fresh energy at just the right time.
#Write2Earn #BinanceSquareFamily #Binance #BTC☀ #SUBROOFFICIAL
Disclaimer: This article is for informational purposes only and does not constitute financial advice. Always conduct your own research before making any investment decisions. Digital asset prices are subject to high market risk and price volatility. The value of your investment may go down or up, and you may not get back the amount invested. You are solely responsible for your investment decisions and Binance is not available for any losses you may incur. Past performance is not a reliable predictor of future performance. You should only invest in products you are familiar with and where you understand the risks. You should carefully consider your investment experience, financial situation, investment objectives and risk tolerance and consult an independent financial adviser prior to making any investment.
$BTC BULL RUN RALLY & Showing a WOLF PATTERN 2025Road to Bull Run 2025, price Growing upward movement starting at $108K — $115K — $122K — 128K — $136K Who Entry at $111K and using $100K stoploss.
Bitcoin trades near $116,200, rebounding from $109,000. A close above $117,500 may boost buying, while rejection could trigger profit-taking. Key support is at $113,000. Traders are anticipating a 99% chance of a 25 basis points rate cut at the next Federal Open Market Committee meeting, which is viewed as favorable for Bitcoin. Bitcoin surged past $116,000, rising nearly 3% in a single day, following the U.S. government shutdown.
Key facts: Bitcoin trades near $116,200, rebounding from $109,000. A close above $117,500 may boost buying, while rejection could trigger profit-taking. Key support is at $113,000.
#Write2Earn #BinanceSquareFamily #Binance #BTC☀ #SUBROOFFICIAL
Disclaimer: This article is for informational purposes only and does not constitute financial advice. Always conduct your own research before making any investment decisions. Digital asset prices are subject to high market risk and price volatility. The value of your investment may go down or up, and you may not get back the amount invested. You are solely responsible for your investment decisions and Binance is not available for any losses you may incur. Past performance is not a reliable predictor of future performance. You should only invest in products you are familiar with and where you understand the risks. You should carefully consider your investment experience, financial situation, investment objectives and risk tolerance and consult an independent financial adviser prior to making any investment.

$BNB FINALLY $1K DONE. Q4, 2024 I was Predict (Now$999 - $1,111)Always Control your Money management and try to long term investment for big rewards.
#Write2Earn #BinanceSquareFamily #Binance #BTC☀ #SUBROOFFICIAL
Disclaimer: This article is for informational purposes only and does not constitute financial advice. Always conduct your own research before making any investment decisions. Digital asset prices are subject to high market risk and price volatility. The value of your investment may go down or up, and you may not get back the amount invested. You are solely responsible for your investment decisions and Binance is not available for any losses you may incur. Past performance is not a reliable predictor of future performance. You should only invest in products you are familiar with and where you understand the risks. You should carefully consider your investment experience, financial situation, investment objectives and risk tolerance and consult an independent financial adviser prior to making any investment.

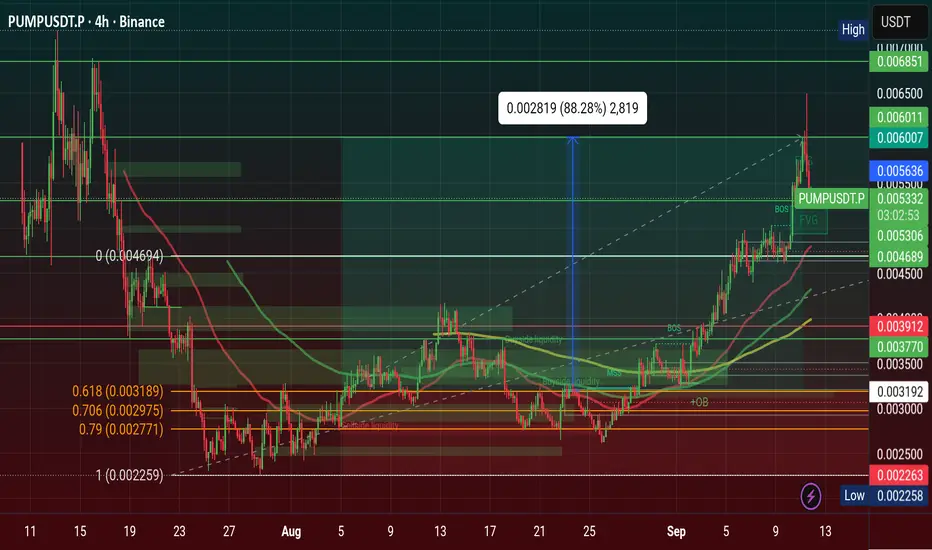
$PUMP Surprised Today $0.0064 and Finally hit $0.006, My PredictPump Price is Consolidation Now, i guess If the Prce is Breakout at ATH with Retest than My Prediction will hit $0.011-$0.022 in 2026. Pump.fun Price Jumps 42% in a Week, Bulls Eye $0.0069 Resistance
Pump.fun has been one of the most talked-about tokens this week, and for good reason. The memecoin launchpad is not only helping new tokens gain traction but also making a strong case for its own native token, PUMP.
At press time, PUMP is changing hands at $0.005814, with a daily premium of 10.52%, and an impressive 42.34% weekly jump. With a market cap of $2.06 billion and intraday trading volume soaring 89% to $500.47 million, momentum around the project is building fast.
Onchain Metrics PUMP Coin
Revenue is one of the signals of Pump.fun's current strength. According to DeFiLlama, Pump.fun generated $2.57 million in the last 24 hours, placing it right behind Hyperliquid among the top protocols. This revenue primarily comes from trading and token launch fees, which the platform keeps at a rather slim 0.05%, making it attractive for new projects.
What's pushing adoption further is the growing ecosystem impact. On September 8, MEXC listed TBCN, a Solana-based memecoin born out of Pump.fun's platform. This listing came shortly after Pump.fun launched the Glass Full Foundation in August, a liquidity injection initiative designed to support fresh projects.
These moves highlight the platform's growing role as a memecoin incubator. On the tokenomics side, Pump.fun has aggressively reduced supply through buybacks. Since July, the protocol has bought back over $30.65 million worth of PUMP, including $705,000 in a single day last month. This reduced the circulating supply by 0.76%, directly easing selling pressure from early investors and fueling the latest rally.
PUMP Price Analysis 2026
Pump Price is Consolidation Now, i guess If the Prce is Breakout at ATH with Retest than My Prediction will hit $0.011-$0.022 in 2026. Pump.fun Price Jumps 42% in a Week, Bulls Eye $0.0069 Resistance.
From a technical perspective, PUMP has been showing strength. The token reclaimed the 23.6% Fibonacci retracement level at $0.005, a critical support zone that now underpins bullish sentiment. As long as the price stays above this level, the path of least resistance points higher. Immediate resistance sits at $0.006888, a level traders are eyeing for the next breakout attempt. If PUMP clears this hurdle, bulls could push toward the $0.0075 zone, setting the stage for a run back to its all-time high of $O.01214.
Conversely, a close below $0.005 could see PUMP retest support at $0.0045. The RSI is currently at 72, suggesting the market is flirting with overbought territory, so short-term pullbacks cannot be ruled out. Still, with buybacks, listings, and revenue momentum backing the move, dips are likely to attract fresh buyers.
#Write2Earn #BinanceSquareFamily #Binance #PUMP #SUBROOFFICIAL
Disclaimer: This article is for informational purposes only and does not constitute financial advice. Always conduct your own research before making any investment decisions. Digital asset prices are subject to high market risk and price volatility. The value of your investment may go down or up, and you may not get back the amount invested. You are solely responsible for your investment decisions and Binance is not available for any losses you may incur. Past performance is not a reliable predictor of future performance. You should only invest in products you are familiar with and where you understand the risks. You should carefully consider your investment experience, financial situation, investment objectives and risk tolerance and consult an independent financial adviser prior to making any investment.
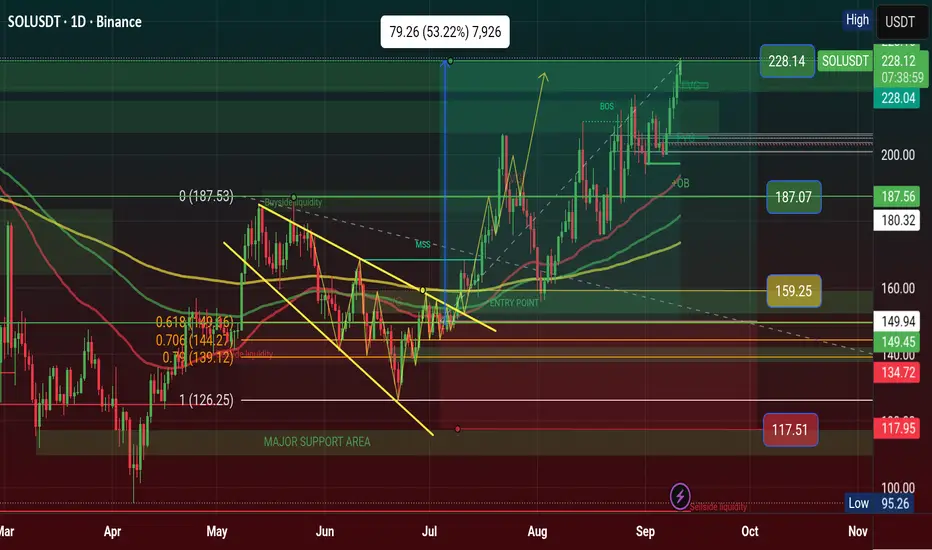
$SOL Finally hit $228 and My Prediction is Done CRYPTOCAP:SOL Finally hit $228 and My Prediction is Done, Next week if Retest and Breakout it will be $333 price in 2026 of Q1, Solana will Archived the price when we are HOLD.
From News, Solana Climbs to $225 as Analysts Predict Strong Year-End 2025 - 2026 Prediction price will hit $333 1st Quarter.
Solana surged to a seven-month high this week, touching nearly $225 as demand from institutions and speculation around ETFS lifted momentum. The token is up 25% in the past month, marking the best performance among the top 10 crypto assets.
Digital asset treasuries have been steadily accumulating Solana throughout 2025. Firms such as Upexi and DeFi Development Corp. each disclosed holdings of over $400 million in the token since January. Forward Industries added fuel to the trend earlier this week, announcing a $1.65 billion private investment in public equity to establish a Solana treasury. The plan, spearheaded by Multicoin Capital's Kyle Samani, could create the largest publicly traded SOL treasury if executed.
ETF applications tied to Solana are also awaiting SEC decisions. Issuers including Bitwise, Canary Funds, and 21Shares have filed proposals, while analysts expect approvals on CRYPTOCAP:SOL , CRYPTOCAP:XRP , and Dogecoin ETFS
sometime in 2025. Market research platforms have taken note of the shifting sentiment. Prediction markets on Myriad now give Solana a 57% chance of reaching a new all-time high this year, up from 23% just weeks ago.
Despite trading about 24% below its January peak of $293.31, Solana's rally has made it one of the strongest performers among major assets. Hougan emphasized that the relative size of Solana compared to Bitcoin and Ethereum means even modest ETF inflows could have an outsized effect on price.
He estimated that Forward's planned treasury allocation, if fully executed, would be equivalent to a $33 billion purchase in Bitcoin terms. With Solana at $221 at press time, investors are closely monitoring whether ETF approvals and treasury expansion will drive the next leg upward.
#Write2Earn #BinanceSquareFamily #Binance #SOL #SUBROOFFICIAL
Disclaimer: This article is for informational purposes only and does not constitute financial advice. Always conduct your own research before making any investment decisions. Digital asset prices are subject to high market risk and price volatility. The value of your investment may go down or up, and you may not get back the amount invested. You are solely responsible for your investment decisions and Binance is not available for any losses you may incur. Past performance is not a reliable predictor of future performance. You should only invest in products you are familiar with and where you understand the risks. You should carefully consider your investment experience, financial situation, investment objectives and risk tolerance and consult an independent financial adviser prior to making any investment.
$BTC Milestone Alert & Price will hit $128K or $88K in Sep, 2025✨Bitcoin Milestone Alert & Price will hit $128K or $88K in September or October 2025 🚀
CRYPTOCAP:BTC has now stayed above the $100K level for 122 consecutive days. Price will Bounce Back to $105K to $128K Range and if drop retest it will be the $88K-$92K Zone otherwise PUMP ongoing.
That’s over 4 months of holding six-figure territory, proving that $100K isn’t just a breakout, it’s becoming a new market baseline.
The question isn’t if Bitcoin can hold, but what’s next from here?
REMINDER: Hidden bullish divergence could confirm on today’s weekly close. Mega-bullish for Bitcoin. Q4 Will be explosive. Millionaires will be created. You just have to stay in the game. Do you understand?
Q4 Will be explosive. Millionaires will be created. You just have to stay in the game. Do you understand?
📊 This September Big Economic Week Incoming
• Tuesday (Sept 9): U.S. Non-Farm Payrolls Annual Revisions
• Wednesday (Sept 10): U.S. PPI (Producer Price Index)
• Thursday (Sept 11): U.S. CPI (Consumer Price Index) & ECB Rate Decision
🌍 EXPECT VOLATILITY!
#Write2Earn #BinanceSquareFamily #Binance #BTC☀ #SUBROOFFICIAL
Disclaimer: This article is for informational purposes only and does not constitute financial advice. Always conduct your own research before making any investment decisions. Digital asset prices are subject to high market risk and price volatility. The value of your investment may go down or up, and you may not get back the amount invested. You are solely responsible for your investment decisions and Binance is not available for any losses you may incur. Past performance is not a reliable predictor of future performance. You should only invest in products you are familiar with and where you understand the risks. You should carefully consider your investment experience, financial situation, investment objectives and risk tolerance and consult an independent financial adviser prior to making any investment.

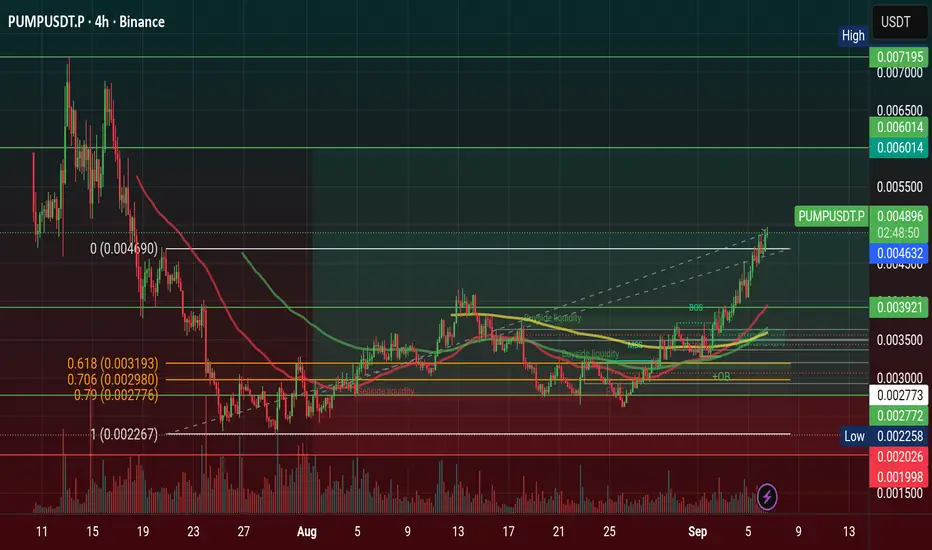
$PUMP Parabolic Starting & if Break ATH price hit $0.011 in 2026🚀 NYSE:PUMP Parabolic Starting & if Break ATH price hit $0.011 in 2026
IN 2026 PUMP will be happened break ATH and my Prediction $0.006 price area will be breaks after Price will stay accumulation in previous ATH areas. In 2026 price could hit $0.011 and 0.008 areas.
Pump.fun Executes $62M Token Buyback as Class-Action Lawsuit Looms
The platform generated more than $775 million in revenue since launch, according to DefiLlama, though income briefly slumped in late July, when weekly revenue fell to $1.72 million- its lowest lev el since March 2024. At its peak in May, weekly revenue topped $56 million, coinciding with a surge of Solana memecoins that briefly pushed SOL itself above $200, its highest level since late 2021.
Market Impact and User Growth
The buybacks appear to be lifting sentiment. PUMP has gained 12% in the past month and 9% in the past week, trading at $0.003522 — up 54% from an August low of $0.002282. The number of unique PUMP holders has climbed to more than 70,800, with smaller accounts holding under 10,000 tokens now making up nearly half of distribution, pointing to stronger retail participation. Blockchain explorer Solscan shows wallet activity on Pump.fun has nearly doubled since May, with daily active users averaging 48,000 compared with 25,000 earlier in the year.
#Write2Earn #PUMP #TrumpTariffs #highlight #SUBROOFFICIAL
Disclaimer: This article is for informational purposes only and does not constitute financial advice. Always conduct your own research before making any investment decisions. Digital asset prices are subject to high market risk and price volatility. The value of your investment may go down or up, and you may not get back the amount invested. You are solely responsible for your investment decisions and Binance is not available for any losses you may incur. Past performance is not a reliable predictor of future performance.
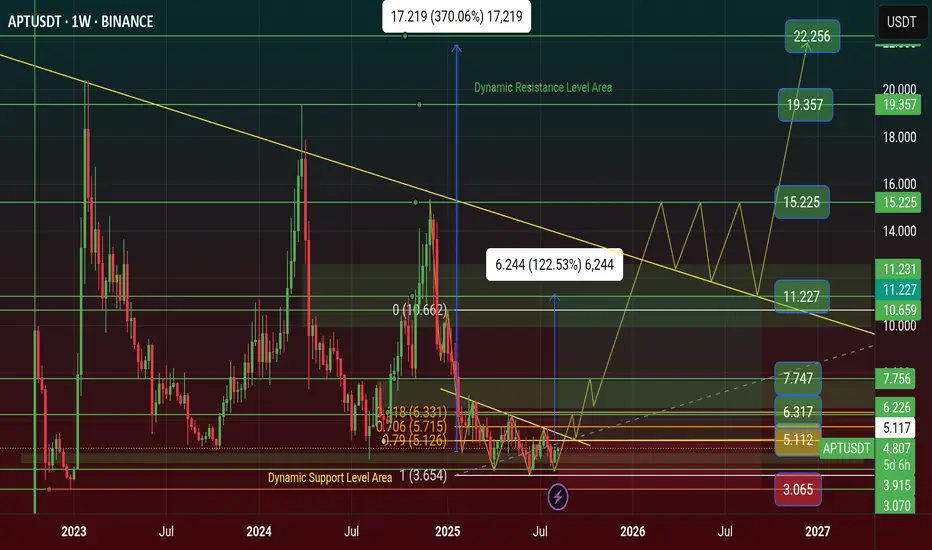
$APT Price Prediction will be reach $22 this Year 2025APT price is Showing Triple Bottom Pattern on Chart. it's a Reversal Pattern for APT price Manipulation. Time for Bull Run on APT and 12 aug unlocked 11.31M APT token and 2.20% of released supply $51.35M Dollar.
APT Price now Bottom area of Major Support Level area. At first the price will Hit $7 and if it's touch $11 price and if it's Breakout this Resistance it will be happened APT $22 Price.
🚦Aptos (APT) - 11.31M Token Unlocked worth of $51.35M - 12 Aug 2025
On 12 August 2025, Aptos will unlock 11.31 million new tokens. This event adds more APT tokens into the market supply at one time. Many traders watch token unlocks because more supply can bring price down if holders decide to sell quickly. Also, if most tokens go to teams or early backers, there might be more selling.
However, if unlocks are well planned and market demand is high, the price may not fall much. This event could be a catalyst for price change based on how the market reacts.
🚦 Aptos’ DEX trading volume reached $9 billion in the first half of the year, and the market value of stablecoins increased to $1.2 billion
PANews reported on August 12th that a Messari report showed that Aptos made significant progress in on-chain performance, DeFi ecosystem, and technological innovation in the first half of 2025. Transaction fees dropped to $0.00052, DEX trading volume reached $9 billion, and the stablecoin market capitalization increased to $1.2 billion.
On the technical side, projects such as Shelby and Decibel were launched to improve network performance. The Aptos Foundation invested $200 million to promote ecosystem development and consolidate its position as a global transaction engine.
🚦 UPCOMING EVENTS APT 11 SEPTEMBER
Total 11.31M APT Token Unlock worth of $54.51M and 2.15% of released supply
#Write2Earn #BinanceSquareFamily #BinanceAlphaAlert #APT #SUBROOFFICIAL
Disclaimer: This article is for informational purposes only and does not constitute financial advice. Always conduct your own research before making any investment decisions. Digital asset prices are subject to high market risk and price volatility. The value of your investment may go down or up, and you may not get back the amount invested. You are solely responsible for your investment decisions and Binance is not available for any losses you may incur. Past performance is not a reliable predictor of future performance. You should only invest in products you are familiar with and where you understand the risks.
$BNB $888 Challenge Milestone Finally Done this Q3 of 2025 ✨ CRYPTOCAP:BNB $888 Challenge Milestone Finally Done this Q3 of 2025
BNB $888 Challenge Milestone Prediction was post at March 16, 2025 and BNB price was $600 Areas. Milestone Prediction is archived, now It's Popular Coin of Worldwide Exchange of Binance.
Finally BNB $888 Challenge Done & August 22, 2025 it's a Memorable Day of Binance. Now BNB Create New Historical ATH $897 Today.
I was Fundamentals, Technical, and Chart analysis of $800 price will reached, BNB price is starting journey at $600 in October 2024 and dropped to $500 to Gain up to starting Journey. The Price is Now around +$800 and over $888 price October in 2025.
BNB Made ATH in December 2024 and the Milestone staring 2024 price at $444 to $888, insight the price is $444, $555, $666, $777 & $888 Areas.
The Price Will happened and if it's Breakout the Milestone price than Next Target could reached at the price will $999 and $1,111 Areas. It will be happened on 2026 and it will be MEGA BULL RUN like as BITCOIN Season of 2025.
What will happened the Binance Native Coin of Worldwide Top Exchange Native Coin Historical Milestone this 2025?
WILL HIT THE INCREDIBLE $999 and $1,111 PRICE IN 2025?
#Write2Earn #BinanceSquareFamily #Binance #BNB #SUBROOFFICIAL
Disclaimer: This article is for informational purposes only and does not constitute financial advice. Always conduct your own research before making any investment decisions. Digital asset prices are subject to high market risk and price volatility. The value of your investment may go down or up, and you may not get back the amount invested. You are solely responsible for your investment decisions and Binance is not available for any losses you may incur. Past performance is not a reliable predictor of future performance. You should only invest in products you are familiar with and where you understand the risks. You should carefully consider your investment experience, financial situation, investment objectives and risk tolerance and consult an independent financial adviser prior to making any investment.

$SUI showing Bullish Symmetrical Triangle Pattern & Price hit $7CRYPTOCAP:SUI showing Bullish Symmetrical Triangle Pattern & Price hit $7 in 2025? SUI Price Prediction- Will Robinhood Listing Fuel a Breakout To $5.5?
SUI price trades at $3.49, consolidating in a bullish triangle as Robinhood listing and sentiment hint at a potential $5.5 breakout. Price Retest again and Waiting for Breakout the Last High in this weeks.
🚦Highlights of SUI Coin Prediction 2025-2026
• SUI price consolidates in an ascending triangle with resistance at $4.50.
• Robinhood listing expands access to millions of U.S. retail investors.
• Weighted sentiment rebounds to +0.533, signaling renewed market optimism.
At press time, SUI price saw a decrease of 3.09% to $3.49 in 24 hours, testing the ascending trendline support. Regardless of the retracement, the price structure is bullish and a breakout pattern is still in force. The most recent Robinhood listing could open up more demand, and sentiment indicators are showing increasing optimism.
Symmetrical Triangle Formation Sets SUI Price on a Bullish Course
The SUI price remains in a clear ascending triangle pattern, with a rising support and a flat resistance band between $4.46 and $4.50. This trend, which has been in place since June, shows great accumulation at higher lows with numerous rejections at the ceiling.
The price is trading above the key trendline at around $3.49, indicating that buyers are still defending the bullish structure. Breaking above $4.50 may lead to a steep up-move of 57.52% to the target of $5.5.
Conversely, a breakdown below $3.40 would nullify this bullish setup. At the moment, the structure holds and the long term SUI price outlook depends on its performance at $4.50. SUI Market Cap $12.16B, Max Supply 10B.
The 14-day Money Flow Index (MFI) is at 48.75, which is in the neutral range. This level implies an equilibrium between inflows and outflows, and there is much space to a bullish blow in case buyers step in.
In case the MFI exceeds 60 and breaks out, it would support the inflow of new capital. Furthermore, the previous bounce in the indicator off of sub-40 levels indicates a decline in selling pressure over the recent days.
The shift along with the technical compression implies a possibility of energy accumulation under the surface. Should bulls reclaim resistance, this accumulation period might blow up into a full breakout. Therefore, the SUI price is technically supported and awaits a catalyst to unlock upside.
Robinhood Listing and Sentiment Shift Strengthen the Bullish Outlook
The launch of SUI on Robinhood, on August 19, will be a major step toward retail access. The new listing enables millions of users in the U.S. to instantly trade SUI using the Robinhood app, making it easier to onboard and eliminate friction to retail investors.
This listing is crucial, as it comes at a time when a bullish ascending triangle pattern is being formed on the SUI price chart. It adds accessibility and narrative fuel, two of the most important driving factors that may underpin an upside breakout.
Besides the listing, the weighted sentiment data provided by Santiment shows that the crowd psychology has changed. The metric, which had plunged into negative territory in the middle of August, has now recovered to a +0.533.
This indicates that investors are feeling optimistic once again. Such sentiment spikes can be followed by price rallies when supported by positive structural backdrops.
With both chart dynamics and on-chain mood aligned, the SUI price could be primed for its next major move, further supported by ETF filings from Canary and 21Shares that highlight growing institutional interest.
In summary, there is no doubt that the signals are all pointing to a breakout. The structure of the ascending triangle is still in place, sentiment is on the upside, and the listing of Robinhood provides a new surge of demand. A clean flip above $4.50 would probably drive the SUI price to the $5.5 target. Therefore, SUI is on the verge of a bullish breakout.
#Trendingideas #highlights #Binance #SUI #SUBROOFFICIAL
Disclaimer: This article is for informational purposes only and does not constitute financial advice. Always conduct your own research before making any investment decisions. Digital asset prices are subject to high market risk and price volatility. The value of your investment may go down or up, and you may not get back the amount invested. You are solely responsible for your investment decisions and Binance is not available for any losses you may incur. Past performance is not a reliable predictor of future performance. You should only invest in products you are familiar with and where you understand the risks. You should carefully consider your investment experience, financial situation, investment objectives and risk tolerance and consult an independent financial adviser prior to making any investment.
$ETH Surprised $4.7k and ATH breakout going to $5K✨ CRYPTOCAP:ETH Surprised $4.11K breakout going to Rocket $5K 🚀
Price will hit $5K on this month confirmed. previous post was price $4K see now. Who is Open long trade price at $4K ? just Hold it for $5K level.
🚦Vitalik Buterin Reclaims 'Onchain Billionaire' Status as CRYPTOCAP:ETH Surges Past $4,433
CRYPTOCAP:ETH co-founder Vitalik Buterin has once again joined the ranks of crypto's 10-figure holders, with his portfolio now valued at approximately $1.04 billion.
This milestone comes just days after ETH surpassed the $4,000 mark for the first time in eight months. Alongside Buterin, other prominent billionaires shaping the crypto and tech landscape include: Fred Ehrsam Co-founder of Coinbase and Paradigm, with an estimated net worth of $2.93 billion.
Volodymyr Nosov Founder and President of WhiteBIT Group, with wealth estimated between $6-$7 billion.
The Winklevoss Twins - Founders of Gemini exchange, each with an estimated personal net Worth of $2.7 billion. For more on notable figures like Larry Ellison, Bill Gates, and Mark Zuckerberg.
#Write2Earn #ETHETFsApproved #BinanceAlphaAlert #ETH4500Next? #SUBROOFFICIAL
Disclaimer: This article is for informational purposes only and does not constitute financial advice. Always conduct your own research before making any investment decisions. Digital asset prices are subject to high market risk and price volatility. The value of your investment may go down or up, and you may not get back the amount invested. You are solely responsible for your investment decisions and Binance is not available for any losses you may incur. Past performance is not a reliable predictor of future performance. You should only invest in products you are familiar with and where you understand the risks. You should carefully consider your investment experience, financial situation, investment objectives and risk tolerance and consult an independent financial adviser prior to making any investment.

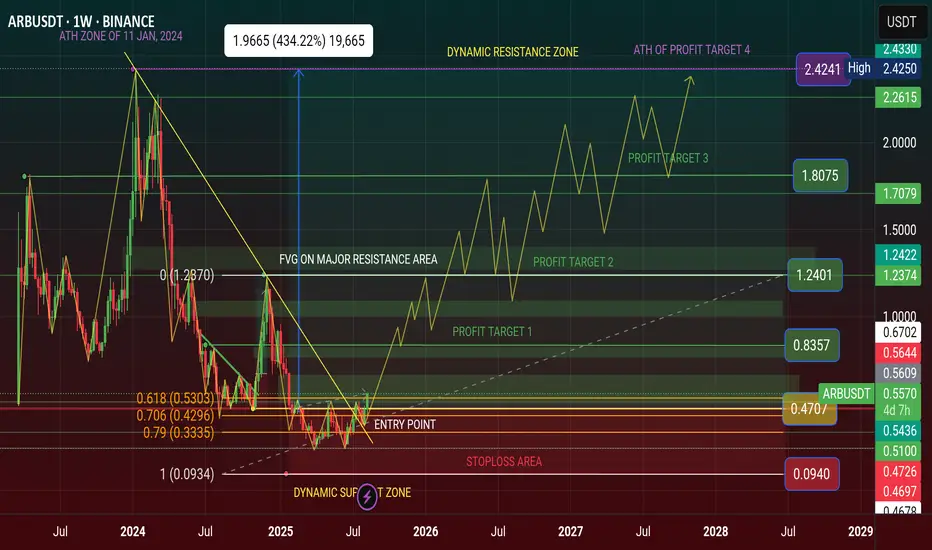
$ARB Finally Breakout $0.50 and going to +$1 This August 2025✨ AMEX:ARB Finally Breakout $0.50 and it's going to Rocket +$1 This August 2025 and +$2 in 2026
I was Share my Prediction on TradingView and Binance Square. Lastly, i was telling the ARB price is Showing a Bullish Reversal Pattern and this is Last hope in Bottom Price of Dynamic Support Level Area.
Now Price is showing Bullish Reversal of Double Bottom Pattern in Weekly Chart. Price Breakout The Neckline. My Premium Followers was Entered Long Trade or Buy Spot Trade of ARB Coin. They are now profitable in their ARB Coin investment.
🚦From News: Arbitrum (ARB) To Soar Further? Key Harmonic Pattern Signals Potential Upside Move
The cryptocurrency market is in bullish mode as Ethereum (ETH) broke above the $4,200 level for the first time since 2021. This surge has sparked a broad rally, with major altcoins including Arbitrum (ARB) riding the wave higher. ARB has posted an impressive 20% weekly gain, but more importantly, its price chart is now flashing a harmonic pattern that may reveal its next move.
Harmonic Pattern Hints at Potential Bounce
On the daily timeframe, ARB is shaping up a Bearish ABCD harmonic pattern — a formation that, despite its “bearish” name, often includes a bullish CD leg before the price reaches its Potential Reversal Zone (PRZ).
The structure began with a strong rally from point A around $0.3237 to point B near $0.5090, followed by a retracement to point C at $0.3702, where buyers stepped back in. Since then, ARB has rebounded and is now trading around $0.4680, signaling that the CD leg is firmly underway.
Harmonic projections suggest the CD leg could extend toward the 1.236 Fibonacci extension of the BC leg, putting the PRZ around $0.5456. If achieved, this would mark an approximate 18% upside from current levels.
What’s Next for ARB?
Momentum remains tilted toward the bulls. A sustained push toward $0.5456 would complete the ABCD pattern, but that zone could also act as significant resistance, prompting some traders to secure profits.
On the downside, ARB must hold above its 25-day moving average, currently near $0.4315. A breakdown below this level could weaken the bullish case and potentially lead to a deeper consolidation phase.
#Highlights #everyone #BinanceSquareFamily #Binance #ARB #SUBROOFFICIAL
Disclaimer: This article is for informational purposes only and does not constitute financial advice. Always conduct your own research before making any investment decisions. Digital asset prices are subject to high market risk and price volatility. The value of your investment may go down or up, and you may not get back the amount invested. You are solely responsible for your investment decisions and Binance is not available for any losses you may incur. Past performance is not a reliable predictor of future performance. You should only invest in products you are familiar with and where you understand the risks. You should carefully consider your investment experience, financial situation, investment objectives and risk tolerance and consult an independent financial adviser prior to making any investment.
$BNB Finally Profit Done $811 & Road to $888-$1K Mystery in 2025CRYPTOCAP:BNB Finally Profit Done $811 & Road to $888-$1K in 2025. BNB price now Dynamic Resistance Area. Price will hit $888 - $1K if Breakout ATH of this month it will be happened. BNB price now Resistance area $863 of ATH and Weekly Time Fream Breakouts to $888 Mystery of Historical Milestone.
Breaking: Binance Taps Spain’s BBVA Bank to Custody Crypto, BNB Price Soars
BNB Price Rises 3%
BNB price jumped nearly 3% in the past 24 hours, with the price trading at $790 during writing. The 24-hour low and high were $765.52 and $790.98, respectively.
Furthermore, the trading volume saw a more than 25% increase in the last 24 hours, indicating a significant rise in interest among traders. It happened amid a broader crypto market recovery.
Popular analyst Ali Martinez, in an X post, predicted BNB price to move higher as it is in the discovery phase after hitting a new ATH. It also has one of the strongest year-to-date performances.
Traders’ confidence in BNB remained high as it resisted market volatility, while other crypto assets were down 20-40% after hitting ATH this year.
In the daily timeframe, the price was moving comfortably above the 50-SMA, 100-SMA, and 200-SMA at the time of writing.
Whereas, the Relative Strength Index (RSI) climbed to 58.08, signaling potential for a further upside move to $900.
CoinGlass data showed mixed trading activity in the derivatives market. At the time of writing, the total BNB futures open interest jumped more than 1.30% to $585.69 million in the last 24 hours.
However, 4-hour BNB futures open interest on Binance and OKX were down 0.02, 0.30%, but increased by 0.72% on Bybit.
This signals that derivatives traders remain cautious over a sudden rally in BNB price.
#highlight #everyone #BinanceSquareFamily #Binance #ETH #SUBROOFFICIAL
Disclaimer: This article is for informational purposes only and does not constitute financial advice. Always conduct your own research before making any investment decisions. Digital asset prices are subject to high market risk and price volatility. The value of your investment may go down or up, and you may not get back the amount invested. You are solely responsible for your investment decisions and Binance is not available for any losses you may incur. Past performance is not a reliable predictor of future performance. You should only invest in products you are familiar with and where you understand the risks. You should carefully consider your investment experience, financial situation, investment objectives and risk tolerance and consult an independent financial adviser prior to making any investment.
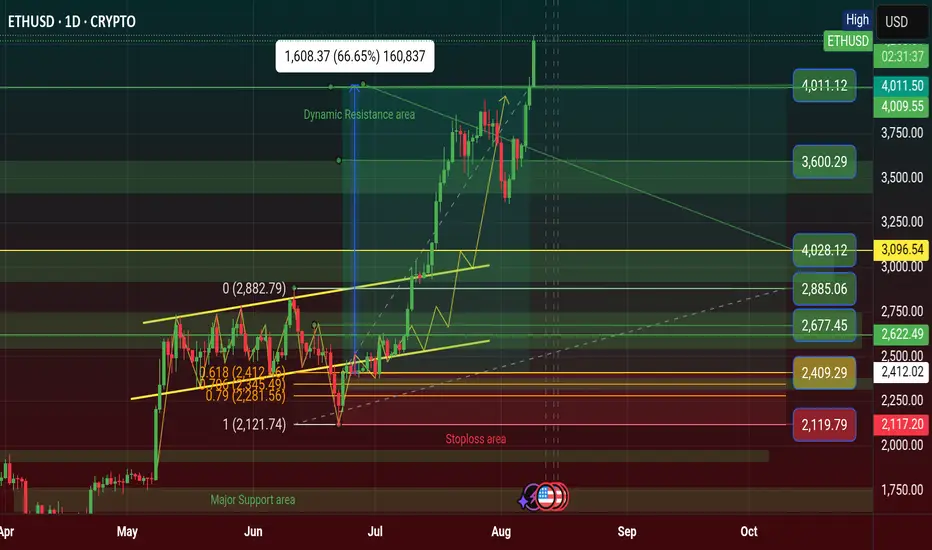
$ETH Finally $4,011 Profit Done Again, Breakout $4K price areaIf CRYPTOCAP:ETH price will be touch $4.5K and it's Breakout it will be happened $5K of new historical ATH.
Ethereum Price Target $4K as Trader Plans Partial Exit
Ethereum Maintains Market Leadership
The Ethereum Price Target $4K narrative is gaining traction as ETH continues to outperform the broader crypto market. Despite volatility, Ethereum’s resilience and strong fundamentals have kept it at the forefront of investor attention.
One experienced trader noted that ETH is “still the strongest asset in the crypto market,” following their lower time frame (LTF) plan closely. They believe the market could be nearing a local top, potentially with a brief spike — or deviation — above the $4,000 level.
Planned Exit Strategy Between $4K and $4.3K
The trader shared a specific strategy: selling 50% of their spot Ethereum holdings between $4,000 and $4,300. This position has been held for nearly two years, with an average entry price of around $2,400, meaning the planned sale would lock in substantial profits.
Such an approach reflects disciplined risk management — capturing gains after a strong rally while maintaining exposure in case the trend continues higher.
What This Means for the Market
If Ethereum does approach the $4K–$4.3K range, several scenarios are possible:
A deviation above $4K followed by a retracement could confirm a local top.
Sustained momentum beyond $4.3K could signal a stronger-than-expected breakout.
Broader crypto market sentiment will likely play a major role in price direction.
With ETH’s fundamentals stronger than ever and network upgrades continuing, the medium- to long-term outlook remains bullish — even if short-term corrections occur.
#highlights #BinanceSquareFamily #Binance #ETH #SUBROOFFICIAL
Disclaimer: This article is for informational purposes only and does not constitute financial advice. Always conduct your own research before making any investment decisions. Digital asset prices are subject to high market risk and price volatility. The value of your investment may go down or up, and you may not get back the amount invested. You are solely responsible for your investment decisions and Binance is not available for any losses you may incur. Past performance is not a reliable predictor of future performance. You should only invest in products you are familiar with and where you understand the risks. You should carefully consider your investment experience, financial situation, investment objectives and risk tolerance and consult an independent financial adviser prior to making any investment.
$BTC Finally Historical Profit Done at $122K & Now $123K of ATH CRYPTOCAP:BTC tying to push price upward movement and if it's Breakout the $120K-$122K Price Level area than it could be reached $128K - $136K price level area.
I'm guess it will be happened. Always Pattern indicate and say price movement of Bitcoin. I was many Prediction of popular coin and i will succeed in 2025. I'm long term analyst of long term investment of Traders.
🚦From News: Bitcoin Holds Firm Above $115K Support as Charts Point Toward $150K Target
Bitcoin holds above $115K support with charts pointing to a potential $150K Elliott Wave target.
Hashrate hits all-time high as energy value model places BTC valuation 45% above current price.
U.S. policy shift enables 401(k) crypto access, opening a $9 trillion market for Bitcoin adoption.
Bitcoin has held firm above the $115,000 support and is now showing signs of a large move on the charts. Price patterns and rising adoption trends are aligning as BTC prepares for a possible rally. At the time of writing, BTC was trading at $116,620, showing steady upward momentum.
Technical Structure Points Toward Upside Continuation
According to an analysis prepared by Lau, Bitcoin has taken the $115,000 support and may be preparing to break its all-time high. On Binance, the BTC/USDT daily chart displays a breakout from resistance near $116,438.79. The price reached a new high before retracing to $111,917.37, where it found support.
BTC’s price structure continues to show higher lows, aligning with the Elliott Wave pattern that targets $150,000. Key support levels remain at $98,385.45 and $89,326.51, confirming a strong technical base. According to Daan Crypto Trades, Bitcoin is steadily rising toward the $120,000 zone, where a cluster of stop losses and liquidation points may fuel further upside.
The current bullish flag formation is still intact, supported by the 50-day SMA at $113,154. The RSI has moved to 54, indicating recovering momentum without being overbought. Analysts view a break above $117,350 as a key signal for another upward push.
On-Chain Metrics and Market Drivers Support Growth
Bitcoin’s energy value stands at $167,800, which is around 45% above the current market price. According to Charles Edwards, founder of Capriole Investments, “Hash rates are flying and Bitcoin Energy Value just hit $145K.”
This model links BTC’s value to miner energy inputs and network security. Bitcoin’s hashrate reached an all-time high of 1.031 ZH/s on August 4, based on data from Glassnode. Alongside this, adoption is growing in the U.S. market.
President Trump’s policy allowing 401(k) crypto inclusion has opened a $9 trillion market. Crypto-linked equities and ETFs have also seen strong inflows, supporting long-term price action.
#highlights #everyone #premium #BinanceSquareFamily #Binance #BTC☀ #SUBROOFFICIAL
Disclaimer: This article is for informational purposes only and does not constitute financial advice. Always conduct your own research before making any investment decisions. Digital asset prices are subject to high market risk and price volatility. The value of your investment may go down or up, and you may not get back the amount invested. You are solely responsible for your investment decisions and Binance is not available for any losses you may incur. Past performance is not a reliable predictor of future performance. You should only invest in products you are familiar with and where you understand the risks. You should carefully consider your investment experience, financial situation, investment objectives and risk tolerance and consult an independent financial adviser prior to making any investment.

$BTC Finally Historical Profit Done at $123K Price of ATH CRYPTOCAP:BTC tying to push price upward movement and if it's Breakout the $120K-$122K Price Level area than it could be reached $128K - $136K price level area.
I'm guess it will be happened. Always Pattern indicate and say price movement of Bitcoin. I was many Prediction of popular coin and i will succeed in 2025. I'm long term analyst of long term investment of Traders.
🚦From News: Bitcoin Holds Firm Above $115K Support as Charts Point Toward $150K Target
Bitcoin holds above $115K support with charts pointing to a potential $150K Elliott Wave target.
Hashrate hits all-time high as energy value model places BTC valuation 45% above current price.
U.S. policy shift enables 401(k) crypto access, opening a $9 trillion market for Bitcoin adoption.
Bitcoin has held firm above the $115,000 support and is now showing signs of a large move on the charts. Price patterns and rising adoption trends are aligning as BTC prepares for a possible rally. At the time of writing, BTC was trading at $116,620, showing steady upward momentum.
Technical Structure Points Toward Upside Continuation
According to an analysis prepared by Lau, Bitcoin has taken the $115,000 support and may be preparing to break its all-time high. On Binance, the BTC/USDT daily chart displays a breakout from resistance near $116,438.79. The price reached a new high before retracing to $111,917.37, where it found support.
BTC’s price structure continues to show higher lows, aligning with the Elliott Wave pattern that targets $150,000. Key support levels remain at $98,385.45 and $89,326.51, confirming a strong technical base. According to Daan Crypto Trades, Bitcoin is steadily rising toward the $120,000 zone, where a cluster of stop losses and liquidation points may fuel further upside.
The current bullish flag formation is still intact, supported by the 50-day SMA at $113,154. The RSI has moved to 54, indicating recovering momentum without being overbought. Analysts view a break above $117,350 as a key signal for another upward push.
On-Chain Metrics and Market Drivers Support Growth
Bitcoin’s energy value stands at $167,800, which is around 45% above the current market price. According to Charles Edwards, founder of Capriole Investments, “Hash rates are flying and Bitcoin Energy Value just hit $145K.”
This model links BTC’s value to miner energy inputs and network security. Bitcoin’s hashrate reached an all-time high of 1.031 ZH/s on August 4, based on data from Glassnode. Alongside this, adoption is growing in the U.S. market.
President Trump’s policy allowing 401(k) crypto inclusion has opened a $9 trillion market. Crypto-linked equities and ETFs have also seen strong inflows, supporting long-term price action.
#highlights #everyone #premium #BinanceSquareFamily #Binance #BTC☀ #SUBROOFFICIAL
Disclaimer: This article is for informational purposes only and does not constitute financial advice. Always conduct your own research before making any investment decisions. Digital asset prices are subject to high market risk and price volatility. The value of your investment may go down or up, and you may not get back the amount invested. You are solely responsible for your investment decisions and Binance is not available for any losses you may incur. Past performance is not a reliable predictor of future performance. You should only invest in products you are familiar with and where you understand the risks. You should carefully consider your investment experience, financial situation, investment objectives and risk tolerance and consult an independent financial adviser prior to making any investment.
