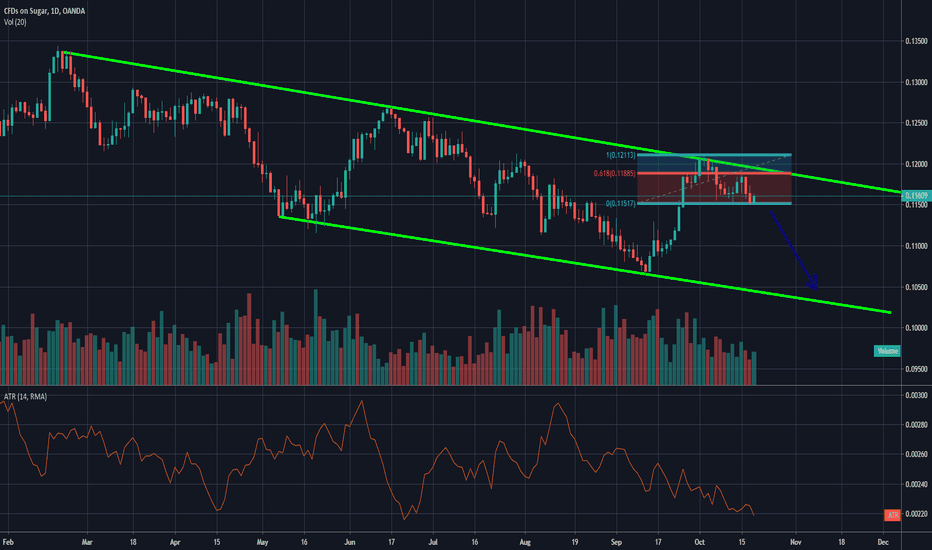
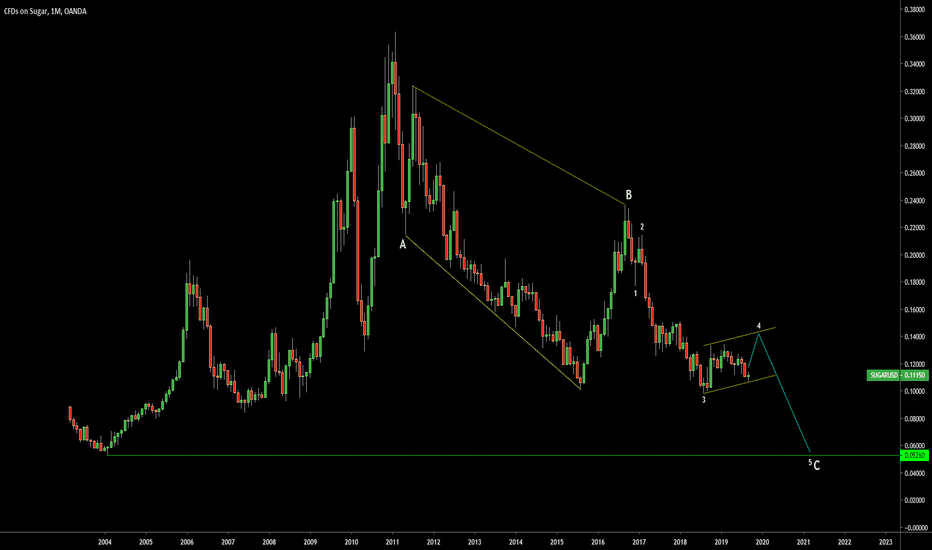
SUGAR DAILY ANALYSIS - TL TOUCH AND 61.8% FIB RETRACE SHORT?Sugar came up to test the upper green trendline before price reversed.
Price then retraced to the 61.8 Fib Level before moving back down.
It looks like the bears are in control for now, and Sugar should continue to push lower as October comes to an end.
Daily trade analysis and ideas:
Telegram: t.me
Facebook: www.facebook.com
Twitter: forex_dojo
Instagram: Jaylen.Forex
Website: www.forexshinobi.com
ForexShinobi
Sugar
SugarUS LongSugar weekly candle just closed above the 20 ma and the 21 ema. Looking left when that occurred in the past we had at least one additional full body weekly candle close above those moving averages before trend reversal OR start of a further uptrend , especially in those cases that 21 ema crossed over the 20 ma to the upside.
Linking this idea with my previous long position on Sugar.
Sugar: Buy Opportunity with an end-of-year horizon.Sugar has been trading within a 1M Channel Down for almost 1 full year (RSI = 40.519, MACD = -0.770, Highs/Lows = -0.1543). It is close to pricing a Lower Low, turning the current levels into a buy opportunity. Our Target Zone is 11.65 - 11.90.
** If you like our free content follow our profile (www.tradingview.com) to get more daily ideas. **
Comments and likes are greatly appreciated.
Hello Traders, SUGAR/USD 0.12052 VS 0.12668. Trade SetupsHello Traders, SUGAR/USD 0.12052 VS 0.12668.
Looking for Yellow: a Break and continuation / corrective / Consolidation Pattern at 0.12546 / 0.12668
To Continue the upside movent towards 0.13120 / 0.3372.
Or Blue: Possible Completion Consolidation /Continuation / Corrective Pattern 0.12546
to Retest / Break previous Lows once more 0.12052 / 0.12080 towards 0.11827 / 0.11742.
Sugar could become bitterThe price is lateralizing in this channel composed by the static support at $ 11.50 and the resistance identified by 78.6% of Fibonacci set at $ 13.15.
This raw material, in the very short term, seems intent on retesting the high area of the channel just mentioned. On the weekly time frame it closed the week above the dynamic resistance identified by the EMA20 periods.
In the short/medium term, on the other hand, the fundamental structure shows some signs of uncertainty. This idea is regarding futures prices, with an excess of stocks in Mexico. Normally that country does not propose itself as a major player in the international sugar market. Now things could change, with the nation that will be forced to increase exports to many countries, including the United States. This in order to drain the huge levels of stored product.
INTL FCStone and S&P Global Platts have stated that in the 2019-2020 season, global consumption of sugar will exceed production and this is undoubtedly a good news for futures prices.
Sugar could become bitter and t
he price should not be able to break the resistance at $ 13.15. The price should be pushed back on the support area around 11.50. We do not recommend any trade on this raw material, but the target areas are:
in the very short term 13.15.
in the short/medium term 11.50.
Sugar: Interesting uptrend here...I'm monitoring $SUGARUSD here for a weekly and daily long entry on retrace -if it ever comes-, otherwise paying up for it might be worth it, given how strong the chart looks. Could sharply rise from this juncture immediately after the market opens too.
The targets on chart are the weekly range targets, corresponding to a Time@Mode signal active as long as we hold over 0.1236. The daily has a bullish trend as well, which kicked in on Friday. Entering at market or on dips would be a viable trade.
Best of luck,
Ivan Labrie.


