DIvergence in Sunpharma (bullish bias)Sunpharma signalling bullish sentiment with 1600, 1625 and 1650 as upside targets
SUNPHARMA

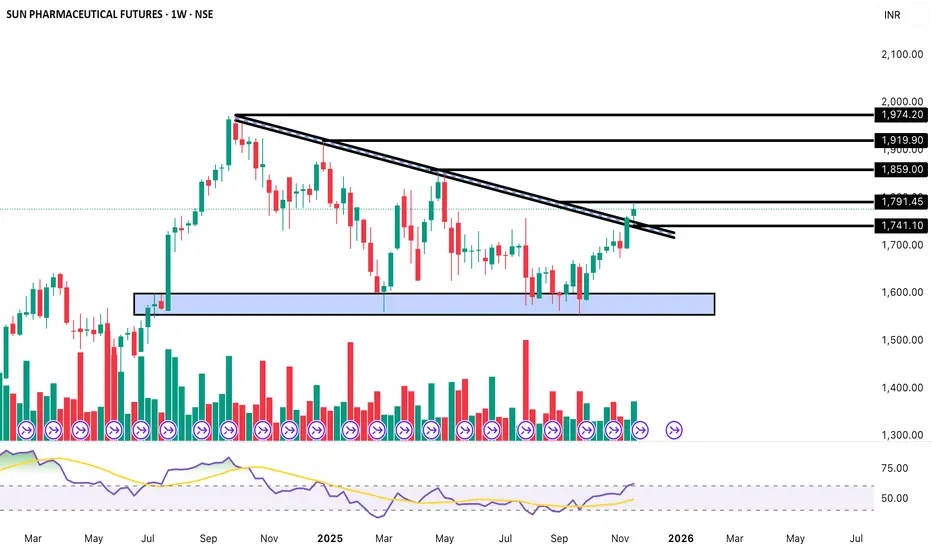
Major Trendline Breakout on Weekly | Multi-Month Rally Setup📌 Buy Zone (Weekly Breakout Confirmation):
₹1,780 – ₹1,795
🎯 Targets (Positional):
T1 – ₹1,859
T2 – ₹1,919
T3 – ₹1,974
🛡️ Stop-Loss (Weekly):
₹1,740 (below retest + trendline confluence)
⏳ Duration:
4–8 weeks (Positional swing)
USDJPY 2Hour Time frameUSD/JPY 2-Hour Snapshot
Current Price: 147.46 JPY
Change: +0.05% from the previous close
Market Cap: Not applicable
P/E Ratio: Not applicable
EPS: Not applicable
Intraday High: 147.59 JPY
Intraday Low: 147.27 JPY
🔎 Technical Indicators
RSI (14): Neutral
MACD: Neutral
Moving Averages:
5-period SMA: Not available
10-period SMA: Not available
20-period SMA: Not available
50-period SMA: Not available
📈 Market Sentiment
Pivot Points:
R1: Not available
R2: Not available
R3: Not available
S1: Not available
S2: Not available
S3: Not available
📅 Outlook
Bullish Scenario: A breakout above the current price could lead to further gains.
Bearish Scenario: A drop below the current price may test support levels.
Overall Bias: Neutral, with mixed signals from moving averages and momentum indicators.

TSLA 45Minutes Time frameTSLA 45-Minute Snapshot
Current Price: $346.97 USD
Change: +0.18% from the previous close
Intraday Range: Not available
🔎 Technical Indicators
RSI (14): 53.64 — Neutral
MACD: 1.78 — Buy signal
Moving Averages:
5-period SMA: $347.01 — Sell signal
10-period SMA: $346.78 — Buy signal
20-period SMA: $347.82 — Sell signal
50-period SMA: $340.53 — Buy signal
📈 Market Sentiment
Pivot Points:
R1: $347.52
R2: $348.18
R3: $348.95
S1: $345.32
S2: $344.65
S3: $343.99
📅 Outlook
Bullish Scenario: A breakout above $347.52 could lead to a push toward $348.18 and higher.
Bearish Scenario: A drop below $345.32 may test support around $344.65.
Overall Bias: Neutral to slightly bullish, with mixed signals from moving averages.

SENSEX 45Minutes Time frameSENSEX 45-Minute Snapshot
Current Price: 81,422.80 INR
Change: +0.33% from the previous close
Day's Range: 81,235.42 – 81,643.88 INR
52-Week Range: 71,425.01 – 85,978.25 INR
🔎 Technical Indicators
RSI (14): Neutral
MACD: Bullish momentum
Moving Averages:
5-period SMA: Buy signal
10-period SMA: Buy signal
20-period SMA: Buy signal
50-period SMA: Buy signal
📈 Market Sentiment
Golden Cross: The SENSEX recently formed a "golden cross," where the 50-day moving average crossed above the 200-day moving average, indicating a bullish trend.
Analyst Outlook: Analysts maintain a positive outlook on SENSEX, with a consensus rating of "Buy" and a 12-month price target suggesting potential upside.
📅 Outlook
Bullish Scenario: A breakout above 81,643.88 INR could lead to a push toward 82,000 INR and higher.
Bearish Scenario: A drop below 81,200 INR may test support around 80,800 INR.
Overall Bias: Moderately bullish, with positive momentum but facing near-term resistance.

BABA 3Hour Time frameBABA 3-Hour Snapshot
Current Price: $147.10
Change: +4.18% from the previous close
Market Cap: $347.34 billion
P/E Ratio: 16.47
EPS (TTM): $8.84
Beta: 0.54
Dividend Yield: 0.73%
🔎 Key Levels
Resistance:
R1: $148.50 (prior high and Fibonacci cluster)
R2: $157.80 (Fibonacci 0.382 retracement)
Support:
S1: $135.00 (recent breakout level)
S2: $130.00 (next support level)
📈 Technical Indicators
RSI (14): 62.82 — Neutral
MACD: 4.08 — Bullish momentum
Moving Averages:
5-period SMA: $135.30 — Buy signal
10-period SMA: $128.98 — Buy signal
20-period SMA: $125.03 — Buy signal
50-period SMA: $119.26 — Buy signal
📌 Market Sentiment
Catalyst: Shares surged ~13% following a favorable court ruling, marking the highest close since March 2025.
Sector Performance: Positive momentum in the Chinese tech sector, with Alibaba leading gains.
Analyst Outlook: Average 12-month price target of $167.17, indicating a 13.64% upside from current levels.
StockAnalysis
📅 Outlook
Bullish Scenario: A breakout above $148.50 could lead to a push toward $157.80 and higher.
Bearish Scenario: A drop below $135.00 may test support around $130.00.
Overall Bias: Moderately bullish, with positive momentum but facing near-term resistance.

ADANIENT 3Hour Time frame📊 ADANIENT 3-Hour Snapshot
Current Price: ₹2,334.60
Change: +0.99% from the previous close
Intraday Range: ₹2,287.55 – ₹2,358.00
Market Cap: ₹2.67 trillion
P/E Ratio: 41.65
EPS (TTM): ₹55.45
Beta: 1.04 (moderate volatility relative to the market)
🔎 Key Levels
Resistance:
R1: ₹2,358.00 (recent high)
R2: ₹2,380.00 (next resistance zone)
Support:
S1: ₹2,287.55 (immediate support)
S2: ₹2,260.00 (next support level)
📈 Technical Indicators
RSI (14): 62.46 — Neutral to slightly bullish
MACD: 12.04 — Positive momentum
Moving Averages:
5-period SMA: ₹2,272.45 — Buy signal
10-period SMA: ₹2,302.60 — Sell signal
20-period SMA: ₹2,297.07 — Sell signal
50-period SMA: ₹2,458.13 — Sell signal
Stochastic Oscillator: 25.53 — Neutral
Williams %R: -71.18 — Buy signal
📌 Market Sentiment
Catalysts: Positive momentum following recent gains and analyst upgrades.
Sector Performance: Infrastructure and energy sectors showing strength, with Adani Enterprises leading gains among peers.
Options Activity: Significant trading in call options at ₹2,350 strike price, indicating bullish sentiment.
📅 Outlook
Bullish Scenario: A breakout above ₹2,358.00 could lead to a push toward ₹2,380.00 and higher.
Bearish Scenario: A drop below ₹2,287.55 may test support around ₹2,260.00.
Overall Bias: Moderately bullish, with positive momentum but facing near-term resistance.

BTCUSDT 1D Time frame 📊 BTC/USDT Daily Snapshot
Current Price: $112,493
Change: −0.37% from the previous close
Intraday Range: $110,812 – $113,029
Market Cap: Approximately $2.2 trillion
P/E Ratio: Not applicable (Bitcoin is not a stock)
Beta: Not applicable (Bitcoin is not a stock)
🔎 Key Levels
Resistance:
R1: $113,000 (recent high)
R2: $116,000 (next resistance zone)
Support:
S1: $110,800 (immediate support)
S2: $107,000 (next support level)
S3: $102,000 (longer-term support)
📈 Technical Indicators
RSI (14): 43 — Neutral, indicating balanced buying and selling pressure
MACD: Bullish crossover observed, suggesting upward momentum
Moving Averages:
5-day SMA: $111,500 — Buy signal
50-day SMA: $112,830 — Resistance level
200-day SMA: $101,000 — Long-term support
Stochastic Oscillator: Oversold, indicating potential for a bounce
📌 Market Sentiment
Catalysts: Positive momentum following recent gains and analyst upgrades.
Sector Performance: Cryptocurrency market showing strength, with Bitcoin leading gains among peers.
Options Activity: Significant trading in call options at $113,000 strike price, indicating bullish sentiment.
📅 Outlook
Bullish Scenario: A breakout above $113,000 could lead to a push toward $116,000 and higher.
Bearish Scenario: A drop below $110,800 may test support around $107,000.
Overall Bias: Moderately bullish, with positive momentum but facing near-term resistance.

META 1D Time frame Meta Platforms (META) Daily Snapshot
Current Price: $765.70
Change: +1.78% from the previous close
Intraday Range: $753.43 – $766.30
Volume: 10,564,233 shares traded
Market Cap: $1.86 trillion
P/E Ratio: 25.95
EPS: $27.56
Beta: 1.42 → higher volatility than the market
🔎 Key Levels
Resistance:
R1: $764.73 (near-term)
R2: $771.51 (next zone)
Support:
S1: $745.67 (immediate)
S2: $738.89 (secondary)
S3: $732.75 (long-term)
📈 Technical Indicators
RSI (14): 52.41 → neutral, balanced buying and selling
MACD: 1.46 → positive, upward momentum
ADX (14): 14.16 → weak trend strength
Moving Averages:
5-day SMA: $745.11 → Buy
10-day EMA: $748.66 → Buy
50-day SMA: $739.04 → Buy
200-day SMA: $651.23 → Buy
📌 Market Sentiment
Catalysts: Positive momentum and analyst upgrades
Sector Strength: Tech sector strong, with Meta leading gains
AI Investment: Meta plans to invest heavily in AI over the coming years, expected to benefit the broader AI and data infrastructure ecosystem
📅 Outlook
Bullish Scenario: Break above $764.73 could push toward $771.51 and higher
Bearish Scenario: Drop below $745.67 may test support at $738.89
Overall Bias: Moderately bullish, with momentum positive but near-term resistance to watch

Review and plan for 17th July 2025 Nifty future and banknifty future analysis and intraday plan.
This video is for information/education purpose only. you are 100% responsible for any actions you take by reading/viewing this post.
please consult your financial advisor before taking any action.
----Vinaykumar hiremath, CMT

#SUN/USDT#SUN
The price is moving within a descending channel on the 1-hour frame and is expected to continue upward.
We have a trend to stabilize above the 100 moving average once again.
We have a downtrend on the RSI indicator that supports the upward move with a breakout.
We have a support area at the lower limit of the channel at 0.01560.
Entry price: 0.01610
First target: 0.01632
Second target: 0.01660
Third target: 0.01700

Sun Pharma - Long Setup (Swing Trade)Sun Pharma has confirmed a breakout above the entry zone, presenting a swing trade opportunity. Here’s the trade setup:
Entry Price: 1836.95 (Confirmed after the 15-minute candle broke above the entry zone at 1833)
Target: 1978.8
Stop Loss: 1760.10 (Triggered if a daily candle closes below this level)
With the entry price confirmed at 1836.95 , this setup offers a favorable risk-to-reward ratio. The target is set at 1978.8 , with a well-defined stop loss at 1760.10 to manage risk.
Disclaimer: This post is for educational purposes only and is not financial advice. Always manage your risk and trade responsibly.

#SUN/USDT#SUN
The price is moving in a descending channel on the 1-day frame and is holding it very well and is about to break out to the upside
We have a bounce from the lower limit of the channel at 0.01600
We have a bearish trend of the RSI that is about to break out which supports the upside
We have a trend to stabilize above the 100 moving average
Entry price 0.01750
First target 0.02680
Second target 0.03337
Third target 0.04370

Sun /Usdt BINANCE:SUNUSDT
Sun Currently Price is 0.01031 and Holding There Resistance Zone If Price Hold It There Next Resistance is 0.1134 . But If Price Rejecting That Level We can See Another Support Zone 0.0900
Disclaimer : I am Not Financial Adviser

SunPharma-Strong Buy-Swing- End of downward range? NSE:SUNPHARMA
03.07.2024
Buy above 1539
Target:1627
Stop Loss:1494
Risk-Reward: 1:2
01. Inside candle breakout in daily & Weekly
02. After big uptrend, price is getting consolidated
in downward range by creating LL & LH
03. Price has rejected & found fake breakout at 200 EMA level and 50% Fibonacci level.
04. Price has failed to create LH 04 & rejected at Midway.
Further it has broke channel & retracement done.
05. 20& 50 EMA rejections & about to cross over further indicating trend reversal.
Happy Trading!!

Double Moving Averages Crossover Swing Trade📊 Script: JINDALSTEL
📊 Nifty50 Stock: NO
📊 Sector: Steel
📊 Industry: Steel - Sponge Iron
⏱️ C.M.P 📑💰- 849
🟢 Target 🎯🏆 - 890
⚠️ Stoploss ☠️🚫 - 825
📊 Script: VTL
📊 Nifty50 Stock: NO
📊 Sector: Textiles
📊 Industry: Textiles - Cotton/Blended
⏱️ C.M.P 📑💰- 442
🟢 Target 🎯🏆 - 472
⚠️ Stoploss ☠️🚫 - 425
📊 Script: JSWENERGY
📊 Nifty50 Stock: NO
📊 Sector: Power Generation & Distribution
📊 Industry: Power Generation And Supply
⏱️ C.M.P 📑💰- 528
🟢 Target 🎯🏆 - 561
⚠️ Stoploss ☠️🚫 - 511
📊 Script: NYKAA
📊 Nifty50 Stock: NO
📊 Sector: E-Commerce/App based Aggregator
📊 Industry: Trading
⏱️ C.M.P 📑💰- 161
🟢 Target 🎯🏆 - 173
⚠️ Stoploss ☠️🚫 - 155
📊 Script: SUNPHARMA
📊 Nifty50 Stock: YES
📊 Sector: Pharmaceuticals
📊 Industry: Pharmaceuticals - Indian - Bulk Drugs
⏱️ C.M.P 📑💰- 1620
🟢 Target 🎯🏆 - 1692
⚠️ Stoploss ☠️🚫 - 1590
⚠️ Important: Always maintain your Risk & Reward Ratio.
✅Like and follow to never miss a new idea!✅
Disclaimer: I am not SEBI Registered Advisor. My posts are purely for training and educational purposes.
Eat🍜 Sleep😴 TradingView📈 Repeat 🔁
Happy learning with trading. Cheers!🥂

#SUN/USDT#SUN
The price is moving in an upward trend, which the price has relied on more than once in its rise
We have support at the 0.00750 level, from which it is expected to rise
After it is corrected a little
We also have a catalyst from the RSI indicator
We have a higher stability moving average of 100
Entry price .00764
First target 0.00861
Second goal 0.00957
Third goal 0.01060

#THYROCARE 583 recommended to buy - #stockstowatch Rachit SethiaNSE:THYROCARE
THYROCARE 583
TGT 680
SL 540
Return 16%
TF <6M
RR >2
Factors: BULLISH WEDGE BREAKOUT Trend Following Rising Volume with rising Prices. Flag pattern breakout. Pennant Pattern Breakout with Bullish Candle. Retest Successful. Higher Highs & Higher Lows. Broken above RESISTANCE levels Trading at SUPPORT levels Earnings are strong. Bullish Wedge Breakout Risk Return Ratio is healthy. And Rising from Double Bottom Pattern to Flag Pattern forming. If you like my work KINDLY LIKE SHARE & FOLLOW this page for free Stock Recommendations. With 💚 from Rachit Sethia

Perfect on-neck pattern breakout on daily chartA Bullish Breakout of On Neck pattern and a Rounding Bottom is visible on the Daily chart of NSE:SPARC
MACD gave Positive crossover on Daily, Weekly and Monthly chart. So, expecting the momentum to continue.
One can create a fresh position in the scrip as per the levels mentioned on the chart.
Risk Disclaimer:
The information provided in this analysis is based on my personal interpretation of market conditions and the available data at the time of writing. It is advisable to seek advice from a qualified financial professional and to conduct your own research before making any investment decisions.

SUNPHARMA Bullish Order BlocksBullish Order Block at 935-964 range
Bullish Order Block at 856.80-877 range

Sun Pharmaceuticals Ltd.*Sun Pharmaceuticals Ltd*
C&H; Formation on Yearly Basis.
P&F; Formation on Weekly Basis.
Strong Price BreakOut & Sustained.
Vol. BuiltUp gaining Traction.
RSI: 1H W = M. All in Bullish Zone.
Widening Gaps amongst 20/50/100/200 EMAs.
Pharma Sector gaining Traction too!!!
*Trail SL with Upside*
*Book Profit as per Risk Appetite*
Do Your Own Research as well. This is an Opinion.
Happy Investing 😇

#PANACEABIO 165 Buy Recommended- Rachit Sethia PANACEABIO 165
NSE:PANACEABIO
TARGET 225
SL 135
Return 36%
TIME FRAME < 6 Months
RR > 2
Factors: BULLISH WEDGE BREAKOUT Trend Following Rising Volume with rising Prices. Flag pattern breakout. Pennant Pattern Breakout with Bullish Candle. Retest Successful. Higher Highs & Higher Lows. Broken above RESISTANCE levels Trading at SUPPORT levels Earnings are strong. Bullish Wedge Breakout Risk Return Ratio is healthy. And Rising from Double Bottom Pattern to Flag Pattern forming. If you like my work KINDLY LIKE SHARE & FOLLOW this page for free Stock Recommendations. With 💚 from Rachit Sethia

Sun pharma - Wave countSun pharma - Wave Count NSE:SUNPHARMA BSE:SUNP1!
Correction may start soon.
Trade with Caution!
