RELIANCE Unleashed | Bulls Roaring StrongThis is the daily timeframe chart of Reliance.
Reliance is moving in a strong momentum phase and is consistently respecting the Supertrend indicator.
Based on Supertrend, the key support level is at 1518.
Currently, the stock is trading above multi-timeframe pivot levels, indicating short-term momentum strength.
Buying opportunities may be considered near the 1530–1540 range.
The stock has a strong support zone around 1515–1520.
Potential upside target is near 1620.
If the support zone sustains, we may see higher prices in Reliance in the coming sessions.
Thank you.
Supertrendstrategy

INFY on Fire , Bulls Take the LeadThis is the 4 hour timeframe chart of INFY.
The stock is moving in a well-defined structure with a Higher-High, Higher-Low formation and is currently trading above the LOP. Both structural and LOP-based supports lie in the 1550–1560 zone.
EMA and Supertrend indicators are also providing additional support near 1550 and 1570.
If these levels sustain, the stock may move toward the 1700 level soon.
Thank you.

National Aluminium: Fresh Supertrend Buy SignalThis is the 4-hour timeframe chart of National Aluminium.
The stock is trading within a well-defined structure and has consistently respected the Supertrend, making new highs on each bullish swing.
It currently holds key support levels around ₹242 and ₹227.
If the ongoing momentum continues and the Supertrend remains intact, every dip has the potential to push the stock toward new highs.
Thank you.

Mphasis Technical Levels for Smart TradingThis is the daily timeframe chart of Mphasis.
Mphasis is moving within a well-defined market structure and is forming a pattern inside a pattern.
The major support zone lies between ₹2630–₹2670, while the smaller internal pattern is taking support near ₹2670–₹2700.
The Supertrend indicator is also positive, with Supertrend support positioned around ₹2640.
If these levels sustain, we may witness higher prices in Mphasis.
Thank you !!

NBCC at Support — Bullish Action BeginsThis is the daily timeframe chart of NBCC.
NBCC is taking support near the lower boundary of the parallel channel, and the Supertrend indicator is also providing confirmation in the same zone. The support area lies around 104–108, while the immediate resistance is near 121.
If the support zone holds, the stock may move higher toward the channel’s upper levels near 121, with the final resistance placed around the 145–150 zone.
Thank you!

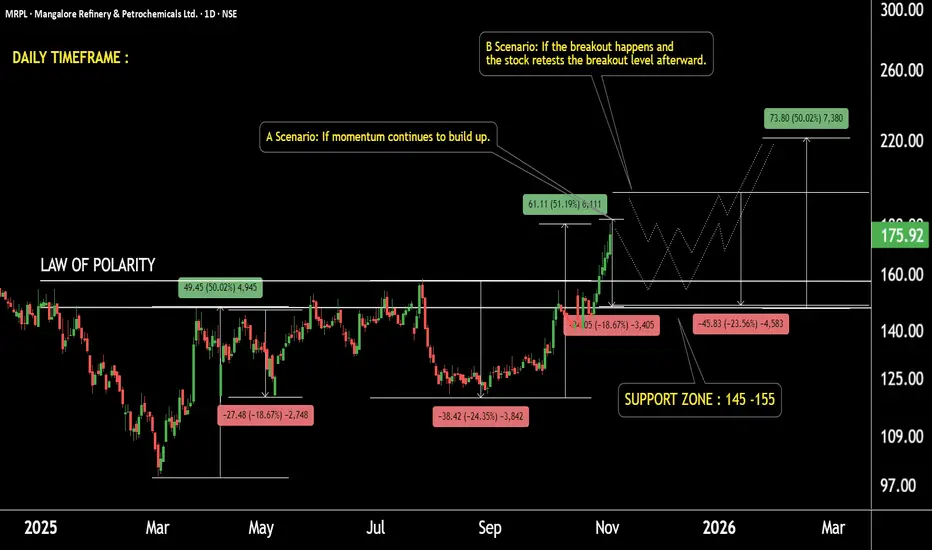
MRPL Showing Strength !! Momentum Building for Next Rally !!MRPL — Technical Overview
On the long-term timeframe, MRPL is moving within an ascending parallel channel, with a strong support zone between 120–135 and a resistance zone near 420–520.
According to the Supertrend indicator, the stock remains in a bullish phase, showing two key dynamic supports — the first around 145, and the second near 125.
On the daily timeframe, after a 50% upward move, the stock witnessed a healthy correction of around 20–24%, bringing it back toward its support area between 145–155.
This correction zone aligns with the law of polarity, where previous resistance has now turned into support.
Scenario A: If the momentum continues to build, the price may move toward higher levels directly.
Scenario B: If the breakout retests the previous breakout zone, the price may revisit 145–155 before resuming the next leg higher.
Based on this structure, the potential target for the next leg lies around 220 levels, supported by the channel resistance projection and measured move.
CSB Bank Gaining Strength – Momentum Trade Setup ActiveCSB Bank – Daily Timeframe Analysis
Stock has taken reversal from Supertrend support.
Currently trading above Pivot level.
Supertrend support lies near ₹400 zone.
Daily MACD has given a positive crossover and is moving in the positive zone.
If this support sustains, momentum is likely to continue upward.
Possible new highs can be seen in the coming sessions.

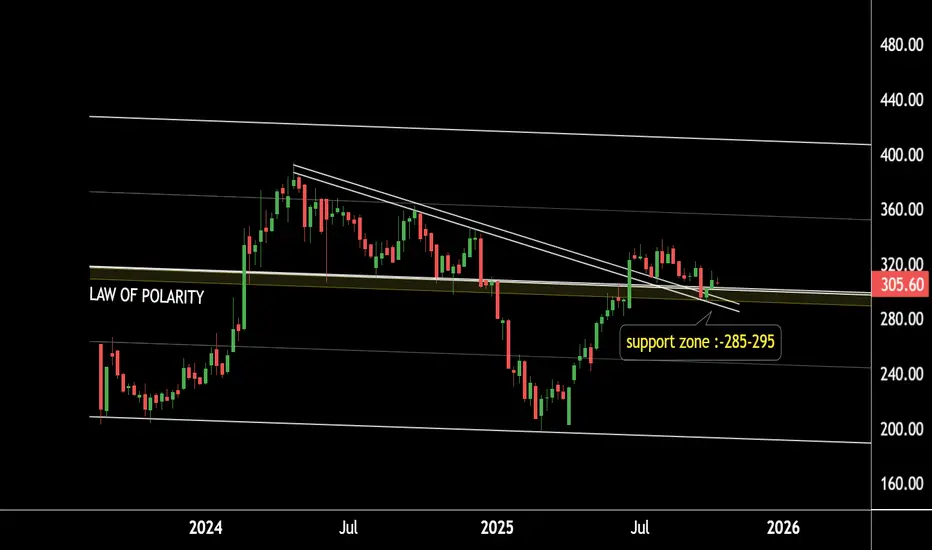
All Set for the Next Move — JIOFIN Ready to Fly High!JIOFIN Weekly Chart Analysis
JIO Financial is showing strong price action on the weekly timeframe.
The stock is currently holding above a key law of polarity support zone around the ₹285–₹295 range.
It is also sustaining above its breakout level, with the retesting zone aligning near ₹285–₹300.
If this zone continues to hold, we may witness higher levels in JIOFIN in the coming sessions.
Conclusion:
Holding above 285–300 could trigger the next bullish leg.
City Union Bank on Retest of Breakout Zone — Momentum Ahead?City Union Bank (CUB) – 4-Hour Chart Analysis
CUB is moving within a well-defined falling channel. Recently, it successfully broke out above the resistance zone at ₹210 and has retested this level, confirming it as support.
The stock is also respecting the Supertrend support on every pullback, continuing to make new highs. Currently, CUB is holding the Supertrend support and is likely to test the channel resistance around ₹240–250.
If the support zone between ₹200–210 holds, we can anticipate further upside in CUB.
Thank You !!

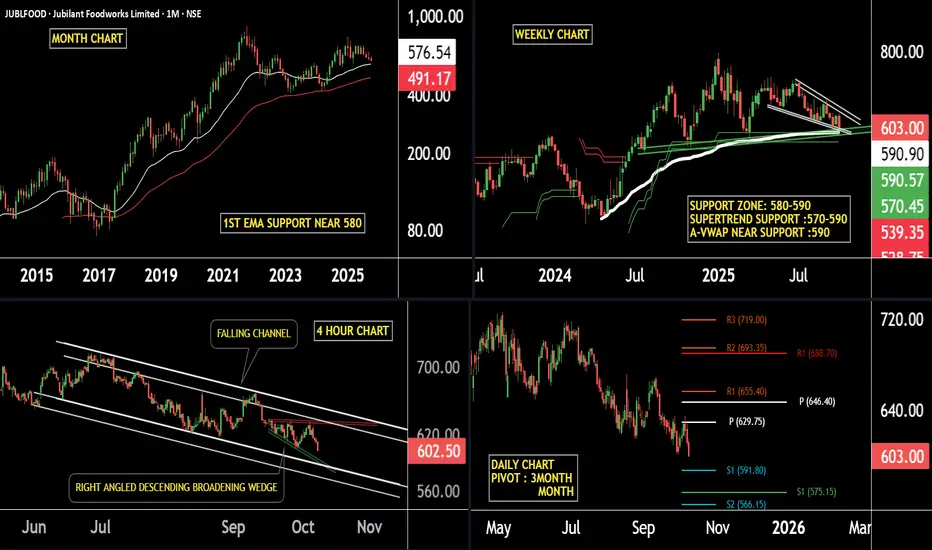
JUBLFOOD Strength at Support Indicates a Potential Rally AheadJUBLFOOD — Multi-Timeframe Technical Analysis
Monthly Timeframe:
JUBLFOOD is showing strong support on the EMA, with the first key support area positioned near the 580 level. This zone has historically acted as a major demand area, suggesting potential accumulation.
Weekly Timeframe:
The stock is currently trading near the 570–590 support zone, where the Supertrend indicator is also providing confirmation of support. Sustaining above this zone could trigger a potential reversal or upward momentum.
Daily Timeframe:
Both the quarterly and monthly pivot levels indicate strong support between 575–591, reinforcing this area as a crucial price base from a pivot-point perspective.
4-Hour Timeframe:
On the lower timeframe, JUBLFOOD is moving within a falling channel and forming a descending broadening wedge pattern near the 580 support zone. This structure suggests a possible bullish reversal if the price holds and breaks above the upper trendline.
if this level is sustain then we may see higher prices in stock.
thank you!!
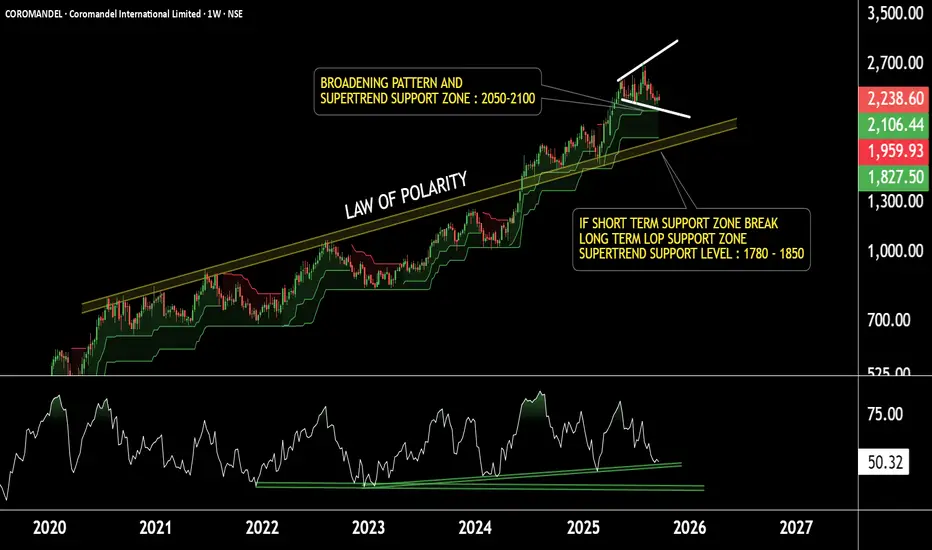
Strong Base, Strong Future – Coromandel Set to FlyWeekly Timeframe Analysis – Coromandel International
Coromandel is maintaining a Higher High – Higher Low (HH–HL) structure on the weekly timeframe and is currently taking support from the Supertrend indicator, with immediate support near ₹2100. The stock is also forming a broadening pattern with a strong support zone around ₹2050.
If the stock breaks below this zone, the next major polarity support lies near ₹1800–1850.
However, if the ₹2050–2100 support holds in the shorter timeframe, we may see upside momentum towards the upper boundary of the pattern near ₹2900.
In case the shorter-term support fails, we will wait for the long-term support before reassessing the potential targets.
Key Levels to Watch:
Support: ₹2050–2100 / ₹1800–1850
Resistance / Potential Target: ₹2900
TATA CHEMICALS on Full Momentum – Don’t Miss the RideTATA CHEMICALS – 4 Hour Timeframe Update
Tata Chemicals is currently forming a broadening pattern and is in the process of completing its 4th leg.
The stock is showing strong momentum, supported by the Supertrend indicator, and continues to make new highs.
Support Zone: 980 – 990
Potential Upside Target: 1050 – 1070 (valid only if the support holds)
Thank you!

Exide Industries Ready for the Next Bull Run !! Powering Up !!there are two chart of Exide Industries.
In a first chart: EXIDEIND is moving in a well defined parallel channel and currently trading near at support 365-375 range
In the second chart,EXIDEIND is respecting support at both the monthly pivot and the supertrend indicator, with the support zone positioned between ₹365-₹370.
EXIDEIND is currently sustaining below both the monthly and weekly pivot levels at ₹290. As long as the stock does not break above this pivot zone, the momentum is expected to remain weak.
If this level is suatin then ,we may see higher prices in EXIDEIND.
Thank you !!

GAIL at Best Support zone !! There are two chart of Gail on Daily timeframe.
On the first chart Gail is moving in well defined parallel channel with support near at 178-180 zone.
Daily RSI is also taking support and bouncing back, indicating a revival in short-term momentum and strengthening the overall bullish setup.
On the second chart , the stock is bouncing from the supertrend support around ₹180, reinforcing bullish sentiment. However, on the shorter timeframe, the supertrend indicator is acting as resistance near ₹192, which needs to be breached for further upside continuation.
Thank You !!

BITCOIN POTENTIAL CHANGE IN STRUCTURE (18h)Based on historical backtest of trade strategy.
18H BTC HEIKINASHI
If the candle closes at or above the indicated value of the purple line as shown,
typical trade is 23 bars with and average profit of 8.18%.
This would be a longer term/higher time frame change in structure for BITCOIN.
60k double bottom is still in uptrend. Lower time frames are consolidating, then higher.
Currently the price has traded into the the 66k zone, nearly confirmed in the 50% retracement of the Fib. from the 73.6k high. An 18hr buy signal would conclude 70-72k price targets and likely new all time high possibilities.
*** STILL PENDING AN 18HR CANDLE CLOSE ABOVE THE PURPLE LINE *****
Will update if / when the signal is initiated
feel free to message for signal settings

SOXS goes LONG Inversing SOXL SOXS on the 30-minute chart has reversed from a trend down to an early uptrend. This is
confirmed by a variety of indicators including the ATR/ U BOT indicator reset to a period of 4,
the relative volume indicator showing buying volume spikes instead of selling spikes, as well
as the squeeze indicator changes from a green negative histogram to a positive one. Many semi
conductor stocks have had major price runs upside. The time has come to watch them
for reversals. I will close my SOXL position in favor of a new long trade in SOXS.

NDQ100 8/15 5am SELL SIGNAL 1hr chart75%w strategy , 12:1 RR, .65% avg winning trade, 0500 EST.
1st TP .62% 15080
2nd TP .85% 15050
3rd runner : close trade/ new signal.
NDQ100 Eightcap, Nasdaq cash, US100, tech.
Typical trades last 16 hr. Close all position/ SL at any time new, 1hr chart signal is given.
Will update as trade progresses.
ALL 3 INDICATORS: SUPER PIVOT: DYNAMIC MONEY FLOW: LINEAR REGRESSION/RSI
ARE DOWNWARD SLOPING.
- NO CANDLES ARE NEEDED TO TRADE -

NDQ100 (1h) SELL SIGNAL 8-10-23 0800 73%w 31.3PF 11.5R/RNDQ100 SELL SIGNAL AVG WIN TRADE .88% AVG TRADE .62%
TP 15122
TP 15102
TP3 reversal of signal Av

MCX LIVE TRADING IN ALUMINIUM SHORT SETUPEntry: 204.40
Stop Loss: 204.60
Take Profit: 203.95
Time: 8:00 PM IST
Reason for entry: super trend indicating a good selling setup in 5 mins and 15 minutes timeframe.

NO CANDLES NEEDED $EIGHTCAP:NDQ100 I can trade with out candles.... Thanks to
@alexgrover
©KivancOzbilgic
@TradingView
© HigherOnlyCrypto
@ LuxAlgo
© Zeiierman RafaelZioni
EIGHTCAP:NDQ100

This Pivot Point Supertrend Strategy has up to 90% Success!Traders,
I'll review the Pivot Point Supertrend Trading Strategy in this video. This strategy has up to a 90% success rate with an avg. of 80-100% profits weekly. I think it's well worth our time to review and potentially implement or even automate going forward. Enjoy.
Stew

TQQQ - Price Targets & Stop Loss📈 What’s up investors! 📉
Welcome back to another one of
💡“Mike’s Ideas”.💡
I post as I find signals… these signals are based on the personal rules I have built and follow in order to make up what I call the “SST Strategy”. Follow for more ideas in the future!!
I have 4 levels marked and colour coded on the Chart.
These levels are:
⚪ White = Entry Point
🔴 Red = Stop Loss
🟢 Green = 1.2:1 Risk Reward Ratio
🟡 Yellow = 1.5:1 Risk Reward Ratio
🔵 Blue = 2:1 Risk Reward Ratio
👀 So what are we looking at today…!!!
🚨( TQQQ ) ProShares UltraPro QQQ🚨
The fund invests in financial instruments that ProShare Advisors believes, in combination, should produce daily returns consistent with the fund's investment objective. The index includes 100 of the largest domestic and international non-financial companies listed on The Nasdaq Stock Market based on market capitalization. The fund is non-diversified.

T - Price Targets & Stop Loss📈 What’s up investors! 📉
Welcome back to another one of
💡“Mike’s Ideas”.💡
I post as I find signals… these signals are based on the personal rules I have built and follow in order to make up what I call the “SST Strategy”. Follow for more ideas in the future!!
I have 4 levels marked and colour coded on the Chart.
These levels are:
⚪ White = Entry Point
🔴 Red = Stop Loss
🟢 Green = 1.2:1 Risk Reward Ratio
🟡 Yellow = 1.5:1 Risk Reward Ratio
🔵 Blue = 2:1 Risk Reward Ratio
👀 So what are we looking at today…!!!
🚨( T ) AT&T Inc.🚨
Provides telecommunications, media, and technology services worldwide. Its Communications segment offers wireless voice and data communications services; and sells handsets, wireless data cards, wireless computing devices, and carrying cases and hands-free devices through its own company-owned stores, agents, and third-party retail stores. It also provides data, voice, security, cloud solutions, outsourcing, and managed and professional services, as well as customer premises equipment for multinational corporations, small and mid-sized businesses, governmental, and wholesale customers. In addition, this segment offers broadband fiber and legacy telephony voice communication services to residential customers. It markets its communications services and products under the AT&T, Cricket, AT&T PREPAID, and AT&T Fiber brand names. The company's Latin America segment provides wireless services in Mexico; and video services in Latin America. This segment markets its services and products under the AT&T and Unefon brand names. The company was formerly known as SBC Communications Inc. and changed its name to AT&T Inc. in 2005. AT&T Inc. was incorporated in 1983 and is headquartered in Dallas, Texas.
