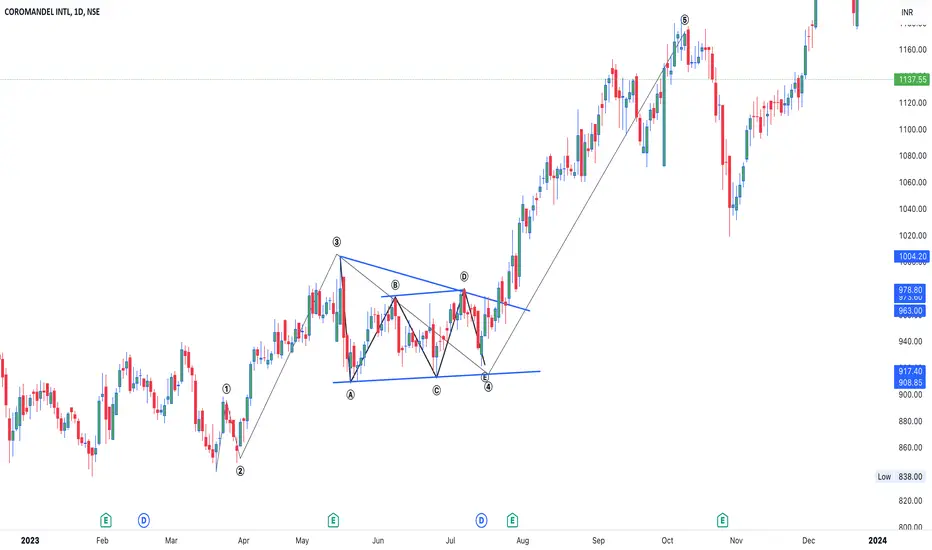
Coromandel at Key Support Zone – Watching for a Potential BounceThis is the daily timeframe chart of Coromandel.
The stock is showing a strong Law of Polarity working since 2018.
A major support zone is near 1800 - 1900 .
Whenever the price approaches this level, the stock tends to reverse from support.
From this zone, the stock has previously moved higher a
Coromandel International Limited
No trades
No trades
Compare with Coromandel International Limited
62.2 INR
19.56 B INR
203.14 B INR
119.78 M
Next report date
—
Report period
—
EPS estimate
—
Revenue estimate
—
Details
Sector
Industry
CEO
S. Sankarasubramanian
Website
Headquarters
Chennai
Founded
1961
IPO date
Feb 14, 1995
ISIN
INE169A01031
FIGI
BBG000CQ8JV4
Identifiers
ISIN INE169A01031
Coromandel International Ltd. engages in the manufacture and market of fertilizers and pesticides products. It operates through the Nutrient and Other Allied Business, and Crop Protection segments. The Nutrients and Other Allied Business segment consists of specialty nutrients and organic fertilizers. The Crop Protection segment produces insecticides, fungicides, and herbicides. The company was founded on October 16, 1961 and is headquartered in Chennai, India.
Review and plan for 15th December 2025Nifty future and banknifty future analysis and intraday plan.
This video is for information/education purpose only. you are 100% responsible for any actions you take by reading/viewing this post.
please consult your financial advisor before taking any action.
----Vinaykumar hiremath, CMT
Strong Base, Strong Future – Coromandel Set to FlyWeekly Timeframe Analysis – Coromandel International
Coromandel is maintaining a Higher High – Higher Low (HH–HL) structure on the weekly timeframe and is currently taking support from the Supertrend indicator, with immediate support near ₹2100. The stock is also forming a broadening pattern with a
Coromandel International Ltd – Fresh Breakout Alert🚀 Coromandel International Ltd – Fresh Breakout Alert
💰 Capital to Deploy:20k
✅ Investing Price:2370–2400
📈 Breakout Price: 2356
🛑 Stoploss: 2118
🎯 Targets: 3419
RT 🔄 for Max Reach&Visibility
#StocksInFocus #StocksToBuy #StockMarketIndia #StocksToWatch #StocksToTrade
COROMANDEL SWING TRADE SETUP📊 Price Action & Trend Analysis
Analyzing market trends using price action, key support/resistance levels, and candlestick patterns to identify high-probability trade setups.
Always follow the trend and manage risk wisely!
Price Action Analysis Interprets Market Movements Using Patterns And Trend
See all ideas
Summarizing what the indicators are suggesting.
Neutral
SellBuy
Strong sellStrong buy
Strong sellSellNeutralBuyStrong buy
Neutral
SellBuy
Strong sellStrong buy
Strong sellSellNeutralBuyStrong buy
Neutral
SellBuy
Strong sellStrong buy
Strong sellSellNeutralBuyStrong buy
An aggregate view of professional's ratings.
Neutral
SellBuy
Strong sellStrong buy
Strong sellSellNeutralBuyStrong buy
Neutral
SellBuy
Strong sellStrong buy
Strong sellSellNeutralBuyStrong buy
Neutral
SellBuy
Strong sellStrong buy
Strong sellSellNeutralBuyStrong buy
Displays a symbol's price movements over previous years to identify recurring trends.
Frequently asked questions
The current price of COROMANDEL is 2,095.3 INR — it has increased by 0.31% in the past 24 hours. Watch Coromandel International Limited stock price performance more closely on the chart.
Depending on the exchange, the stock ticker may vary. For instance, on NSE exchange Coromandel International Limited stocks are traded under the ticker COROMANDEL.
COROMANDEL stock has risen by 1.06% compared to the previous week, the month change is a 0.98% rise, over the last year Coromandel International Limited has showed a −7.40% decrease.
We've gathered analysts' opinions on Coromandel International Limited future price: according to them, COROMANDEL price has a max estimate of 2,951.00 INR and a min estimate of 2,067.00 INR. Watch COROMANDEL chart and read a more detailed Coromandel International Limited stock forecast: see what analysts think of Coromandel International Limited and suggest that you do with its stocks.
COROMANDEL reached its all-time high on Jul 31, 2025 with the price of 2,718.9 INR, and its all-time low was 97.5 INR and was reached on Nov 6, 2009. View more price dynamics on COROMANDEL chart.
See other stocks reaching their highest and lowest prices.
COROMANDEL stock is 1.49% volatile and has beta coefficient of 1.13. Track Coromandel International Limited stock price on the chart and check out the list of the most volatile stocks — is Coromandel International Limited there?
Today Coromandel International Limited has the market capitalization of 617.04 B, it has decreased by −0.47% over the last week.
Yes, you can track Coromandel International Limited financials in yearly and quarterly reports right on TradingView.
Coromandel International Limited is going to release the next earnings report on Oct 22, 2026. Keep track of upcoming events with our Earnings Calendar.
Coromandel International Limited revenue for the last quarter amounts to 81.65 B INR, despite the estimated figure of 79.17 B INR. In the next quarter, revenue is expected to reach 111.09 B INR.
COROMANDEL net income for the last quarter is 3.81 B INR, while the quarter before that showed 1.40 B INR of net income which accounts for 0.00% change. Track more Coromandel International Limited financial stats to get the full picture.
Coromandel International Limited dividend yield was 0.58% in 2025, and payout ratio reached 16.58%. The year before the numbers were 0.61% and 17.10% correspondingly. See high-dividend stocks and find more opportunities for your portfolio.
As of Aug 16, 2026, the company has 21.46 K employees. See our rating of the largest employees — is Coromandel International Limited on this list?
EBITDA measures a company's operating performance, its growth signifies an improvement in the efficiency of a company. Coromandel International Limited EBITDA is 31.90 B INR, and current EBITDA margin is −37.84%. See more stats in Coromandel International Limited financial statements.
Like other stocks, COROMANDEL shares are traded on stock exchanges, e.g. Nasdaq, Nyse, Euronext, and the easiest way to buy them is through an online stock broker. To do this, you need to open an account and follow a broker's procedures, then start trading. You can trade Coromandel International Limited stock right from TradingView charts — choose your broker and connect to your account.
Investing in stocks requires a comprehensive research: you should carefully study all the available data, e.g. company's financials, related news, and its technical analysis. So Coromandel International Limited technincal analysis shows the buy rating today, and its 1 week rating is buy. Since market conditions are prone to changes, it's worth looking a bit further into the future — according to the 1 month rating Coromandel International Limited stock shows the buy signal. See more of Coromandel International Limited technicals for a more comprehensive analysis.