GBP/USD - Rising Channel Pattern (11.02.2026)📝 Description 🔍 Setup OANDA:GBPUSD
GBP/USD is respecting a rising channel structure, with price recently bouncing from the cloud support + channel base confluence (Point D).
Key observations:
✅Clean reaction from Fibonacci zone
✅Higher low formation inside the channel
✅Price reclaiming short-term moving average
✅Buyers stepping in at demand zone
This suggests bullish momentum is building as long as structure holds.
🟥 Support Zone: 1.3630 – 1.3620
🟩 1st Resistance: 1.3765
🟩 2nd Resistance: 1.3824
Volume profile shows strong participation near support, making it a key defense area.
#GBPUSD #Forex #PriceAction #TrendTrading #SupportResistance #Fibonacci #TradingView #SmartMoney #RiskManagement #FXTrading
⚠️ Disclaimer
This analysis is for educational purposes only, not financial advice.
Always use proper risk management and your own trading plan.
💬 Support the Idea👍 Like if you’re bullish on GBP/USD
💬 Comment: Continuation or fake breakout? 🔁 Share with fellow traders
Supply_and_demand

EURUSD Equal Highs Formed Before Bearish ContinuationQuick Summary
EURUSD formed Equal Highs after the recent strong rally and the Price is now likely targeting a demand zone before continuing lower
The overall move remains corrective within a broader bearish reaction from the monthly timeframe
Target remains 1.17665
Short entries require a clear CHOCH or strong rejection confirmation
Full Analysis
Following the strong bullish expansion, EURUSD has now formed Equal Highs (EQH), creating a clear liquidity pool above price.
This structure suggests that the recent rally may have primarily aimed at engineering liquidity rather than initiating a sustainable bullish trend.
The pair is now expected to target a nearby demand zone as part of a corrective retracement before resuming its broader bearish continuation.
The downside objective remains 1.17665, aligning with the current bearish order flow and the strong reaction previously initiated from the monthly timeframe.
Despite the recent upside movement, bearish pressure remains dominant.
However, entering short positions directly from this area carries risk.
A confirmed Change of Character (CHOCH) on lower timeframes or a strong rejection signal (such as a clear bearish engulfing candle or displacement move) is required to validate the entry

EURUSD Corrective Rally Before Bearish ContinuationQuick Summary
EURUSD is expected to continue a corrective move higher toward 1.19632
This move is driven by an unfilled liquidity void left behind during the recent decline
The upside is considered corrective on the lower time frames, not a trend reversal
After filling this imbalance price is expected to resume its bearish continuation
Full Analysis
EURUSD remains in a bearish environment despite the recent downside extension
The market has left a clear liquidity void behind, which increases the probability of a corrective rally toward the 1.19632 level
This upside move should be viewed as a retracement on the lower time frames rather than a shift in overall market direction
Additionally, the previous low represents a strong liquidity area since price did not react from the nearby order block
This behavior acts as inducement, encouraging price to move higher before targeting liquidity to the downside
Once price reaches the liquidity void and completes the corrective phase, the expectation is for sellers to re-enter the market
Bearish continuation setups should only be considered after clear rejection or a shift in market structure on the lower time frames

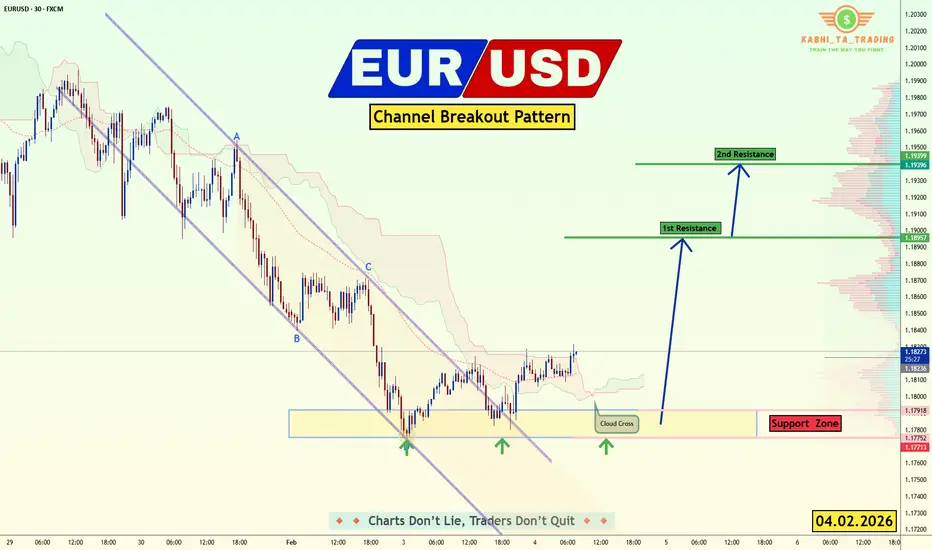
EUR/USD - Upside Expansion Next? (04.02.2026)📝 Description🔍 Setup FX:EURUSD
EUR/USD has been trading inside a descending channel and recently showed signs of structure shift after breaking and retesting the channel boundary.
Price reacted multiple times from the demand/support zone, forming higher lows.
Ichimoku shows a cloud cross and improving momentum, hinting at potential upside continuation.
This suggests sellers are weakening while buyers gradually gain control.
📍 Support & Resistance
🟥 Support Zone: 1.1790 – 1.1770
🟩 1st Resistance: 1.1895
🟩 2nd Resistance: 1.1940
⚠️ Disclaimer
This idea is for educational purposes only.
Forex trading involves risk. Always manage your risk and follow your own plan.
💬 Support the Idea 👍 Like if you see bullish continuation
💬 🔁 Share with fellow EUR/USD traders
#EURUSD #Forex #PriceAction #ChannelBreakout #BullishSetup #TradingView #SupportResistance #IntradayTrading #Kabhi_TATrading
XAUUSD BUYThis can be viewed as a buy setup because price just swept liquidity below the recent lows, then snapped back strongly into structure, a classic stop-hunt and displacement move. After rejecting the lower demand zone, XAUUSD reclaimed short-term support and is now consolidating above it while holding above the rising EMAs, suggesting buyers are stepping in. The pullback into the grey demand box looks corrective rather than impulsive, which favors continuation toward the overhead supply/imbalance area

XAUUSD (Gold) – 15m | Short-Bias Technical ObservationPrice recently delivered a strong impulsive bullish move, followed by a pullback from the recent high, indicating potential profit-taking and short-term exhaustion. The market has already reacted near a prior structure level (BOS area), which now appears to be acting as resistance.
The current pullback aligns with the Fibonacci Golden Zone (50%–61.8%), overlapping with a previous consolidation zone, suggesting this area may act as a decision zone rather than immediate continuation.
From a market-structure perspective:
The impulsive move has paused
Momentum is cooling after rejection from the high
Price is currently reacting within a premium zone, where sellers may become active if weakness continues
If price fails to reclaim the broken structure decisively, short-term downside pressure could extend toward lower liquidity levels. However, a strong bullish reaction from the highlighted zone would invalidate the short-bias and favor continuation.
📌 This is a technical observation, not a trade signal.
📌 Always wait for confirmation and manage risk accordingly.

Buy NATCOPHARM For Long Term With Target of 2560Natco Pharma Finished Its Correction As Per Fib Retracement Buy Natco Pharma For Long Term

Lets get the NFP started EURUSD this is my analysis on Eurusd looking to sell EU on the 4hr supply
pls don not trade this it is just an idea
Nfp is cr*zy pls dont not engage

EURUSD Lower Timeframe Bearish ContinuationQuick Summary
EURUSD continues to trade bearish on lower timeframes and The move appears to be part of a daily timeframe correction, Price may retrace higher toward 1.19035
This level aligns with an H4 supply correction zone
After that continuation lower is expected to fill the liquidity void left uncorrected from the previous month
Full Analysis
EURUSD remains in a bearish phase on the lower timeframes
This downside movement is developing as a corrective leg within the daily structure
A temporary pullback to the upside is possible and Price may rise toward the 1.19035 level
This area represents a supply correction zone on the 4 hour chart
If price reacts from this zone the expectation is for bearish continuation
The main objective of this move is to fill the liquidity void that was left without correction during the previous month
As long as lower timeframe structure stays bearish any upside movement should be treated as corrective

EURUSD Deep Pullback ScenarioQuick Summary
EURUSD rallied strongly throughout the last week gaining more than 250 pips without a proper correction
A pullback is highly likely to rebalance the fair value gaps and the Key levels to watch are 1.17687 and 1.17189
A bullish reaction may occur after testing the second FVG due to inducement at that level
Full Analysis
After the strong upside movement on EURUSD throughout the week price rise more than 250 pips without performing a meaningful retracement
Such impulsive moves usually leave significant imbalance in the market which often leads to a corrective phase
Because of this a downside move is highly likely in order to rebalance the fair value gaps left behind
The first area of interest sits around 1.17687 while the second fair value gap is located near 1.17189
Price may continue lower until the second FVG is tested
This area holds additional importance because there is inducement present which can attract liquidity and support a bullish reaction
If price reaches this zone and shows strength it may serve as the base for the next upside continuation

XAUUSD Intraday Plan | Can Bulls Reclaim Control?Gold failed to sustain the bullish move into 5118 yesterday, which was followed by a sharp decline into the first reaction zone, where support is holding for now.
For bulls to regain control, price needs to reclaim 4957, which would open the door for another push toward 5041 and 5118. If the current support zone fails, watch the lower support zones closely for potential reactions.
📌 Key levels to watch:
Resistance:
4957
5041
5118
Support:
4867
4792
4676
4586
👉Let key levels guide your decisions — wait for confirmation and manage risk accordingly.
⚠️ Volatility remains high and the range is wide — manage risk and position size carefully.

SELL XAUUSDGold is now trading back into a clear supply zone after a sharp impulsive bounce from the lows, and price is stalling right below a descending trendline and prior structure resistance. This area also aligns with previous rejection points, suggesting sellers may step back in to defend the zone. The bullish move into resistance looks corrective rather than impulsive. From here, a short-term sell makes sense targeting the nearest demand zone below and the recent swing low, where price previously reacted strongly before the rally.

EURUSD Additional Supply Reaction ZoneQuick Summary
Besides the previously mentioned point of interest EURUSD may also react from 1.18422
This level represents a strong supply zone
An inducement area sits just below which could allow a liquidity sweep before continuation
Given the strong bearish momentum price may also ignore this zone and continue lower
Full Analysis
In addition to the point of interest highlighted yesterday there is another potential reaction zone around 1.18422
This area represents a strong supply zone that could trigger a bearish response
Just below this level there is a clear inducement zone
This structure may encourage a brief push higher to sweep liquidity before the market resumes its downside move
However it is important to note that EURUSD is currently falling with strong momentum
When selling pressure is this aggressive price may ignore nearby supply zones and continue lower without providing a clean reaction
For that reason this area should be monitored closely rather than traded blindly

BUY XAUUSDGold is approaching a key demand zone around 4672 after an extended short-term sell-off, where price previously reacted and liquidity is likely resting. This area sits near structural support and comes after bearish momentum that looks stretched, making it a logical place for buyers to step in if rejection appears. If price slows into the zone and prints bullish reaction candles or a short-term structure shift on lower timeframes, it would support a corrective rebound toward the higher resistance area marked above, favoring a tactical long setup rather than chasing the breakdown lower.

$ETH / Ethereum - Don't Try and Catch KnivesUpdated ETH chart and thoughts:
I will wait until our weekly close to remove the demand/support weekly area near $2800 for further invalidation. I will then add a new supply/resistance area near $3000.
Areas of interest for a bounce/reversal are in green.
Not calling anything until I see slowed selling pressure. Don’t try and catch knives out here hoping for v shape reversal. A foundational bottom takes time to form.
There will be opportunities to buy and add more.

My EURJPY analysis this morning my bro said I should help him check so I just want to use this medium to send to people interested in Eurjpy

ETHUSDT Moves on weekly supportThe current situation for Ethereum remains tense and largely determines the mid-term direction of movement. The price has approached the 2.300-2.491 level, which formally appears to have been broken. However, until the market breaks out of its current accumulation and consolidates below, this range still maintains support status. This very moment marks the situation as borderline, as the structure has already weakened, but a final break has not yet occurred.
A noticeable feature of the current phase is extremely high volume activity from wheels. Both large bulls and bears regularly enter the market, indicating a fierce struggle for price control. This is not a passive sideways movement, but an active redistribution of positions, where neither side has yet gained a sustainable advantage. Such conditions often precede a strong momentum, but the direction of this momentum will directly depend on who is the first to break through key levels and consolidate.
If the price breaks out of the current accumulation and confirms consolidation below the 2,300-2,491 zone, the market will likely begin searching for deeper levels. The closest significant support in this scenario is the daily level of 1,647-1,655, where significant buying interest has historically been evident and where a new phase of stabilization or reversal could begin.
For bulls, the key objective is to hold the current weekly range and prevent a downward trend. If they manage to seize control and begin dominating volumes, ETH will have room to recover and further move higher. In this case, the logical target for volume distribution is the daily resistance of 2,774-2,788. This zone is where the next stage of the standoff should be expected, provided bears respond and once again attempt to seize the initiative. Until then, the market will remain in an active phase of the struggle, where volumes and the nature of consolidation at key levels will be decisive.

EURUSD Bearish Continuation From Liquidity ZoneQuick Summary
EURUSD may continue its bearish trend if price reacts from 1.18613 on the 15 minute chart and This level represents the completion of a liquidity void, There is clear liquidity resting below this zone
The downside target is the equal lows located around 85 pips from the entry area
Full Analysis
EURUSD is still aligned with a bearish scenario and continuation to the downside remains the preferred view
Price may attempt a short term pullback toward the 1.18613 level on the 15 minute timeframe
This zone represents the end of a well defined liquidity void which often acts as a reaction point
If price shows a bearish response from this area it would signal that sellers are still in control
Below this level there is visible liquidity which increases the probability of further downside movement
The market may use this reaction to continue lower and target the equal lows positioned roughly 85 pips below the potential entry zone
As always the reaction at the level is key
A clear rejection from 1.18613 would support continuation of the bearish move
Without confirmation patience is required as price may still be in a balancing phase

GBP/USD – Fundamental Drive in Play (30.01.2026)📝 Description 🔍 Setup (Market + Fundamentals) FX:GBPUSD
GBP/USD has rallied strongly but is now facing heavy selling pressure at a well-defined resistance zone. Multiple rejections from the same supply area signal buyer exhaustion.
On the fundamental side, USD strength is supported by:
1.New Fed leadership announcement
2.Political agreement to avoid a US government shutdown, reducing uncertainty and favoring the dollar
Technically, price is breaking below the rising trendline, with EMA & Ichimoku losing bullish momentum.
📍 Support & Resistance
🟨 Resistance Zone: 1.3825 – 1.3865
🟥 1st Support: 1.3600
🟥 2nd Support: 1.3500
Volume profile supports downside liquidity below current price
⚠️ Disclaimer
This analysis is for educational purposes only.
Forex trading involves risk — always use proper risk management and trade responsibly.
💬 Support the Idea 👍 Like if you see GBP/USD turning bearish
💬 Comment: Sell from resistance or wait for deeper confirmation?
🔁 Share with traders watching USD fundamentals
#GBPUSD #ForexTrading #FundamentalAnalysis #PriceAction #ResistanceZone #USDStrength #TradingView #Kabhi_TA_Trading

EUR/USD – Trendline Breakdown| Deeper Pullback Incoming?EUR/USD previously showed strong bullish momentum , but price is now losing strength after the breakout and has broken below the rising trendline. This shift suggests a potential corrective move toward lower key demand zones before the next major decision.
🔍 Technical Breakdown
📈 Previous bullish breakout into premium supply zone
❌ Trendline breakdown confirms momentum weakness
🔁 Failed continuation near highs → sellers stepping in
🔻 Downside targets aligned with:
First Key Support Zone (intraday demand)
Major Lower Demand Zone (structure support)
Bias remains bearish short-term unless price reclaims the trendline.
✅Psychological Discipline:
1️⃣Stick to plan – No Revenge Trades.
2️⃣Accept losing trades as part of the strategy.
3️⃣Risk only 1–2% of your account balance per trade.
✅ Support this analysis with a
LIKE 👍 | COMMENT 💬 | FOLLOW 🔔
It helps a lot & keeps the ideas coming!
⚠️ Disclaimer: This analysis is for educational purposes only and does not constitute financial advice. Forex trading involves high risk. Trade only with capital you can afford to lose and always do your own research.

EURUSD Bearish Continuation ConfirmationQuick Summary
EURUSD is expected to continue its bearish move and The downside target is 1.16672, Price is aiming to fill the H4 liquidity void
A confirmed break below 1.18329 will validate further selling
Sell entries should only be taken after this level is clearly broken
Full Analysis
After the strong bearish move on EURUSD the expectation is for continuation to the downside
Price is currently targeting the 1.16672 level which aligns with the liquidity void on the four hour timeframe
This liquidity void represents unfinished price action and often acts as a magnet during bearish conditions
As long as price continues to respect the current bearish structure this downside objective remains valid
The key confirmation level for this scenario is 1.18329
A clear break below this level will confirm bearish continuation and validate sell setups

USD/CHF – Triangle Breakout Confirmed (30.01.2026)📝 Description🔍 Setup FX:USDCHF
USD/CHF formed a clear Triangle consolidation after a strong bearish move, showing lower highs and higher lows — compression before expansion.
Price has now broken above the descending trendline and is holding structure with a breakout & retest near the support zone.
EMA + Ichimoku support adds confluence for bullish continuation.
📍 Support & Resistance
🟥 Support Zone: 0.7635 – 0.7655
🟢 1st Resistance: 0.7817
🟢 2nd Resistance: 0.7870 – 0.7873
⚠️ Disclaimer
This analysis is for educational purposes only.
Forex trading involves risk — always use proper risk management and trade your plan.
💬 Support the Idea👍 Like if you’re bullish on USD/CHF
💬 Comment: Clean breakout or fake move?🔁 Share with traders watching CHF pairs
#USDCHF #ForexTrading #TriangleBreakout #PriceAction #TechnicalAnalysis #FXTrading #TradingView #Kabhi_TA_Trading

TROW Long 1D Investment Conservative TradeConservative Trade
+ long balance
+ volumed ICE
+ support zone
+ 1/2 correction
+ weak approach
+ biggest volume 2Sp-
+ last weak approach
Calculated affordable stop limit
1 to 2 R/R take profit
1M CounterTrend
"- short balance
+ volumed expanding ICE
+ support zone
+ weak approach
+ biggest volume 2Sp+
- price went too deep into neutral zone
- weak test didn't reach volume zone
+ 1/2 correction"
1Y Trend
"+ long impulse
+ 1/2 correction
- strong approach
+ T2 level
+ supporting zone
+ volumed interaction bar"
