Attractive Bullish Gold SetupHey, it’s Erik!
XAUUSD is currently in a fascinating phase. After a strong pullback from the upper boundary of the ascending channel, gold is now heading toward the lower boundary. This region aligns with a key support zone, and a potential reaction here could propel the price back upward.
If buyers manage to defend this level, the potential for a rise to $4,380 is significant. This level coincides with the middle of the channel and previous resistance, making it a logical short-term target in this bullish market structure.
However, there’s an important caveat. If the market fails to hold this support, the bullish scenario could lose its validity, and we might see a continuation of the downward trend. That’s why it’s crucial to wait for clear confirmation before entering. A rejection wick, increased buying volume, or a bullish engulfing pattern are all key technical signals to watch for the right entry point.
So, what do you think? Ready to seize this opportunity, or do you see other risks? Share your thoughts with us!
Supply_and_demand

GBP/NZD - Wedge Breakdown (20.10.2025)📊 Setup Overview:
GBP/NZD has formed a Rising Wedge Pattern on the 30-min chart, signaling a potential trend reversal from the recent bullish structure. The pair has also completed a Cloud Cross, indicating early bearish momentum as price begins to break below the wedge support line. OANDA:GBPNZD
📈 Trade Plan: Bias: Bearish
Sell Entry Zone: Below 2.3400 (after candle close confirmation)
1st Target: 2.3288 ✅
2nd Target: 2.3277 🎯
Resistance Zone: 2.3479 – 2.3523
🧩 Technical Highlights:
1.Rising Wedge pattern breakdown – early bearish signal
2.Ichimoku Cloud Cross confirms downside pressure
3.Volume profile thinning below 2.34, showing potential liquidity vacuum
4.Clean bearish structure with clear risk–reward setup
#GBPNZD #ForexAnalysis #WedgePattern #BearishBreakout #Ichimoku #PriceAction #TechnicalAnalysis #ChartSetup #SwingTrade #TradingView #FXMarket #Kabhi_TA_Trading #ChartsDontLie #TradersDontQuit #ForexSignals
⚠️ Disclaimer:
This analysis is for educational purposes only and not financial advice.
Always confirm setups with your own analysis and manage risk properly before entering any trade.
💬 Support This Analysis:
If this setup helped your trading view — LIKE 👍, COMMENT 💬 your thoughts, and FOLLOW ✅ for more daily forex setups and chart breakdowns from Kabhi_TA_Trading!


XAU USD - keeps on giving in 2025Hello, it's been a while.
I've been on working building my pile in XAG, XAU reserves.
Now i am back, Gold is still giving a phenomenal return on printing up and right (meaning growth).
I don't know where price structure will end, however it's a highly probable chance we will hit $4,000USD per oz, and continue to raise.
Daily chart image shows my thought pattern and an opportunity I am waiting for price to revert to.
I'm referring to the Daily price chart and key counts are in line with Wave counting and supply and demand curve trading levels based on fair value gap intervals of weekly trading sessions plotted to a daily chart at intervals of 60.
Current wave - 3 of 5 in the Elliott wave count.
Master Key for zones
Red = Three Month
Blue = Monthly
Purple = weekly
Pink = Consolidative box example (Daily)
Orange = Daily
Risk Warning
Trading leveraged products such as Forex, commodities and CFDs, carries with it a high level of risk and so may not be suitable for every investor. Prior to trading the foreign exchange, commodity or CFD market, consider your investment objectives, level of experience and risk appetite. You should never risk more than you can afford to lose. If you fail to understand or are uncertain of the risks involved, please seek independent advice and remember to conduct due diligence as criteria varies to suit the individual.
Below are some of the take aways from the video - please listen again incase any detail is missed.
Do you enjoy the setups?
Professional analyst with 8+ years experience in the capital markets
Focus on technical output not fundamentals
Focus on investing for long term positional moves
Provide updates where necessary - with new updated ideas tracking the progress.
If you like the idea, please leave a like or comment.
To all the followers, thank you for your continued support.
Thanks,
LVPA MMXXIV

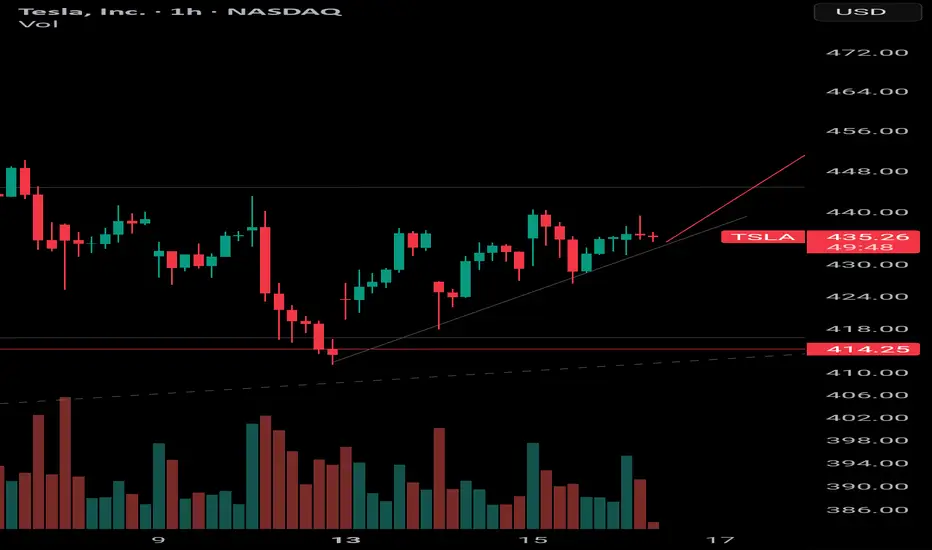
TSLA last point of support before push UPWhere the sellers at? Support is holding well close to a local resistance. Unless buyers are exhausted and wait for a pull back, we're going up from here into selling zone
EUR/AUD - Bears in Control - Key Zones to WatchPrice is respecting the downtrend channel 📉 and sellers are showing strength near the Key Zone. If rejection holds, we could see fresh downside moves toward the marked support levels.
🎯 Targets:
1️⃣ 1.7700
2️⃣ 1.7650
👀 Watching closely for bearish continuation!
#EURAUD #FXSetup #ForexSignals
🔥 Support this idea with a LIKE 👍 & COMMENT 💬 Don’t forget to FOLLOW 🔔 for more setups daily.
⚠️ Disclaimer: This is not financial advice. Trade at your own risk and always do your own analysis.

GBP/AUD Sellers in Control | Key Supports Ahead📉 GBP/AUD Analysis 📉
The pair is trading inside a descending channel, showing continuous bearish pressure. Sellers remain in control, and price is respecting lower highs with potential continuation toward the marked Key Zones below.
🔑 Levels to Watch:
Resistance: 2.0450 – 2.0470
Support: 2.0280 / 2.0200
⚠️ If price breaks and holds below the mid-support, we could see a further slide toward the lower key zone.
#GBPAUD #ForexTrading #TechnicalAnalysis
✅ Support the idea with a LIKE 👍, COMMENT 💬, and FOLLOW 🔔 for more chart updates!
📌 Disclaimer:
This is an educational analysis only and not financial advice. Please do your own research before trading.

GBP JPY - Wave D forming?Daily chart image shows my thought pattern and an opportunity I am waiting for price to revert to.
I'm referring to the Daily price chart and key counts are in line with Wave counting and supply and demand curve trading levels based on fair value gap intervals of weekly trading sessions plotted to a daily chart at intervals of 60.
Current wave -
Wave A: The first correction test (200+) - where a rejection into the impulse high - to form a weekly supply.
- Wave B: Deep testing of the lows into 184 territory, but keeps the rising channel weekly in tact.
- Wave C: Technical rebound exactly to the higher wick on the max top of the supply and settled in the marked zone - of a large volume of sell orders.
- Now to Wave D formation: 190? or below 189*? showing the weekly trend down to where the wav could end?
Master Key for zones
Red = Three Month
Blue = Monthly
Purple = weekly
Pink = Consolidative box example (Daily)
Orange = Daily
Risk Warning
Trading leveraged products such as Forex, commodities and CFDs, carries with it a high level of risk and so may not be suitable for every investor. Prior to trading the foreign exchange, commodity or CFD market, consider your investment objectives, level of experience and risk appetite. You should never risk more than you can afford to lose. If you fail to understand or are uncertain of the risks involved, please seek independent advice and remember to conduct due diligence as criteria varies to suit the individual.
Below are some of the take aways from the video - please listen again incase any detail is missed.
Do you enjoy the setups?
Professional analyst with 8+ years experience in the capital markets
Focus on technical output not fundamentals
Focus on investing for long term positional moves
Provide updates where necessary - with new updated ideas tracking the progress.
If you like the idea, please leave a like or comment.
To all the followers, thank you for your continued support.
Thanks,
LVPA MMXXIV

#BankNifty 10th October Friday - #CatchAndRead Bank nifty 10th October Friday - zigzag untadaa - #CatchAndRead
Follow my Yt channel... Link in dp

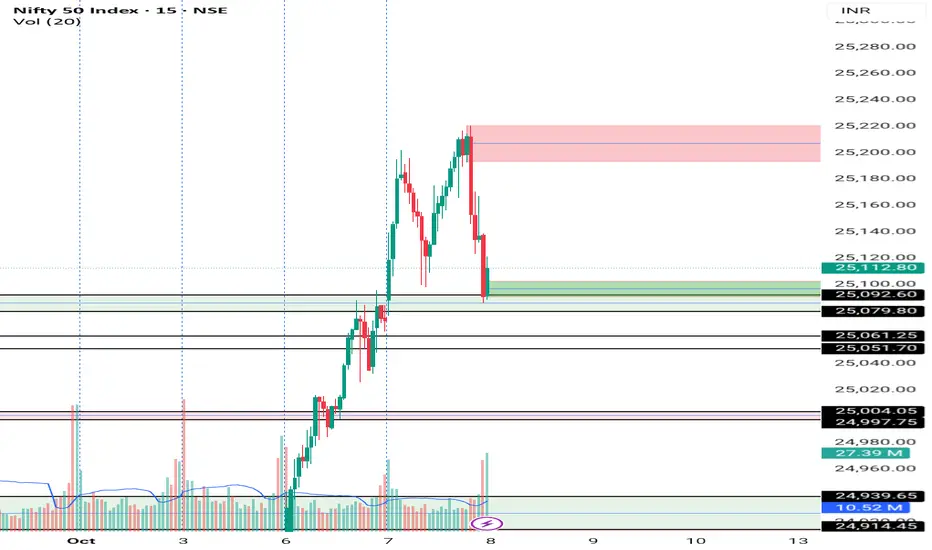
Today supply and demand levels 8th October Today supply and demand levels 8th October
Follow now my channel
Nifty supply demand 3rd OctoberNifty supply demand 3rd October
Check the third dated trading plan that uses supply and demand zones drawn from the chart before yesterday

AUD/JPY - Bearish Rejection from Key Zone📉 AUD/JPY Analysis 📉
Price is currently testing a key structure level after rejecting the upper zone. If bearish pressure continues, we could see a potential drop toward the highlighted Key Zones below. 🚨
🔑 Key Levels:
Resistance Zone: 96.10 – 96.30
Support Zones: 97.40 / 97.25
⚠️ Watch how price reacts around the resistance zone. A strong rejection could confirm the move toward the downside targets.
💬 Share your thoughts below – Do you expect AUD/JPY to continue bearish momentum or bounce back up?
#AUDJPY #ForexTrading #PriceAction #TechnicalAnalysis #FX #TradingView #ForexCommunity #ChartAnalysis #BearishSetup
✅ If you found this useful, don’t forget to LIKE 👍, COMMENT 💬, and FOLLOW 🔔 for more analysis!
📌 Disclaimer:
This analysis is for educational purposes only and not financial advice. Please do your own research before making any trading decisions.

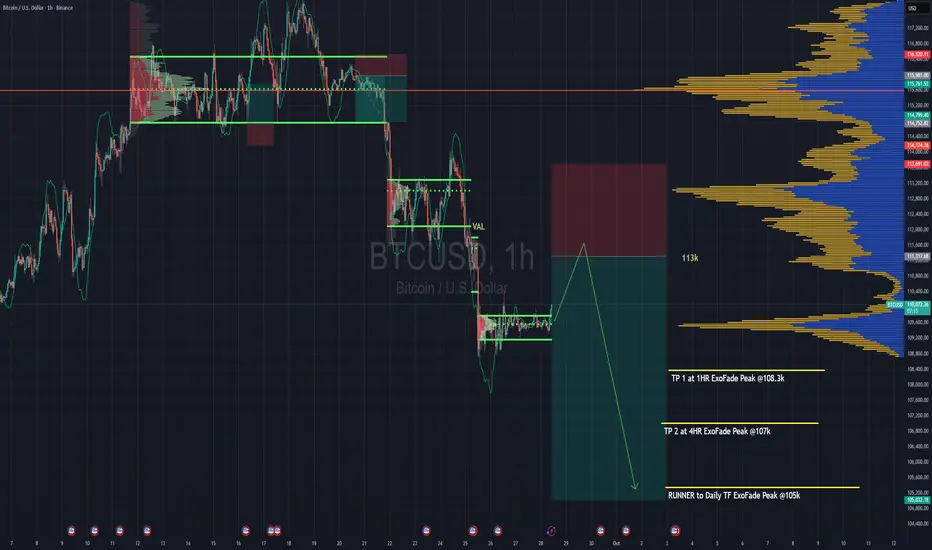
Looking to Short Bitcoin From Here : Winter Is Coming !!Looking to short BTC for a continuation of the downtrend.
Trend is your friend is what they say.
So we're basically going to wait for a pullback to 113k range then enter a sell.
The sell entry caters for both H4 & Daily timeframe trend, so it's a strong one.
The sell entry range also has the VAL of the last rotation we had from Sept 21st to Sept 24th when we finally broke down from it at 112k. That VAL should be a strong point for rejection, it'll be one of the places where we'll truly get to test the strength of the bears ( that's if we even make it that far )
TP targets are based on ExoFade peaks of the H1, H4 and Daily timeframe.. You can add the ExoFade to your charts to follow on your own charts as well.
VAL - Value Area Low of the volume profile
Strategy => Volume + Trend + Lots of coffee
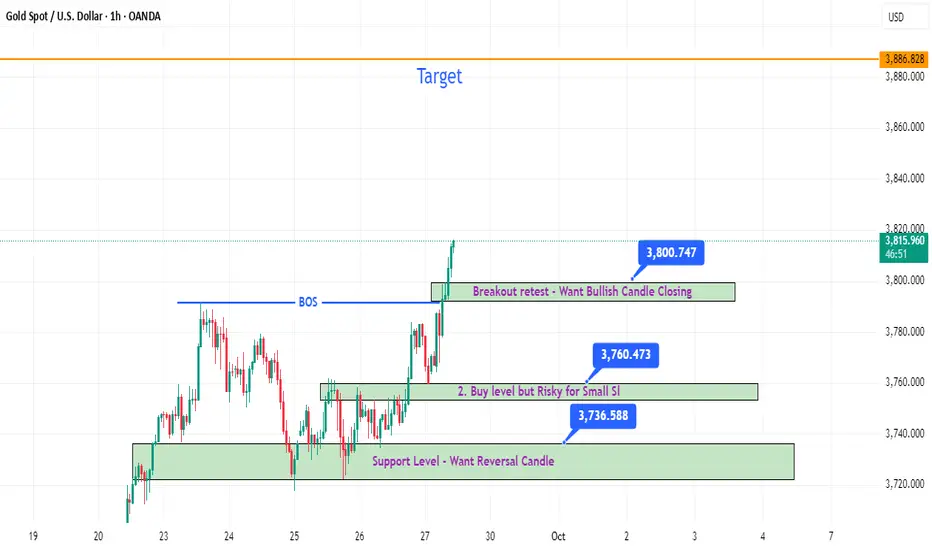
4 Hour Strong - Gold Next Level - DroidTradingGold Buying Level
Every Price Mention Possible Entry Zone.
If Tapped Take Entry as per your Risk - SL previous Candle low , Calculate SL right know.
3801 retest Level want Bullish Candle Closing - Target ( 3840-50 or 3885-90 ).
Keep SL, Book Your Daily Target
Webull Corporation — demand confirmation and growth potentialTechnical analysis: On the 4H chart, Webull Corporation (ticker BULL) is showing signs of a breakout from the accumulation channel. After a decline, the price stabilized in the 12.50–15.50 range, where demand confirmation is visible. The current level of 15.39 serves as a starting point for growth. The nearest upside targets are 17.40 and 20.40, with extended potential toward 25.30 and 41.00 if resistance is broken. Key support is located at 13.30–12.50, and losing this area may bring back bearish momentum.
Webull Corporation is a US-based fintech company offering online trading and investment services. Its platform provides retail investors with access to stocks, ETFs, options, and cryptocurrencies. Competing with Robinhood, Webull stands out thanks to advanced charts, analytics, and low fees. The growing popularity of online brokers and an expanding user base support the company’s long-term outlook.
As long as the accumulation structure holds and demand remains strong, the bullish scenario stays in focus. For long-term investors, the stock may be considered a buy-and-hold opportunity, supported by fintech sector growth and rising competition among online brokers.

Short Term Buy on 3749 Mitigation Gold is required to seek discount at 3749 mitigation, thus a short term buy is expected and hits 3772.

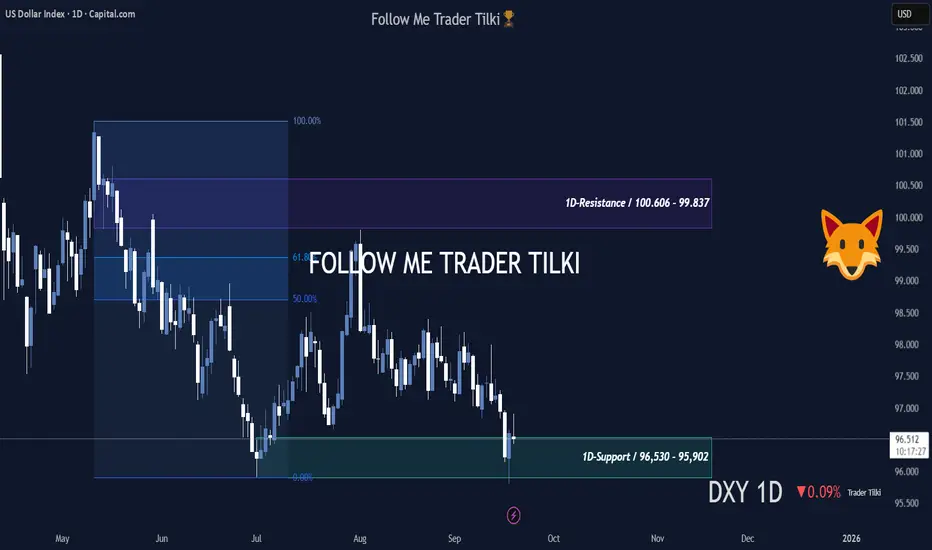
DXY at a Critical Juncture — What’s the Fed’s Next MoveHey Guys,
I’ve put together a swing-style analysis for the DXY.
This one’s been highly requested — my followers are valuable to me, and I never turn them down.
DXY Daily Levels:
- Resistance: 100.606 – 99.837
- Support: 96.530 – 95.902
From a fundamental perspective, the U.S. Dollar Index is currently dropping due to Fed policies.
No steps are being taken to push the dollar higher.
Because of this, investors are choosing gold as a safe haven instead of buying dollars.
Gold keeps hitting new ATHs, and naturally, the dollar index is sliding.
Unless the Fed takes action to support the dollar, this decline will continue.
In short, the drop in the dollar is entirely due to the policies implemented by the Fed Chair.
Remember — DXY isn’t heavily influenced by technical analysis; it’s driven by Fed policy.
That said, since the index has fallen so much, I believe we might see some steps taken in the coming months to lift the dollar.
I’ll be sharing updates right here.📢
Once support or resistance levels are broken, I’ll post new insights immediately.
Every like from you is my biggest motivation to keep sharing these analyses.
Thanks to all my friends who support me — you’re the best. ❤️
GBP/JPY - BOJ Holds Rates, Inflation Outlook RisesOANDA:GBPJPY #GBPJPY #Forex #Trading #FXAnalysis #TechnicalAnalysis #PriceAction #BankOfJapan #ForexTrader
The Bank of Japan decided to keep interest rates unchanged while raising its inflation forecast. This shows caution but also optimism that cooperation with the U.S. could support Japan’s economic stability.
On the chart, demand zones (red) are acting as key support, with potential bullish targets around 200.500 – 201.100 (green key zones). If buyers defend these support levels, we could see momentum pushing GBP/JPY toward the upside targets.
Traders should watch price reaction at support for potential long entries.
👍 Support with a like & drop your thoughts in the comments!
⚠️ Disclaimer: This analysis is for educational purposes only and should not be considered financial advice. Always do your own research before making trading decisions.

GBPJPY | TAPPED A WEEKLY SUPPLY Weekly CHoCH and supply spotted .
price is reacting from the weekly supply after sweeping through yersterday HIGH So my bias is SHORTS so lets see if we get that push we need

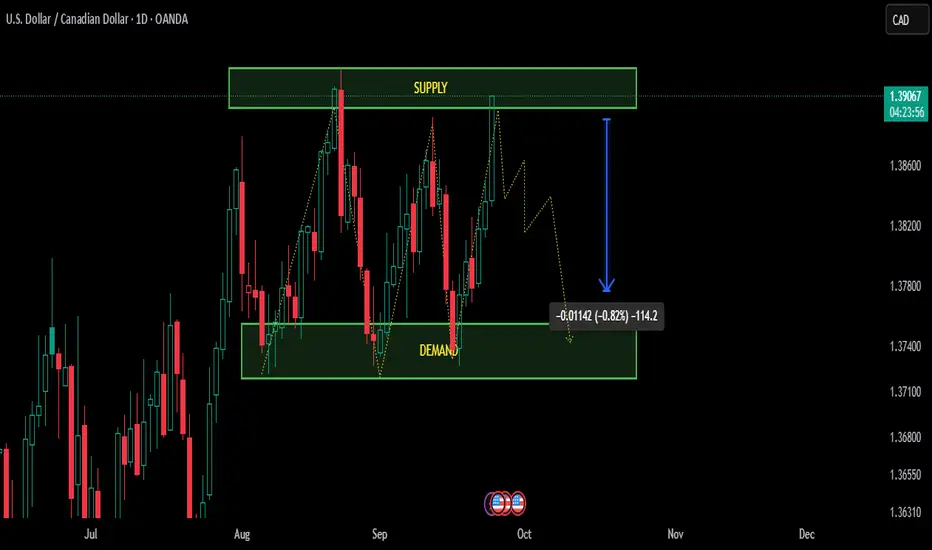
A perfect Supply and Demand USDCADA perfect Supply and Demand is created by the market on daily time frame, But maybe possible a little bit Liquidity sweep maybe created before down trend on above the supply zone ...
IMPORTANT POINTS;
PAIR: USDCAD
TIME FRAME: Daily
Liquidity sweeps maybe created by market makers be aware
Always put STOPLOSS
USD/JPY - Bank of Japan Holds Rates, Inflation RisingFX:USDJPY #USDJPY #Forex #Trading #FXAnalysis #TechnicalAnalysis #PriceAction #BankOfJapan #ForexTrader #DayTrading #SwingTrading
The Bank of Japan kept interest rates unchanged while raising its inflation forecast. This signals caution but also optimism that cooperation with the U.S. could help stabilize Japan’s economy.
On the chart, we see key demand zones (red) holding as potential support, with upside targets toward 148.700 – 149.200 (green key zones). If price sustains above the demand area, bullish momentum could push USD/JPY higher into these resistance levels.
Traders should watch for confirmation signals around support before entering long positions.
👍 Support with a like & drop your thoughts in the comments!
⚠️ Disclaimer: This analysis is for educational purposes only and should not be considered financial advice. Always do your own research before making trading decisions.

USDX: demand zone holds but downside pressure remainsThe US dollar index remains under pressure, trading within a descending channel. The recent bounce from the support zone around 96.30–96.90 stalled at the EMAs and the supply zone near 98.30–98.60, where sellers reappeared. On the 4H chart, price has failed to sustain above 97.80, keeping the bearish scenario in play.
It is also important to note that the index is trading below the 200 EMA, reinforcing the bearish bias and signaling that sustainable recovery is less likely without strong fundamental catalysts.
If 96.90 breaks, the next downside target is 96.30, followed by 95.40. Stronger bearish momentum could even push the index toward 94.00, signaling further dollar weakness. For now, 96.30 acts as the key support barrier.
From a fundamental perspective, the dollar index remains weighed down by expectations of a dovish Fed and lower yields. Any hawkish surprise from Fed officials could lift price back toward 98.50, but the structure still favors bearish continuation.
This is exactly the kind of situation where market expectations diverge from reality, and the longer it lasts the more it feels like a trend reversal is near. But as always, emotions must be set aside — we wait for clear signals, not illusions.

GBPUSD overhead supply keeps pressure, downside targets in focusGBPUSD once again tested the main supply zone around 1.3740, from where the market has repeatedly reversed lower. On the daily chart, the pair shows a series of lower highs, and the close below local support signals growing seller pressure.
The first downside target is near 1.3350, where initial profit-taking may occur. The next area is 1.3175, a stronger support level established earlier in the year. If bearish momentum develops further, 1.2900 becomes the key downside target to watch.
From a fundamental perspective, the pound remains under pressure due to Bank of England policy uncertainty, weak UK economic data, and the relatively hawkish stance of the Federal Reserve supporting the dollar. As long as the market trades below 1.3740, the bias remains toward the downside.
