$BRENT technicals in convegence between Fibonacci and TrendlineBLACKBULL:BRENT has been on a downtrend since last Summer...
Now the descending trend line is about to hit the bottom of the Fibonacci Retracement Levels.
This forms a triangle that we know can break either upward or downward - place your entry points and Stop-Loss points accordingly.
While I don't provide Fundamentals analysis, the latest turns of events with USA and Venezuela make me lean towards a break on the downside for more supply of Crude Oil available to the US.
Supplyanddemmand

XAUUSD Bullish Structure | Amid Geopolitical Tension📈 GOLD (XAUUSD) – Bullish Continuation Setup
Price is holding above the ascending trendline, showing strong bullish structure. After rejecting intraday resistance, gold is making a healthy pullback into the buying zone.
🔹 Buying Area: 4,630 – 4,650
🔹 Key Support: 4,610 – 4,620 (trendline + structure support)
🔹 Invalidation: Below 4,600
🔹 Upside Target: 4,700+
As long as price stays above the rising trendline, buyers remain in control, and a continuation toward the target zone is expected after consolidation.
📌 Wait for confirmation in the buying area and manage risk properly.

XAUUSD Bullish Continuation Setup Gold is trading in a bullish structure after respecting the key demand zone, with price holding above support and showing strong buying interest. A minor pullback toward the 4520–4530 area is possible, but as long as this zone holds, bullish continuation is expected toward 4550 and 4600, where short-term resistance may appear. A break below 4500 would invalidate the setup. Overall bias remains bullish while price stays above support.

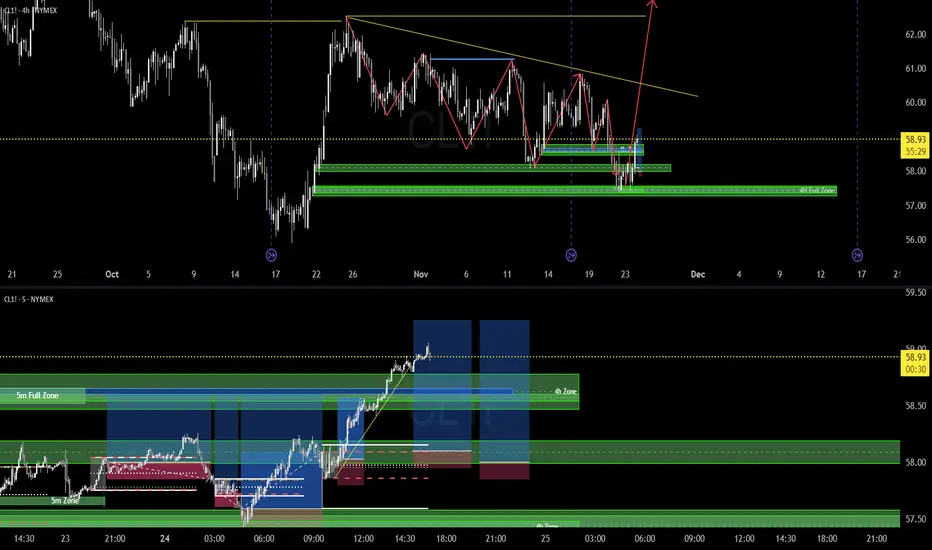
5m & 4H Supply and Demand Short - CLLooks like Price (CL!) is getting to a support area based on the 4H chart (zoom out).
So, I've mapped a daily gap, 4H zone, for a quick short.
There are double bottoms way down around 58.27, so keep an eye out as this 4H trend has got to get swiped.

4H Supply & Demand | Going Long, BabyHere we have a diamond reversal pattern on the 4H.
Now that it broke out, I'm looking for a liquidity zone to retrace to and then go long for just 60 ticks on the 5m chart. Follow for more value.
- Mr. Trader-CL

Confidence & Power | Supply & Demand Trading 4H/5m TimeframeOk, here it is for a 2nd chance.
Trendline is gonna get utterly swiped before we make a new high.
Based on 4H zones, I enter on the 5 minute chart.
- Mr. Trader-CL
ServiceNow (NOW) BUYServiceNow (NOW) uses AI to automate workflows across enterprises, from HR systems to IT support. It’s a software business that becomes more valuable the more companies lean on automation.

OILUSD – Demand Zone Reaction (4H Analysis)Price has been moving in a bearish trend, forming lower highs and lower lows. Recently, it tapped into a strong demand zone (blue box) and is now showing signs of a bullish reaction.
🔎 Key Points:
Price reacted strongly from the demand zone.
A trendline break is visible, suggesting bearish momentum is weakening.
Stop loss is placed below the demand zone (61.36).
Take profit is set at the next supply zone / resistance around 66.05.
💡 If buyers hold this level, we may see a strong push toward 66.05. But if demand fails, price could revisit lower levels.

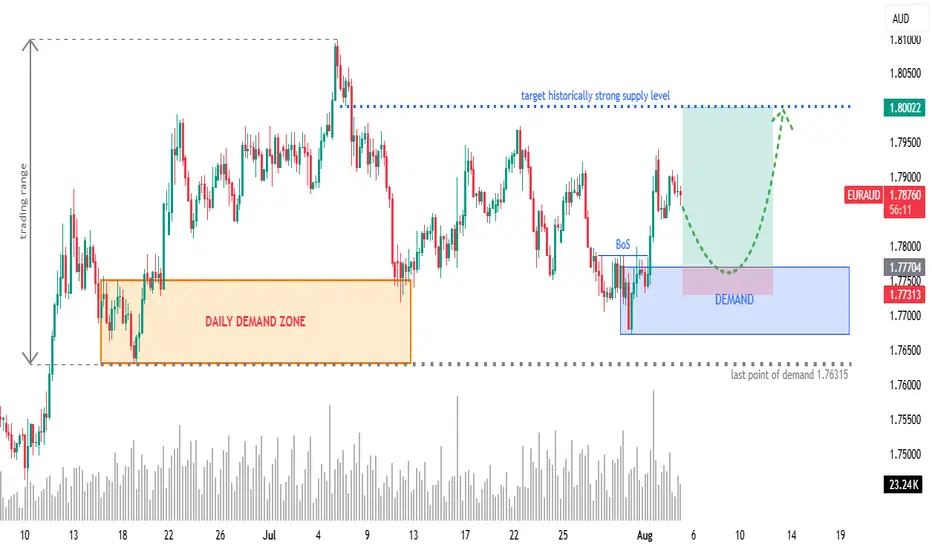
EURAUD 4H: Long Setup from Fresh Demand ZoneOverview:
OANDA:EURAUD retracing into a newly formed 4H demand zone after a bullish Break of Structure (BoS). Eyes on continuation towards a historically significant supply zone at 1.8000.
🧩 Setup Details
• Asset & Timeframe: EURAUD, 4H
• Bias: Bullish
• Entry Zone: 1.77300 – 1.77700 (DEMAND area)
• Targets:
🎯 T1 = 1.7900 (minor reaction level)
🎯 T2 = 1.8000 (historical supply level)
• Stop-Loss: Below 1.77300 (last valid demand)
• Risk-Reward: Approx. 1:6+
🧠 Why Now? (Trade Rationale)
• ✅ Fresh 4H Demand Zone: Price is retracing into a clear demand zone after rejecting lower prices.
• ✅ Break of Structure (BoS): Bullish BoS confirms shift in order flow.
• ✅ Volume Confirmation: Increasing demand near current price levels.
• ✅ Clear Liquidity Sweep: Price likely swept short-term lows before BoS.
• ✅ Target Supply Zone: 1.8000 is a well-respected historical supply/resistance level — clean magnet for price.
⏱ Multi-Timeframe Context
• Daily Chart: Price is reacting off a larger DAILY DEMAND ZONE. Trend bias is bullish.
• 4H Chart: Structure break + demand formation suggest continuation.
• 1H/Entry Level: Monitor price action in the blue zone for lower-timeframe confirmation (e.g. bullish engulfing, flip zones, LQ sweep, etc.) and potentially greater risk-reward.
📉 Risk Management & Duration
• Stop below 1.76315 keeps you protected from deeper invalidation.
• Trade Duration: Short to mid-term (1–4 days).
• Position Size: Scale based on volatility; ideal for swing trade conditions.
📌 Trade Plan Summary
📍 Watch for bullish PA on re-entry into demand (1.77300–1.77700)
📍 Set SL below 1.76315
📍 TP1 at 1.79000 — partials advised
📍 TP2 at 1.80000 — strong historical level
📍 Adjust SL to BE on momentum breakout
AUDNZD Breakout Retest – Ready for the Next Bullish Leg?
AUDNZD has broken out of a prolonged consolidation box, supported by a demand zone below. Price is currently retesting the breakout level, which often acts as a launchpad for the next move.
🧠 Key Observations:
🔷 Consolidation Breakout – Price cleanly broke above the consolidation range.
🔁 Retest in Progress – A potential bullish retest is unfolding at 1.0800 area.
🟦 Demand Zone below offers strong support around 1.0730–1.0750.
🎯 Target: 1.08750 (pre-identified resistance zone)
----------
📌 Trade Plan:
🎯 Take Profit (TP): 1.0875
🛑 Stop Loss (SL): Below 1.0750 demand zone
🧭 Bias: Bullish
📊 Strategy: Breakout–Retest–Rally

NASDAQ Bullish Play into Liquidity Before Potential ReversalForecast:
NOTE: At this moment, this is a forecast and trades will be taken dependent on live PA.
Price has reacted strongly off the 21,410–21,430 Daily Order Block, suggesting bullish intent. If bullish structure holds, I expect a move into the 22,060–22,130 liquidity zone, where sell-side setups could form.
This is a classic Buy to Sell model:
Buy from OB at ~21,420
Target liquidity above recent highs (~22,100+)
Look for shorts after sweep into 22,130–22,220 range
Invalidation: Break and close below 21,410 suggests the OB failed — potential deeper drop toward 20,700.

GOLD → Need to break Triangle Pattern !!!Gold Analysis
Following a rejection at the 3,120.00 level last Thursday — a key H4 demand zone — gold is currently forming a triangle pattern.
🟢 Bullish Scenario:
If the price breaks above the 3,250.00 level, it may present a buying opportunity with the nearest target at 3,320.00 .
🔴 Bearish Scenario:
If the price breaks below the lower trendline of the triangle pattern, the nearest selling target is seen around 3,055.00.
Best Regard

USDJPY Bullish Breakout Setup – Retest at Key Demand ZoneUSDJPY is respecting a clean bullish structure after rebounding from the 140.100 base. Price made a higher high near 148.650, followed by a pullback into the previous demand zone around 145.000.
Technical Breakdown:
Market Structure: Higher highs and higher lows indicate a strong uptrend.
Demand Zone: Clean reaction from the 145.000 zone, which previously acted as resistance-turned-support.
Target Zones:
First TP: 147.900 (previous swing high)
Final TP: 150.600 (key resistance level)
Invalidation Level : Close below 144.800 could invalidate this bullish scenario.
If price sustains above 145.000, the bullish trend is likely to continue.
As always, manage risk carefully.
Like & Follow for more clean, high-timeframe breakdowns!

10-4-25 YEN Pivot LevelObserve again the function of pivot levels.
Use in conjunction with good money management plan

USDJPY - at potential Buy SetupOANDA:USDJPY is nearing a significant support area that has reversed bearish trends into bullish momentum. This support level aligns with prior price reactions and represents a strong foundation for potential upward moves.
If buyers confirm their presence with bullish price action, such as long lower wicks or bullish engulfing candles, I expect the price to go toward 151,100. Also, a break below this support could signal further bearish continuation.
Just my take on support and resistance zones—not financial advice. Always confirm your setups and trade with solid risk management!

Bitcoin's Bullish Breakout: Targeting $126,500!
Introduction: Bitcoin (BTC) has recently experienced a significant price surge, reaching new heights. For those new to cryptocurrency trading, understanding this movement is crucial. In this post, we'll break down the current BTC price action and discuss potential trading strategies.
Current BTC Price: As of now, Bitcoin is trading at $101,254.00 USD.
Key Levels to Watch:
Support Level: $94,500 USD
Resistance Level: $105,000 USD
Market Sentiment: The market is currently bullish, with increased trading volume and positive news surrounding Bitcoin's adoption.
Potential Price Target: Based on the "Cup and Handle" pattern, a technical analysis chart pattern, the projected price target for Bitcoin is $126,500 USD.
Trading Strategy for Beginners:
1. Entry Point: Consider entering a long position if the price retraces to the $94,500 support level.
2. Stop-Loss: Set a stop-loss just below the $92,000 level to manage risk.
3. Take-Profit: Aim for a take-profit at the $126,500 target.
Important Note: Cryptocurrency markets are highly volatile. It's essential to conduct thorough research and only invest funds you can afford to lose.
Conclusion: Bitcoin's recent price action presents potential trading opportunities. By understanding key levels and technical indicators, beginners can navigate the market more effectively. Always remember to trade responsibly and stay informed.
Let's Discuss! What are your thoughts on Bitcoin's current price action? Do you agree with the projected target of $126,500? Share your insights and let's engage in a constructive discussion!
Disclaimer: This analysis is for informational purposes only and does not constitute financial advice. Always conduct your own research before making any investment decisions.
By inviting readers to share their thoughts and engage in a discussion, you can foster a more interactive environment and encourage traders to participate in the comments section.

REVERSAL ENTRY MODEL TARGETING ASIAN HIGHSREVERSAL ENTRY MODEL TARGETING ASIAN HIGHS!
GBP/USD 15-minute chart: Just set a buy limit order!

10 Brutal Truths About Why Retail Support & Resistance Fail !CAPITALCOM:GOLD
10 Reasons Why Retail Support and Resistance Levels Fail: Unlocking Gann’s Secrets to Market Mastery
Here’s a deeply researched, professional explanation for each point, infused with Gann’s quotes, examples, and concepts, to open the eyes of traders to why retail methods often fail and how Gann's wisdom provides clarity.
1. Static Levels in a Dynamic Market -
Explanation: Retail traders often draw support and resistance (S/R) lines as static horizontal levels, expecting the market to repeatedly respect them. However, Gann emphasized the dynamic nature of markets, stating:
"Markets are never still; they are always moving, reflecting time and price interplay."
Markets are influenced by cycles, trends, and time frames, making S/R levels fluid rather than fixed. For instance, Gann’s Square of Nine shows how support and resistance rotate based on angles and time increments, offering precise levels that adapt dynamically. Retail traders fail to adjust their levels as time progresses, missing key changes in price behavior.
2. Failure to Incorporate Time -
Explanation: Retail S/R methods typically ignore the role of time, which is a critical element in Gann's work. Gann wrote:
"Time is the most important factor in determining market movements."
Support may fail not because the level was invalid but because the "time factor" for that level has expired. For example, in Gann’s Time Cycles, support at a certain price might hold only for a specific duration. When that time passes, the level loses its relevance. Retail traders, unaware of such timing principles, are often blindsided when the market breaks their "strong" levels.
3. Lack of Confluence with Angles -
Explanation: Gann’s methodologies prioritize the confluence of price and angle relationships. He believed that price moves in harmony with geometric angles, stating:
"When price meets time at an angle, a change is imminent."
Retail traders fail to consider these angular relationships, focusing only on flat horizontal lines. For example, a 45° angle from a significant low often acts as a true support, but retail traders, relying solely on previous price zones, miss these powerful turning points.
4. Overcrowding and Psychological Herding -
Explanation: S/R levels widely used by retail traders often attract a large number of orders at the same price zone, making them predictable and vulnerable to institutional manipulation. Gann noted:
"The crowd is often wrong, and the minority drives the market."
Institutions exploit this herding by triggering stop-losses just below support or above resistance, creating false breakouts. For instance, Gann’s "Law of Vibration" explains how markets seek equilibrium by disrupting imbalances created by crowd psychology.
5. Ignoring Volume Analysis
Explanation: Retail traders rarely integrate volume into their S/R analysis. Gann emphasized the importance of volume, stating:
"Price movements must be confirmed by volume to validate strength."
Support may appear to hold, but without accompanying volume, the level lacks significance. A practical Gann-based example would involve observing increased volume near a critical angle or price zone, signaling genuine strength or weakness at that level.
6. Using Recent Highs/Lows Without Context -
Explanation: Many retail traders base S/R levels on recent highs and lows, assuming these are universally strong zones. Gann criticized such oversimplified approaches, writing:
"The past governs the future, but only through proper analysis of cycles and patterns."
Without analyzing historical patterns and cycles, these levels are often superficial. For example, Gann's Master Charts reveal that true resistance may lie at a harmonic distance from an earlier historical pivot, not necessarily at the recent high.
7. Misunderstanding False Breakouts -
Explanation: Retail traders often misinterpret false breakouts as failures of support or resistance. Gann explained this phenomenon through his price and time squares, stating:
"A breakout without harmony is often a trap, designed to mislead the majority."
For instance, a false breakout above resistance might align with a Gann angle signaling a reversal, confusing those relying solely on retail S/R levels.
8. Ignoring Market Structure and Trend -
Explanation: Retail traders often focus on S/R levels without understanding the broader market structure or trend. Gann believed:
"The trend is your friend until time signals the end."
Support is more likely to hold in an uptrend, while resistance is stronger in a downtrend. A classic Gann principle involves combining market structure with angular analysis to determine whether S/R levels will hold or break.
9. Failure to Account for Gann's Price Harmonies -
Explanation: Gann’s studies reveal that price moves in harmonic relationships, often tied to Fibonacci ratios and geometric principles. Retail traders using arbitrary S/R levels fail to respect these harmonies. For example, Gann's observation of price doubling or halving (e.g., $50 to $100) often defines true support or resistance.
10. Reliance on One-Timeframe Analysis -
Explanation:
Retail traders frequently analyze S/R on a single timeframe, missing the interplay between multiple timeframes. Gann emphasized multi-timeframe alignment, writing:
"The major trend governs the minor trend, and the minor trend refines the major."
Support on an hourly chart may fail if it conflicts with resistance on a daily chart. Gann’s multi-timeframe methods ensure alignment, reducing the likelihood of failure.
Updated Closing Thought-
By understanding the reasons why retail support and resistance often fail and incorporating Gann’s time-tested principles, traders can elevate their skills to a professional level. Gann's focus on time, price, and geometry provides a roadmap to understanding the market with unparalleled precision.
This content is invaluable for anyone seeking trading mastery, so don't keep it to yourself! Save this and share it with your friends so they can benefit too. Follow for more absolutely valuable and free trading insights!

Boing shows longs on WkHey guys! Hope you doing great.
If you see boing wk chart price just formed PCP level which can extend the price in upcoming weeks.
We can trade the same area to go longs. Wait for the price to get in from these tiny basing candles.
Good luck 👍

A case for long term investment and DCANYSE:VALE Is at an inflection point. It is a stock I have been watching for a long time as it has a nice Elliott wave pattern (If correct)
Here I present the Weekly chart as I consider it for my long term portfolio (3+ years BUY and Hold)
Although the chart presented here looks great (Read: Phenomenal), as an analyst utilising multiple methods, the story does not unfold as easily as I'd like.
As can be seen in the snapshot below there are multiple 'anomalies' still outstanding at those green zones on the magnified weekly chart. They may or may not be filled, but our awareness of them should cause us to move forward with caution.
On the Elliottwave side of things, there are two ways of looking at this. Either the recent top at ~$23 was wave i of 3 of (3) or the top of Primary w(1). If the latter is true then we will likely drop lower in to one of the green bands.
So the question remains - how do we take advantage of this given a drop to just above $3?
1) You can Dollar Cost Average in at each stage distributing your allocated capital
2) Wait for a bounce in a five wave move and enter at the correction for w2 of that bounce. Use the low for a stop loss.
There is no perfect way to manage the unknowns, you can only manage your primary objective, which should be to safeguard your capital -
If you want to know my thoughts on NYSE:VALE and other names give this a boost and follow.
best of luck!

EURCAD shortShorts on EURCAD could be a nice play depending on how we approach our supply zone. I have 3 zones currently marked out but the first one was a previous structure point and had a little bit of accumulation so I have a higher confidence in that one holding. Will be waiting for lower timeframe entry after price arrives at the zone.

EURAUD SHORTThis week gave a big drop on EUR/AUD and turned the Daily and 4h timeframes bearish as well as giving a clean head and shoulders pattern on the daily timeframe. I will be looking for a pull back into the 4h supply zone which also aligns with the daily H&S neckline so I think it will have a high probability of bouncing from there.

GBPUSD ShortLooking to potentially short GBPUSD from the supply zone above. Gonna be waiting for a lower timeframe CHOCH when price taps in and will look to ride it out to the equal structure lows
