BTC/USD 4h Chart🔹 Trend and Price Action
• There was a downward trend on the chart (orange trend line).
• The price creates above the inheritance trend line, which is the first signal of the potential change of direction.
• Currently, the course oscillates around USD 111.9.
⸻
🔹 levels of support and resistance
You have key zones marked:
• resistance:
• $ 112 236 (local resistance - the price is currently struggling with it),
• $ 113 171,
• 114 481 $.
• Support:
• 110 677 $,
• $ 109 430,
• $ 107 309 (stronger support).
👉 If the price lasts above $ 112 $ 236 - we can see the test 113-114K.
👉 If it does not pierce, possible retest 110.6k or lower.
⸻
🔹 indicators
• MacD - I see that the blue line cut the orange from below → Bycza signal (confirms the attempt to change the trend).
• Stochastic RSI - is high (exit from the hole), but already close to the purchase zone → possible light withdrawal or consolidation before it moves further.
⸻
🔹 Scenarios
1. Bull (more likely now):
• Maintenance above 111.9k - 112.2k → Movement up to 113.1k and 114.4k.
• Breaking 114.4k opens the way to 116K+.
2. Bear (if he doesn't beat 112.2k):
• Rejection → descent to 110.6k.
• Breaking 110.6k → test 109.4k.
Support

NEAR Setup – Support Zone Long OpportunityAfter a strong 23.5% rally, NEAR has pulled back into a high-confluence area, aligning range support with the 61.80% Fibonacci retracement, creating a favorable long entry zone.
Trade Setup:
• Entry Zone: $2.35 – $2.50
• Take Profit Targets:
🥇 $2.80 – $3.05
🥈 $3.60 – $4.00
• Stop Loss: $2.28

CRO/USDT 1W Chart📊 Current situation
• Price: ~ 0.2067 USDT (+33% per week).
• Trend: strong Breakout after a long consolidation.
• SMA:
• Short -term (red, ~ 0.1236 and 0.1592) was pierced → confirms the change of trend.
• Green (SMA #2) also below the price → bull signal.
• MacD: heavily growing histogram, MacD line above the signal → growth moment.
• RSI: ~ 70 → enters the purchase zone, but not yet extreme (no divergence).
⸻
📈 levels of support and resistance
• Support:
• 0.1592 (last Breakout Level).
• 0.1236 (strong zone of previous consolidation).
• resistance:
• 0.2347 (nearest resistance).
• 0.3374 (key resistance from higher intervals).
⸻
🧐 Interpretation
• We have a confirmed upward trend - the price has pierced the relegation line (yellow trend line) and the SMA broke.
• Momentum is growing (MacD, RSI, volume).
• However, RSI signals the possibility of short -term correction if the price hit 0.2347.
⸻
🔮 Scenarios
1. Bycza (more likely)
• If we keep it above 0.1592, possible attacks on:
• 0.2347 → Then even 0.3374.
• A good chance of continuing the trend within the average time.
2. Bear (correction)
• a decrease below 0.1592 → correction to 0.1236.
• Only a breakdown 0.1236 will negate the current upward trend.

BONK Approaching Key Support – Potential Long Swing Setup
BONK is pulling back and approaching a major support zone, where buyers previously stepped in. With price action slowing down, this could present a low-risk, high-reward swing trade opportunity.
Trade Setup:
🔹 Entry Zone: $0.0000183 – $0.000016
🔹 Take Profit Targets:
🥇 $0.0000226
🥈 $0.000026
🔹 Stop Loss: Close below $0.0000155
#BONK #CryptoTrading #SwingTrade #Altcoins #TechnicalAnalysis

AMD Pullback Opportunity After 70%+ Rally – Watching $111–$120 📈 AMD Update – Strategic Re-Entry Plan
From our original buys at $108, AMD has delivered an impressive 70%+ rally. This strong momentum reflects continued bullish sentiment and growth potential in the semiconductor sector.
We’re now looking to add on a pullback into a confluence support zone between $111 and $120. This level aligns with the:
61.8% Fibonacci retracement
99-day TRAMA
Horizontal support at $120
📍 Entry Zone: $111–$120
🎯 Take Profit Targets: $160 / $220 / $300
❌ Stop Loss: Weekly close below $100
#AMD #NASDAQ #SwingTrade #Fibonacci #TechnicalAnalysis #StockMarket #TradingIdeas

Gold XAUUSD Long-term BullishThe monthly chart on XAUUSD shows a great BULLISH setup.
A horizontal support level around the $1955 has been broke and confirmed.
Also, a descending trendline support has been broke and confirmed.
Price is currently retracing down and re-testing near prior support which is expected to hold. This is an excellent trading opportunity with low risk and high reward.
Entry = 1955 to 1960
TP = 2060
SL = 1945
Note: This is a long-term chart and therefore very reliable.

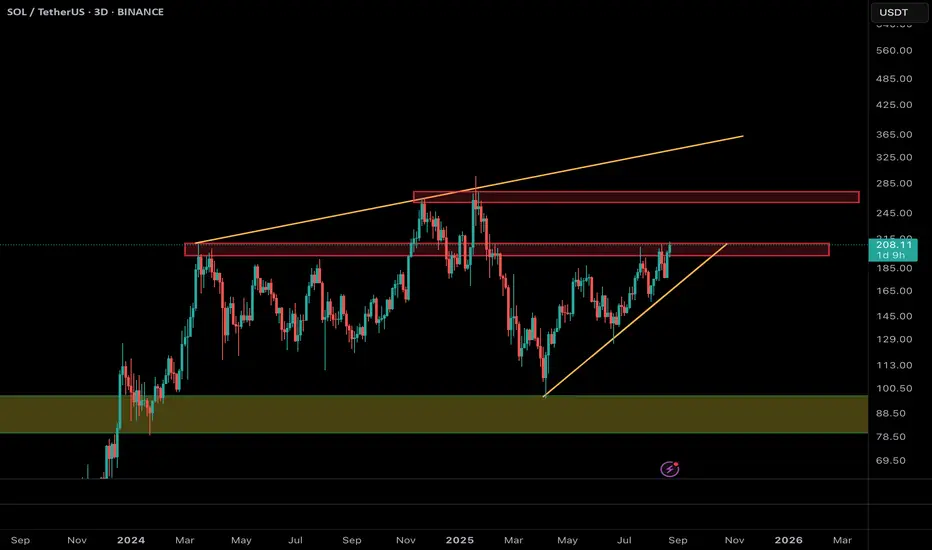
SOLUSDT 1W Chart1. Main trend
• You can see a strong upward trend from holes around 120 USDT.
• The course currently moves along the growing trend line (orange).
• The last candles show that the buyers are defending support and each hole is higher → a sign of market strength.
⸻
2. Support and resistance (key levels from the chart)
• Support:
• 186.56 USDT - the first strong support (coincides with the trend line).
• 166.42 USDT - another stronger support.
• 139.00 USDT - main strategic support.
• resistance:
• 219.02 USDT - the closest resistance (currently tested).
• 253.15 USDT - strong resistance if 219 is broken.
• 296.24 USDT - another target in the event of a bull market.
⸻
3. Indicators
• MacD - upward signal, lines are above the zero line, green histogram → momentum is growing.
• STOCHASTIC RSI - high, close to the purchase zone → a short correction may occur.
• RSI (classic) - ~ 60 points, i.e. not yet purchased, but the space for increases is reduced.
⸻
4. Scenarios
• Bycza (more likely at the moment):
If the SOL stays above 186 USDT and pierces USDT USDT, subsequent goals are 253 → 296 USDT.
• Bear (alternative):
If the price drops below 186 USDT and breaks the trend line, possible return to 166 and even 139 USDT.
⸻
🔑 Summary
• The trend is upward and still strong.
• Key breakdown is 219 USDT.
• Trend holding (above 186 USDT) = potential for further increases.
• Breaking the trend line = correction warning.

WTI Crude Oil · M15 · 24-Aug — “Buy the Dip into EMA/Donchian”🟢 Bias: Intraday long after spike, buy the dip into Donchian + EMA support.
Entry: $62.90 – $63.20
Stop-Loss: $61.95
Targets: TP1 $63.80 · TP2 $64.70 · TP3 $66.00
RRR (from $63.10): Risk $1.15 → TP3 +$2.90 = ~1:2.5 ✅
Why this works:
Confluence: Donchian support ($62.91) + 200 EMA M15 ≈ $62.38 (white).
Structure: Higher highs/lows since Aug-20; volume expands on pushes, compresses on pullbacks.
HTF context: H4 pressing toward 200 EMA ≈ $64.7–$65.0 (key pivot).
Execution: Look for a bullish rejection/engulfing inside the box + 8/21 EMA hold (orange/blue) above the 200 EMA (white).
Risk: ≤ 1%. Move SL→BE after TP1.
Trade Confidence: ⭐⭐⭐⭐ (High if retest holds and 8/21 maintain bullish structure)
🔒 Want more? The Prime version below adds: alternate short plan at $64.7–$65.0, management ladder, HL tight-stop variant (~4R), and a full execution checklist. Follow on Skool, link in profile!
⚠️ Trading involves risk. Manage exposure and trade responsibly.
💬 Thoughts on this setup?

Solana at Make-or-Break: Can $213 Unlock the Rally to $270?Solana (SOL/USDT) has been recovering strongly since bouncing from the $110 area and is now testing the critical resistance zone around $205–213. This level has acted as a major barrier multiple times in the past, making it a true “make-or-break” point.
📌 Bullish Scenario (more likely if $213 holds):
• A confirmed breakout and daily/3D close above $213 could trigger a rally toward the next major resistance at $270.
• A successful move beyond $270 may even open the path toward the long-term resistance trendline near $320–340.
📌 Bearish / Alternative Scenario:
• If Solana fails to hold above $213, a pullback toward $180–175 is possible.
• Stronger support lies around $100, which remains the key level to defend for bulls.
⚡ Conclusion:
As long as SOL stays above $200, the structure remains bullish. A breakout above $213 would confirm momentum and unlock a potential move toward $270, while rejection could mean another corrective dip before the next attempt.
AVAX/USDT – Major Breakout on the Daily Timeframe!AVAX has finally broken out from its long-term descending trendline, signaling the potential start of a powerful bullish move. Let’s break down the setup:
🔎 Chart Analysis:
Pattern: Falling Wedge on the Daily timeframe.
Breakout Zone: Price has successfully closed above the resistance trendline around $25–26.
Support Zone: Strong accumulation support around $24–26
🎯 Trade Setup:
Entry Zone: $24–26 (current breakout retest levels)
Targets:
TP1: $35
TP2: $48
TP3: $60+
Stop Loss: $21 (below wedge & accumulation box)
📊 Risk/Reward:
R/R ratio: ~5:1
High conviction setup with breakout confirmation.
⚡ Key Takeaway:
If AVAX holds above the breakout zone, it could deliver a 2x–3x run in this cycle. Watch closely for volume confirmation on daily candles to strengthen the breakout signal.
🔥 Conclusion: AVAX looks primed for a strong bullish rally after months of consolidation. Accumulation zones are done — breakout traders could be rewarded big here!

AVAX/USDT 1D ChartCurrently 25.86 USDT (+2.42%).
• The price has reflected from support around 22.6 USDT and broke over SMA (average walking).
• You can see an attempt to continue the upward trend - local "mini bull run".
⸻
2. Support and resistance
• Support:
• 24.39 USDT (SMA #1, short -term support).
• 22.60 USDT (strong support - earlier level of consolidation).
• 20.20 USDT (key hole below which the downward trend returns).
• resistance:
• 26.26 USDT (local resistance, currently tested).
• 27.72 USDT (another strong level of resistance).
• 30.95 USDT (key resistance - return to a strong supply zone).
⸻
3. Medium walking (SMA)
• The price was pierced by SMA #1 (red) and SMA #2 (green).
• SMA #5 (blue) is located lower (~ 22.5), which shows that the short -term trend is now stronger than the long -term → bull signal.
⸻
4. MacD
• The histogram begins to grow above line 0.
• The MacD line cut the signal line from the bottom → buy signal.
• The growth moment is developing.
⸻
5. RSI
• RSI ~ 58 → neutral, but close to the "bull" zone.
• Not yet bought out (> 70), so there is space for further increases.

AUDCAD At Make-or-Break Zone – Time to Ride the Bulls?AUDCAD has been overall bullish trading within this rising channel 📈
Right now, price is retesting the lower bound acting as support 🔑
As long as this zone holds, I’ll be looking for longs targeting the upper bound 🎯
Patience is key here ⏳ — let the bulls step in, then ride the next impulse 🚀
📚 Always follow your trading plan regarding entry, risk management, and trade management.
Good luck!
All Strategies Are Good; If Managed Properly!
~Rich
Disclosure: I am part of Trade Nation's Influencer program and receive a monthly fee for using their TradingView charts in my analysis.

GOLD - false breakdown of support before bullish runGold on the chart is forming a bullish pattern: consolidation in the form of a bearish wedge forming on an uptrend. There is a high probability of a breakout from the support level of 3320-3310. The market has a lot of upside potential, as the price has been consolidating for a long time.
Below is a fairly strong support zone that is capable of holding the price.
However, there is one caveat: in a few hours, Powell's speech and unpredictable data could destroy the structure, in which case gold could fall to 3300-3328.

BNB/USDT 12h chart🔎 Current situation
• Price: 898.50 USDT (+7.03%) - outstanding candle.
• Trend: We see a strong growth impulse, confirmed by the reflection from the trend line (yellow).
• Support:
• 869.75 USDT (next short -term support).
• 838.37 USDT.
• 818.56 USDT (SMA #2).
• resistance:
• 921.99 USDT.
• 952.26 USDT (key level - potential target, can be tested).
⸻
📊 Indicators
• SMA (movable average):
• The price struck over SMA and lasts above-a pro-rectification signal.
• MacD:
• The MacD line pierces the signal line from the bottom → fresh buy signal.
• The histogram begins to grow green.
• RSI (Relative Strength Index):
• Currently ~ 60 → a lot of space for the purchase zone (70+).
• RSI directed up, confirms the momentum of bulls.
⸻
📈 Scenarios
1. Bycza (more likely short -term)
• If the price lasts above 869–870 USDT → attack on 922 USDT.
• Breaking 922 with a strong volume → Another target 950–960 USDT.
2. Bear (less likely now but possible)
• Rejection from 922 and descent below 870 USDT → withdrawal to 838 or even 818 USDT.
• Only the loss of 818 will negate the current upward trend.
⸻
📝 Summary
BNB currently looks very strong - a fresh growth impulse, breaking over medium, MacD gives a buy signal, RSI is not yet in the purchase zone.
➡️ If something negative on BTC or the wide market does not happen, then the 922 and 952 test is real in the short term.

BITCOIN/USD SUPPORT & RESISTANCE LEVELS (READ CAPTION)hi trader's what do you think about BITOIN/USD
current price: 112300
Bitcoin is currently trading between key support at 112000 and resistance at 114200.
If price holds above support, bullish momentum may test higher levels.
If price breaks support, further downside could occur
support zone: 112000
resistance zone: 114200
target 115300
stop loss 111000
please like comment and follow thank you

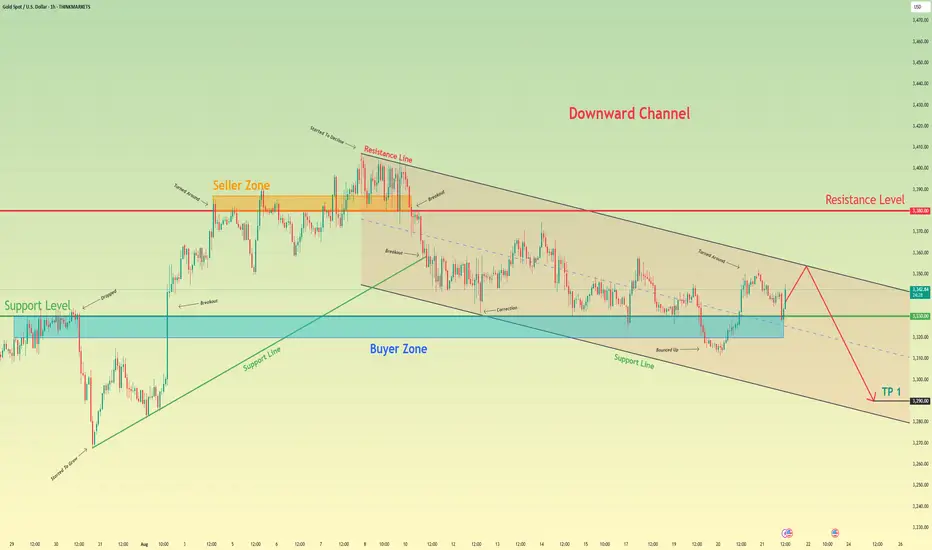
Gold can continue to decline inside downward channelHello traders, I want share with you my opinion about Gold. The price action for Gold has been dictated by a large downward channel since the last major peak was established at the 3380 resistance level. This bearish structure has effectively contained the market, guiding it through a series of impulsive declines and corrective rebounds between its well-defined support and resistance lines. After the most recent upward rebound originated from the lower boundary of the channel, the price has been in a corrective rally, now approaching a formidable confluence of resistance. This critical area is formed by the intersection of the channel's descending resistance line and the major horizontal seller zone around 3380. The primary working hypothesis is a short scenario, which is based on the expectation that this powerful resistance will hold and cause the current corrective rally to fail. A confirmed rejection from this zone would validate the integrity of the downward channel and signal that the dominant bearish trend is set to resume. This would likely trigger the next major impulsive fall, which is expected to break through the immediate support level at 3330. Therefore, the TP for this continuation scenario is logically placed at the 3290 level, a target that represents a new lower low within the channel's structure and a prudent objective for the anticipated move. Please share this idea with your friends and click Boost 🚀
Disclaimer: As part of ThinkMarkets’ Influencer Program, I am sponsored to share and publish their charts in my analysis.
BTC/USD 1H Short-term1. Main trend (short -term)
• The price is under the downward trend line (black line).
• Until this trend is broken up (approx.> 113,000–113,500 USD), the advantage remains on the Bear (inheritance) side.
2. Support and resistance
• The next support: 112.017 USD (if it falls → the next target is USD 111,232 and then 110.015 USD).
• The nearest resistance: USD 112,959, then USD 113,528 and a stronger level of USD 114.667.
3. Candle formation
• The last candle tests support at USD 112.017 and a defense attempt (lower wick) appears. This may suggest a short reflection, but still as part of the inheritance trend.
4. Oscillators (Stochastic RSI at the bottom of the chart)
• The indicator is in the sales zone (<20) and begins to turn up → a signal of a potential short -term reflection (SCALP LONG).
• However, if the reflection does not overcome the downward trend line, it will be just a correction rather than a change in the trend.
⸻
📊 short -term scenarios
• Bullish (reflection): If BTC maintains USD 112,000 and stochastic, he pulls up, possible traffic up to $ 112,950-13,500 (Trendline test and resistance).
• Bearish (continuation of declines): a breakdown of USD 112,000 opens the road to USD 111,200 and even USD 110,000.
⸻
📝 Application
• Trend for 1H: inheritance.
• Short -term signal: possible reflection from support (112K → 113.5k), but until the price boosts the downward trend line, the scenario of further declines dominates.
• Key level for observation: USD 112,000 (maintenance = reflection, breaking = further declines).

20/08/25 Gold Swing LevelsSet your alerts. Watch the 5 mins (1 min if price spiking)
20/08/25 levels are marked
Always, price action determines trade.
Trade parameters
Entry on 5 min chart
Sl: 20-40pips
TP: 2-4x SL

Gold Rejecting Resistance After Liquidity Grab – Bow & Arrow SetThis is a textbook liquidity grab + rejection setup.
Price executed a liquidity grab above structure, shooting into previous highs to build momentum for the drop — classic bow and arrow effect.
After sweeping stops and pulling back, price retested the nearest resistance (around 3,324–3,325), but hasn’t broken the body high — this confirms sellers are still active.
The push down was strong enough to reach the 4H support zone, and although price bounced, it looks like a temporary pullback rather than a reversal.
As long as price stays below 3,347, this short bias holds. The structure still supports downside continuation unless a clear breakout occurs.
Bias:
Bearish — expecting continuation down toward 3,312 and possibly back to test 3,307.

Gold Respecting Key Support — Downtrend Still Active on the 4HPrice on XAUUSD is currently hovering around the 3,324 zone, reacting to a clear support area that’s held firm since the last major dip.
The uptrend is no longer valid — it's been broken multiple times and has now been decisively rejected.
We’re still trading below a short-term descending trendline, which remains active.
A prior liquidity sweep below support (around 3,247.54) may have been a fakeout to trap late sellers.
If price fails to break the short-term trendline, this bounce could be short-lived.
However, a clean breakout above the trendline could open up retracements toward the 3,360–3,384 area.
Stay alert for a retest of support at 3,310–3,324, and watch how price behaves near the trendline before considering entries.
Bias:
Neutral to Slightly Bearish — Until trendline break is confirmed, downside continuation is still on the table.

BTC/USD 1D LongTerm1. Price and main trend
• Current price: 113,448 USD (decrease -2.42%).
• On the daily chart you can see that Bitcoin pierced the yellow upward trend line and descended below the average walking (SMA). This is a signal of weakening the trend.
2. Support and resistance
• resistance:
• 117,687 (SMA - local resistance).
• 120,645 and 122.766 (stronger resistance zones).
• Support:
• 113.016 (first, local support).
• 110.541 (important support).
• 106,238 (key support - if it falls, more correction possible).
3. Medium walking (SMA/EMA)
• The price has gone below short -term medium (red and green lines).
• This suggests that the advantage has temporarily switched to the side of sellers.
4. MacD
• MacD histogram goes into a negative zone.
• The MacD line drops below the signal → This is a sales signal.
5. RSI
• RSI oscillates below 50 and slightly reduces.
• This means weakening the momentum of bulls and a potentially place for further decline (only around the RSI 30 would mean a strong sale).
6. Summary of the situation
• Technically the market looks weak - a breach of an upward trend, exit below medium and negative MacD.
• The next key support is: 113K → 110.5k → 106.2k.
• If 113K persists, it is possible to bounce up to 117k -120k, but only a return above 120K would change the sentiment to a more bullish.

Globant, Bright Future or Total Darkness?📊 Technical Analysis – Globant (GLOB) – Weekly
The price of Globant (NYSE: GLOB) remains under strong bearish pressure, approaching a key long-term support area.
🔑 Fibonacci Levels
0.618 (61.55 USD): critical zone currently being tested. A clear breakdown could open the door to further declines.
0.5 (77.15 USD): first major resistance in case of a rebound.
0.382 (92.75 USD): secondary resistance, aligned with previous supply zones.
0.236 (112.04 USD): stronger resistance level; a breakout above would suggest a trend reversal.
📉 Support and Resistance
Main Support: 65–61 USD, which acted as a strong base during 2019–2020.
Immediate Resistance: 77 USD, followed by 93 USD.
🔄 Volume
Volume has increased significantly over the past weeks, indicating strong institutional activity around this support area. This could hint at a potential technical rebound if the level holds.
📌 Conclusion
As long as GLOB holds above 61 USD, there is room for a rebound toward 77–93 USD.
A breakdown below 61 USD would open a more bearish scenario with medium-term targets around 50–45 USD.
Current bias remains bearish, but we are at a key decision zone.

CMG - Bullish Engulfing off 200 SMA & Support Zone?(Weekly chart) NYSE: CMG price action went through a series of flush downs into multiple support levels, where market makers likely cleared out stop-losses. At that zone, price formed a bullish engulfing pattern, signaling a potential attempt to rebound and regain momentum.
Price action highlights:
1) Flush down into the previous high level (resistance turned support).
2) Confluence with the 200 SMA on the weekly chart – a strong long-term support line.
3) Extension through the lower Bollinger Band, signaling short-term oversold.
4) Stochastic oversold, hinting at potential reversal.
5) Last week formed a strong bullish engulfing candle at supports.
This setup offers a favorable risk-reward profile — limited downside with strong upside potential.
