BRCUUSD BULLISH OR TRAP (READ CAPTION)Hi trader's what do you think about BTCUSD
BTCUSD is currently developing a bullish setup, as the market is holding above key support levels and showing signs of buyer strength. Price is respecting the lower zones, indicating a possible continuation toward higher levels.
🔹 Support: 89,600
This is the primary support level where buyers have reacted previously.
As long as BTC stays above 89,600, bullish sentiment remains intact.
🔹 Strong Support: 89,000
This zone represents strong structural support.
If the market dips into 89,000, it is considered a high-probability demand area for buyers to re-enter.
🔹 Resistance: 92,200
This is the first bullish target, where short-term profit-taking may occur.
A breakout above 92,200 will strengthen bullish momentum.
🔹 Supply Zone: 94,000
This is the major supply zone where sellers may become active.
If BTC breaks above 94,000, the market could shift into a stronger bullish trend.
📈 Market Outlook
Holding above 89,600 / 89,000 → Bullish continuation expected
Break above 92,200 → Opens the way toward 94,000 supply zone
Supply at 94,000 will decide the next major directional move
please like comment and follow thank you
Support

ETH ANALYSIS – 1h📊 ETH ANALYSIS – 1h
🔥 1. Key Fact on the Chart
We have a very strong upward impulse that:
Breaked the upper band of the descending channel (blue)
Touched the upper line of the ascending channel (orange)
Was immediately rejected (long wick)
The MACD shows extreme overbought + potential divergence in the making
Such a move usually indicates a short squeeze + profit-taking → i.e., a temporary weakening and a retest of the breakout.
🎯 2. Price areas I see on your chart
Green (resistance/TP for longs):
3479–3490 – structural highs, strong resistance
3420 – local resistance
3375 – first real resistance after the breakout
Red (support/defense levels of the structure):
3338–3348 – first test zone after the breakout
3293 – key level — sustain = trend continuation
3180–3200 – consolidation zone broken (likely retest)
📉 3. What does the current wick mean?
This giant wick signals:
short liquidations
lack of demand for a continuation after the first resistance breakout
high probability of a return to the range
possibility of a retest of the breakout (around 3185–3210)
This doesn't look like a classic breakout with a continuation, but rather a fakeout and the need for a correction.
📈 4. Scenarios
➡️ Bullish (more likely if 3293 holds)
Price falls to the 3338–3293 zone
Builds a local HH/HL
Starts a move to 3375, then 3420
If 3420 breaks → target 3480–3500
➡️ Bearish (if price loses 3293)
Retest from the bottom of 3293
Return to the blue channel
Target: 3185–3200
If this level breaks → 3050–3080 (lower band of the channel)
📟 5. MACD
MACD is:
extremely stretched
signal line begins to collapse
histogram decreases after Explosion
→ This almost always means a local intraday high + a drop to support.

XAUUSD(GOLD) BEARISH OR TRAP (READ CAPTION)Hi traders what do you think about gold
Gold (XAUUSD) is currently forming a bearish trade setup, showing weakness below the major resistance zone 4217–4230. This area has rejected price multiple times, indicating strong seller presence.
🔹 Resistance Zone: 4217–4230
This is the main bearish rejection zone.
As long as price stays below 4230, the market remains in a bearish bias.
Any retest of this zone can act as a selling opportunity for continuation moves.
🔹 Support Level: 4180
This is the first support level where short-term buyers may attempt to react.
A clean break below 4180 will confirm further downside continuation.
🔹 Demand Zone: 4150
This is the strong demand area where buyers are expected to become active.
If price drops into 4150, the market may show a bullish bounce, but overall sentiment remains bearish until major resistance breaks.
📉 Market Outlook
Below 4217–4230 → Market remains bearish
Break below 4180 → Opens the path toward 4150 demand zone
First target for sellers → 4180
Second target → 4150 demand zone
This structure shows a clean bearish retracement + resistance rejection setup, ideal for downside continuation trades.

ETHUSD 1D chart1️⃣ Trend and key levels
Trend
• The overall neutral-growth trend, but with clear consolidation.
• The price rebounded dynamically from the bottom (approx. USD 2,850), which creates the first higher low structure → the potential beginning of an upward impulse.
Support
• $2,973-$3,000 – SMA #1 + local support.
• USD 2,851 – strong support from which the candle made a very large wick upwards.
Resistances
• USD 3,169 – the first strong resistance, several candles bounced from this level.
• $3,236 – key daily resistance. Breakout = signal of strong momentum and opening the way to USD 3,300-3,430.
⸻
2️⃣ Candle formation and behavior
• A bullish candle with a long lower wick appeared → this is a signal of buyers.
• The price is making a series of higher lows, but no higher high yet → the market is waiting for a breakout of USD 3,236 to confirm the uptrend.
⸻
3️⃣ SMA (moving averages)
🔴 SMA #1 (short-term)
• Price is just above it → acts as support.
• If the daily candle closes below $3,000, the downside momentum returns.
🟢 SMA #2 (long term, ~$3,430)
• Is high above the price → long-term bearish pressure until the price returns to the price area.
⸻
4️⃣ RSI (momentum)
RSI around 45–50
• Neutral territory.
• Zero overbought/oversold.
• Slight upward trend in RSI → buyer momentum is growing, but without an overheating signal.
Conclusion: The market has room to move higher before the RSI becomes high.
⸻
5️⃣ MACD
• MACD is above the signal line → slight, early bullish signal.
• The histogram increases, but there is no significant acceleration.
Interpretation: increases are possible, but without strong momentum yet.

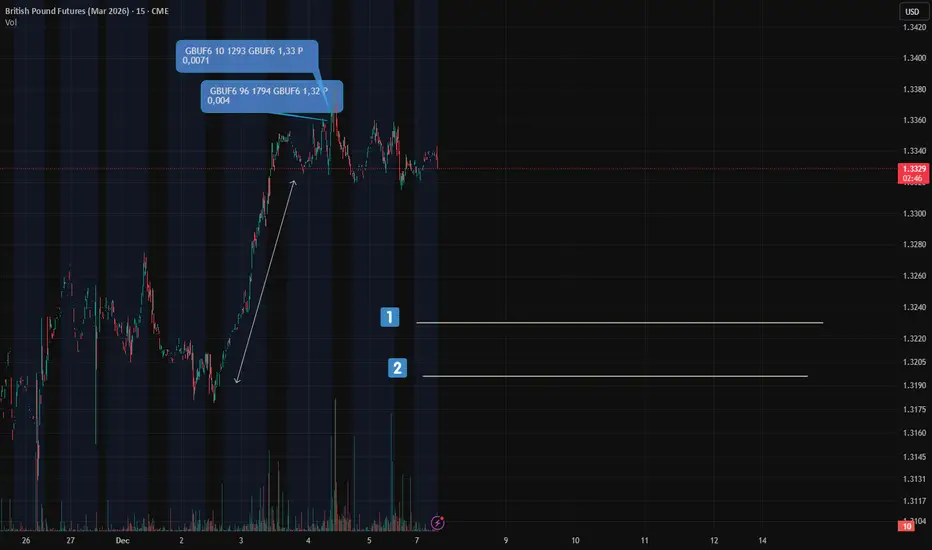
GBP: Next Upside Move PositioningTraders in the British Pound (6BH2026 -March futures) are acting quite predictably.
After last week’s rally (by the way — GBP rose to the outer 95% ER boundary, which rarely happens), we started seeing naked puts appear on Thursday and Friday.
Their break-even points sit right within the recent bullish move (#1 and #2 on screenshot).
Here’s how to interpret this:
If GBP starts to decline, these levels could act as support zones — and potentially mark the end of the correction.
The mechanics behind it?
By adding a long futures position to a long put, traders create a synthetic call — a structure designed to profit from upside after the dip.
In short:
They’re not just betting on a drop — they’re positioning for the next leg up.
#GBP futures
BTC/USDT 4H Chart 🔍 MARKET STRUCTURE
The chart shows a broad ascending channel in which BTC has been moving for several days:
Lower trend support: ~$87,500 – $88,000
Upper trend line: ~$94,500 – $95,000
The price has clearly rebounded from around $89,200, an important demand level.
📈 KEY LEVELS
Support
USD 89,284 – local support from which a rebound occurred
USD 87,804 – the next, much stronger support level consistent with the trendline
Resistance
USD 91,466 – currently being tested
USD 94,141 – key resistance and the upper band of the channel
📊 CHART SITUATION (4 hours)
1. Price action
The price has made a strong upward impulse from support at USD 89,280.
It is currently reaching local resistance at USD 91,450 – USD 91,700.
If this level is broken, the target is USD 94,000 – USD 94,500.
If it fails, a pullback to USD 90,200/USD 89,300 can be expected.
📉 MACD
Your MACD shows:
Bullish crossover – buy signal.
The histogram changes from red to green → momentum is increasing.
The curves are diverging, confirming the strength of the move.
This indicates that the short-term trend is turning bullish.
📌 TWO TRADING SCENARIOS
🟢 BULLISH Scenario (more likely)
Condition: H4 candle breakout and close above USD 91,700.
Targets:
TP1 → USD 92,800 – USD 93,200
TP2 → USD 94,000 – USD 94,500 (upper channel)
Stop-loss (if you were going long):
below USD 90,500
Safer below USD 89,280
MACD confirms this scenario.
🔴 BEARISH Scenario
Condition: rejection of USD 91,700 and a close below USD 90,500.
Targets:
TP1 → USD 89,300
TP2 → USD 87,800 (key trendline)
A drop to USD 87,800 would be an ideal place for large players to buy again.

BTCUSD BEARISH OR RETEST (READ CAPTION)Hi trader's what do you think about bitcoin usd
BTCUSD is currently showing a bearish retracement structure, suggesting that price may continue to correct downward after failing to hold higher levels.
🔹 Resistance Level: 93,800
This level acts as a strong rejection zone.
If price retests 93,800 and fails to break above, it confirms bearish continuation. Sellers are expected to remain active below this zone.
🔹 Support Level: 90,800
This is the first support level where price may attempt a short-term bounce.
If BTC breaks below 90,800, bearish momentum will likely increase.
🔹 Demand Zone: 89,200
This is the major demand zone where strong buyers may step in.
If price reaches 89,200, a potential bullish reaction can happen, but until then the market remains in a bearish correction phase.
📉 Market Outlook
BTCUSD remains under bearish pressure as long as it stays below 93,800.
Break below 90,800 opens the way toward 89,200 demand, where buyers are expected to show stronger interest.
please don't forget to like comment and follow thank you

BTC/USDT 4H chart review📉 1. Market structure – short-term 4H trend
In the chart I see:
• Breaking the upward trend line (black diagonal) – a classic signal of weakening momentum.
• After the breakout, there was a quite strong downward impulse, which confirms that the intraday trend has turned bearish.
• The price is currently testing around USDT 89,500-90,000, where a reaction is emerging, but not strong yet.
👉 Conclusion: 4H is now in a bearish correction and the market looks ready to test further lower supports.
⸻
🧭 2. Support and resistance levels (from your chart)
Upcoming supports:
1. 89,500–89,000 – the current level at which the market is trying to defend itself.
2. 88 185 – clear red line, first logical support lower.
3. 86,001 – next demand level, big candle from the past.
4. 83,720 – deeper support to which the market returns when there is great fear.
The nearest resistances (which need to be recovered to return to growth):
1. 90,467 – first key resistance; now it will work as a "flip".
2. 91 923 – stronger resistance; This is where the declines began.
3. 94,223 - only breaking this level shows that the bulls are back.
👉 The market is currently sitting BELOW the key resistance of 90,467, so downward pressure is active.
⸻
📉 3. Analysis of candles and price behavior
• The last 4-6 candles are large red bodies, which shows the clear dominance of supply.
• After the breakout of the trendline, there is no strong pullback - this means that the bears do not allow for a rebound.
• The lower shadow on the last candle indicates buyer reaction, but no confirmation yet.
👉 If 89,500 is broken, a move to 88,185 is very likely.
⸻
📉 4. MACD – negative signal
MACD shows:
• Bearish cross – the blue line crossed the orange line from above.
• The histogram turns into red bars - the downward momentum is increasing.
• MACD is below zero → confirmed downward trend in the 4-H interval.
👉 MACD confirms what we see on the chart: momentum is falling and a rebound is unlikely without consolidation.

OKLO Bullish Momentum – Nuclear x AI Narrative Ignites SurgeNYSE:OKLO is up +24% this week, gaining strong momentum after Nvidia CEO Jensen Huang stated that the future of AI will be powered by “small nuclear reactors.” This powerful narrative crossover between AI and nuclear energy has lit a fire under small-cap nuclear names, with OKLO emerging as a standout. The volume spike and price action signal strong speculative interest.
Trade Setup:
🔹 Entry Zone: $105 – $109
🔹 Take Profit Targets: $125 / $140
🔹 Stop Loss: $99
🔹 Risk/Reward: Favorable if breakout holds with momentum and volume confirmation

BTC 4H Chart Review1. Market Structure: Rising Channel (Upward Wedge / Rising Channel)
The chart clearly shows that BTC is moving within an ascending channel, with:
the upper boundary around USD 95,000–95,500,
the lower boundary currently reaching USD 86,500–87,000.
This is a potentially exhausting formation, and lower breakouts are often dynamic.
2. Current Situation: Rebound from the upper band and Stoch RSI overbought → decline
The price has stopped exactly at the upper resistance of the channel and has begun a correction.
This is typical behavior – the market usually returns to the middle or lower edge of the channel.
Stoch RSI on 4H – has made a strong reversal from the overbought zone
→ a signal for a short-term correction has already been generated.
3. Support Levels (most important):
🔴 USD 90,500–90,000
A very important zone – previous resistance ⇒ now support.
Breakout = increased risk of a deeper breakout.
🔴 USD 88,500–88,000
A strong demand level for the 4-hour period, also aligned with the MA and local lows.
🔴 USD 86,500–87,000
The lower band of the channel – the most likely place for buyers to become active.
4. Resistance Levels:
🟢 USD 94,800
Previous local high – a breakout will be bullish.
🟢 USD 98,000–98,900
Strong resistance on the chart, likely target after a breakout of the channel to the upside.
5. Scenarios for the coming hours:
📉 Correction scenario (more likely based on the Stoch RSI)
The price could fall to one of the following zones:
92,000 → test in progress
90,500–90,000 USD → main market decision level
If it loses 90,000 → a move to 88,500–88,000 is natural.
Deeper correction: test of the lower channel line – ~86,500 USD.
In this scenario, we remain in an uptrend unless the channel breaks below.
📈 Uptrend scenario
The current decline could only be:
a local correction,
a retest of the previous demand zone.
Uptrend condition:
➡️ 4-hour candlestick retracement and close above ~94,000 USD.
Then the target:
94,800
95,500
and after the channel breakout → $98,000–$99,000

NZDUSD: Hello Traders!
There might be more selling pressure if the downward move confirmed by breaking the 0.57 below!
and this is the daily chart!
You might get we are around a critical zone!

$INJ – Extremely Oversold at Key Support | Long Setup PotentialInjective CRYPTOCAP:INJ is trading at an extremely oversold level, sitting directly on major horizontal support that has historically triggered strong bullish reversals. The current zone could offer a high-risk, high-reward opportunity for a long spot position.
🟢 Trade Setup
Entry Zone: $5.50 – $6.00
Targets (TP):
• TP1: $7.00 – $8.00
• TP2: $10.25 – $12.00
• TP3: $14.00 – $16.00
Stop Loss: $5.00

LINKUSDT – Pullback Opportunity Before Next Leg Up?Chainlink (LINK) has rallied strongly but is now testing resistance, where price action could stall short-term. We're watching for a healthy pullback to reload for the next bullish wave.
🔹 Entry Zone: $12.50 – $13.50
🔹 Take Profit Levels:
• TP1: $15.50 – $16.50
• TP2: $19.00 – $21.00
• TP3: $25.00 – $28.00
🔹 Stop Loss: $11.90
Key Idea: A rejection at current resistance could offer a better long entry. If price dips into the $12.50–$13.50 zone and shows strength, it may kick off the next upward move.
📌 Watching for bullish confirmation in that range. Chart structure still favors upside as long as $11.90 holds.

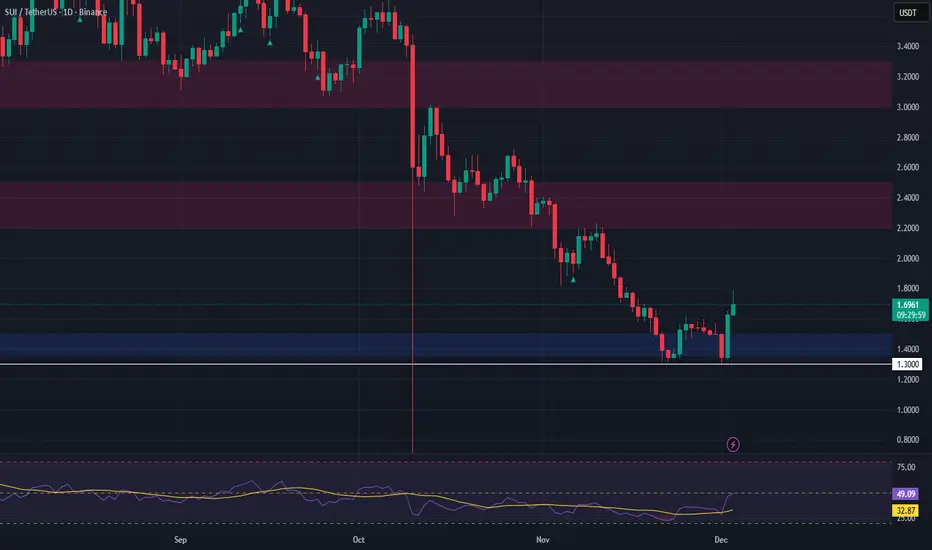
SUI Rally Cooling Off – Long Opportunity on Pullback!SUI has seen a massive rally over the past 24 hours, breaking out with strong bullish momentum. As price begins to cool off, we’re watching for a healthy pullback that could present a great long spot entry opportunity.
📉 Entry Zone: $1.36 – $1.50
🎯 Take Profit Targets:
• TP1: $2.20 – $2.50
• TP2: $3.00 – $3.30
🛑 Stop Loss: $1.30
The recent surge indicates strength, but after such explosive movement, a retest of support is likely before continuation. Patience is key—wait for the dip into the zone and monitor how price reacts. If support holds, this could be a strong mid-term trade setup.
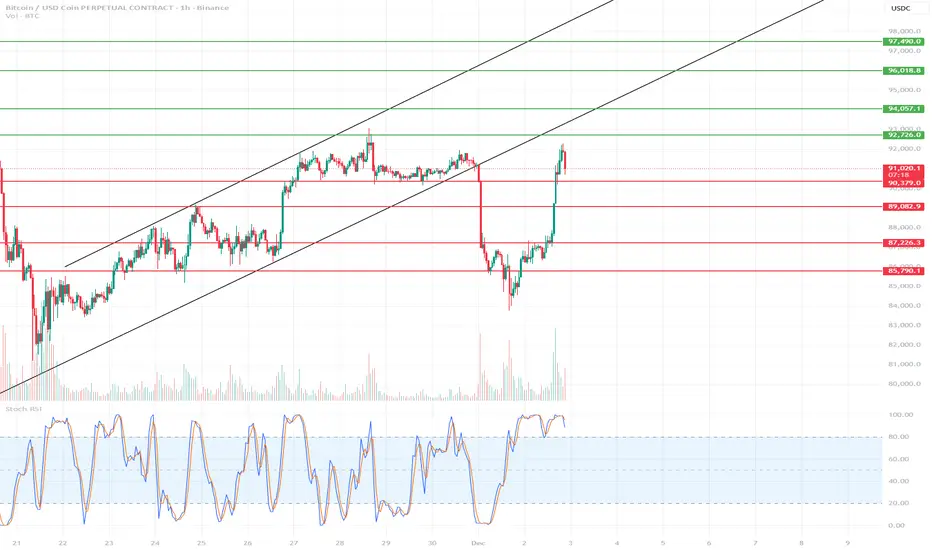
BTC Short-Term Chart 1H🔍 1. Current Market Situation
BTC has made a very strong rebound from around ~87,000 and reached the key resistance zone of 92,700–93,200, where the first signs of a slowdown are currently visible.
The Stoch RSI on the 1-hour timeframe is heavily overbought, which usually suggests a local correction or at least consolidation.
🔴 2. Key Resistance Levels (Short-Term)
92,726 → current resistance; the price has rebounded precisely from this zone.
94,057 → next strong resistance if BTC breaks above 92.7k.
96,018–96,866 → strong supply zone; only after breaking this zone will the uptrend resume in full force.
🟢 3. Major Supports (Short-Term)
90,379 – 90,990 → nearest intraday support zone
89,082 → strong support that halted the previous decline
87,726 → key to the upward structure
85,790 → critical level, a breakout opens the door to a deeper correction
📉 4. Short-Term Baseline Scenario
Most likely in the coming hours:
✔ Scenario A – correction from the current level (preferred)
Stoch RSI overbought
Price rejected from the 92.7k resistance
Large vertical move → market needs to cool down
Correction Targets:
90,900–90,300 → first TP/buy zone
89,100 → deeper correction but still healthy.
Long signal:
Return of h1 candle closes > 91.3k after a pullback.
✔ Scenario B – breakout of 92.7k and continued growth
If BTC breaks and holds above 93,200, upward momentum resumes.
Targets:
94,057
96,000–96,800 (strong supply zone – take profit area)
November's Tech Shake-Up: Google vs. Nvidia DivergenceNovember marked the widest divergence yet between Google and Nvidia NASDAQ:NVDA . Nvidia’s pullback wasn’t just routine profit-taking—markets started pricing in a strategic shift by hyperscalers potentially moving away from GPU-only AI stacks. This narrative could dilute Nvidia’s moat, while bolstering demand for diversified AI infrastructure players like Google.
📊 GOOGL Setup: Strong Fundamentals, Strategic Support
Google remains fundamentally strong and technically well-supported. With earnings resilience and infrastructure independence, NASDAQ:GOOGL may outperform if tech rotation accelerates. The stock is sitting above a clear demand zone, offering a calculated risk-reward play.
🔔 Trade Idea
Entry Zone: $252 – $256 (support area)
Take Profit 1: $292
Take Profit 2: $327
Stop Loss: $225
📌 This aligns with multi-month support and potential breakout continuation.

BTC/USDT 4H Chart Review🧭 1. Main Market Structure
The chart shows:
A broad downward channel that has been in place since the end of October.
The price bounced off the upper line of the channel, made a local upward impulse (orange trend line), and then broke it, returning back towards the lower regions of the channel.
➡️ This means that the dominant trend is still downward, and upward bounces are corrections.
🧨 2. Current Chart Situation
BTC has broken through:
the local uptrend (orange line)
fell below the 88,500–89,000 zone (green)
is heading towards further support levels
Currently, the price looks like a typical retest of the broken structure and a continuation of the decline.
🟩 3. Key Price Levels (S/R)
Resistance (upper – green):
91,600 – 92,000 – key level, a breakout would negate the local downtrend
95,000 – 97,500 – upper range of the descending channel
Support (lower – red):
85,300 – 85,800 – local support (price is currently reacting here)
83,000 – 83,100 – strong horizontal support
79,800 – strong support, historically strong in this timeframe
76,600
75,000 – lower band of a potential drop + near the lower boundary of the channel
➡️ The most logical downside targets are 83,000 and 79,800.
📉 4. Descending Channel (black) (lines)
The price has rebounded from the upper range of the channel and is heading towards the lower range.
The middle line of the channel has been broken down → a signal of trend continuation.
The lower boundary of the channel indicates a potential low around 75,000–78,000.
🔄 5. Stoch RSI
Currently oversold in the oversold zone, it is starting to curve upwards.
In a downtrend, long signals are weaker, but a short-term rebound is possible.
🧭 6. Scenarios
📉 Bearish scenario (more likely)
Technical rebound to 88,500 – 89,000
Rejection from this zone → continued decline
Targets:
83,000
79,800
Extremes: 76,000 – 75,000
➡️ This scenario is consistent with the trend and a rebound from the upper channel.

Ethereum (ETH) Rejected from $3K — Key Support AheadETH recently got rejected at the critical $3,000 resistance, a psychological and technical level that’s held firm amidst broader market volatility. However, bulls shouldn’t panic just yet — Ethereum is now approaching a major support zone between $2,640 and $2,770, where it has previously found strong buying interest. If macro conditions stabilize, momentum could return quickly from this level.
💡 Trade Setup
Entry Zone: $2,640 – $2,770
Take Profit Targets: $3,370 and $4,000
Stop Loss: $2,187
This setup offers a strong risk-reward profile, especially if ETH rebounds as it has done historically from this zone. Watch for volume confirmation and potential bullish divergences on lower timeframes to time entries.

GBPJPY: BUY IT!Hello Traders
This is the 1Y channel!
we are around a strong static level and mid of a bullish channel!
As it is obvious!
If we see a smooth correction! We will enter the trade!
Have fun!

BNB/USDT ANALYSIS - 4H interval🔶 1. Current Trend and Market Structure
The chart shows:
A clear short-term uptrend – the price is respecting the ascending yellow trend line.
An increase after a bounce from the SMA 50 (green).
However, there are still no new higher highs – the market is consolidating between 888–910.
➡️ Short-term trend: up
➡️ Medium-term trend: neutral/consolidation
🟩 2. Key Support/Resistance Levels
Resistance:
910–912 USDT – currently a key resistance, tested multiple times.
930–935 USDT – local higher resistance (green zone on your chart).
957–960 USDT – stronger resistance from D1 (blue SMA95 visible in the screenshot).
Supports:
USDT 889–893 – local support and the current battleground.
USDT 871 – SMA 50 + previous swing low.
USDT 849 – powerful support from the HTF.
USDT 837 – the final “lifeline” of the bullish structure.
📈 3. Indicators (MACD, RSI)
MACD
MACD > 0 – positive.
The MACD line is starting to point upwards → a signal of bullish momentum.
No divergence.
➡️ MACD supports the bullish scenario.
RSI
RSI ~59 – a healthy zone, far from overbought.
RSI breaks the local downtrend → increasing buyer strength.
➡️ RSI confirms the bullish trend.
🟧 4. Key Price Action Now
The price is currently approaching resistance at 910–912 USDT and simultaneously touching the local trend line.
This is the market's decision point.
A breakout → opens the way to 930–935.
A rejection → a return to 889, and below 871.

BTC Short-Term 15m Chart📉 BTC 15M — Short-Term Analysis
1. Key Levels from the Chart
Support
$90,400–$90,450 – strong, repeatedly tested (orange zone).
$90,178 – lower support (thin red line).
$89,460 – deeper daily support.
Resistance
$90,900–$91,000 – local resistance zone.
$91,214–$91,545 – SMA 72 / SMA 200 (yellow and blue) = strong dynamic resistance.
$91,800–$92,200 – higher structural resistance.
🧠 2. Market Structure
Short-term trend (15m)
Price remains below the SMA 200 and SMA 72 → bearish momentum.
Lower highs and lower lows are visible → bearish structure.
Narrower range: 90,400 – 90,900 → price compression / consolidation.
📊 3. Indicators
MACD – neutral / slightly bearish
Histogram hovers around zero → lack of strong momentum.
Recent downward crossover → downward pressure.
RSI – 48 (neutral)
Not oversold yet, but:
RSI is forming a bearish divergence from previous highs.
RSI often bounces from 50 in a downtrend → confirms bearish pressure.
🔎 4. What's happening now?
The price is retesting the $90,400 zone, a key defensive level for bulls.
The structure indicates:
supply pressure,
buyers exhausting themselves below the 200 SMA,
possible breakout below if 90,400 breaks.
🎯 5. Short-Term Scenarios (15m)
🔻 Bearish Scenario (more likely)
If 90,400 falls:
Target 1: 90,180
Target 2: 89,460
Target 3: 88,960
The structure strongly suggests this because:
Price below the 200 SMA
Weak momentum
No strong rebound from the lows
🔼 Bullish Scenario (only after breaking 90,900)
If the market rebounds from 90,400 and breaks 90,900:
Target 1: 91,200 (SMA 72 + 200)
Target 2: 91,550
Target 3: 91 800

ETH/USD 1D chart review1️⃣ Trend and general context
• ETH is trading after a sharp decline from its local high of ~4,000+.
• The price rebounded from a quite strong support zone around ~2,750–2,800.
• Current price: ~USD 3,034 → the market is testing the first local resistance.
Short-term trend: down, but a rebound and the first signs of reversal are visible.
Long-term trend: still upwards (HL/HH on large intervals).
⸻
2️⃣ Key Levels (from your chart)
🟩 Resistances
• USD 3,475 – key resistance + SMA (blue)
👉 if ETH breaks this level and closes 1D above → strong bullish signal.
• USD 4,061 – major resistance from previous highs.
🟥 Support
• USD 2,757 – the nearest strong support after breaking the trendline.
• USD 2,126 – very key macro support (bottom of consolidation).
⸻
3️⃣ Medium SMA
From your chart:
• Red SMA #1 – price is just above it → first positive signal.
• Blue SMA #5 – Acts as resistance and is currently being tested from below.
• Green SMA #2 – higher, acts as resistance at ~USD 3.475.
➡ The price must return above the blue and green SMA to confirm the return of the upward trend.
⸻
4️⃣ MACD
• The MACD at the bottom of the chart begins to curl upwards.
• The histogram decreases towards zero → the downward momentum weakens.
• Bullish cross is still missing, but it's getting closer.
Conclusion: Early signal of trend reversal, but not confirmed.
⸻
5️⃣ RSI
• RSI is in the zone around 40 → quite low, but not extremely.
• Slight divergence: the price made a lower low, the RSI made a higher one.
👉 This is a bullish signal, but only in combination with a resistance breakout.
⸻
6️⃣ Price Action
You can see:
• A long rising candle after a bounce from below.
• We are approaching the first important resistance at ~3.100–3.150.
To confirm continuation, you need:
✔ Closing of the 1D candle above ~3.150–3.200.
⸻
🎯 What might happen next?
Bull scenario (more likely if BTC also increases)
1. Breakout 3,150–3,200 → retest → move to:
• USD 3,475 (major resistance + SMA)
• then 3,800+
2. MACD makes a bullish cross → momentum is growing.
Probability: ~60%, but confirmation only after the breakout.
⸻
The Bears Scenario
1. Rejection from SMA (blue) and return below 3,000
2. Down to 2,750-2,800 again
3. If this breaks → move towards $2.126
Probability: ~40% at this point.

Swiss Franc: Approaching Key ER SupportThe Swiss franc is now testing the lower boundary of the Expected Range (ER) — a zone for potential pause or bounce.
Also
this ER level aligns perfectly with a visible liquidity cluster (marked with arrow) .
📌 In other words:
It's not only a statistical support — it’s a confluence = higher probability reaction.
