$BTC crash. Where is the bottom?Bitcoin is crashing — and while it looks scary, it’s also one of those rare long-entry opportunities you’ll regret missing once the rebound kicks in.
Why is Bitcoin dumping?
1️⃣ A major hedge fund manager shut down his Bitcoin fund.
Historically, this kind of event often precedes bubble corrections, creating panic in the market.
2️⃣ The FED won’t publish inflation or unemployment numbers due to the government shutdown.
With no data, Powell can’t justify a rate cut.
The market is now pricing a “no-cut scenario,” which puts downward pressure on all risk assets — including crypto.
3️⃣ Structural consolidation.
I already posted about this:
- bullish short-term,
- bearish long-term
This is exactly what’s happening.
The macro downtrend should end around Q2 2026, meaning we’ll likely grind down or range until then.
Is this a bear market?
Not really.
Bitcoin probably won’t see an -80% crash ever again.
But a -30% correction? Absolutely possible.
What does the chart say?
The current correction has a support zone at $94–95k.
If that breaks, the next zone is $88k — less likely but still possible.
Between now and Q2 2026, we’ll get several relief bounces.
If you go long without leverage on strong support zones, you can ride these bounces safely.
Where is the opportunity?
Buy the fear, sell the greed — classic strategy.
Altcoins will bounce even harder than BTC:
CRYPTOCAP:PEPE , NYSE:FUN , DeFi coins, memecoins — these always react with double-digit rebounds.
The key idea
👉 The best entries happen when everyone is panic-selling.
👉 The best exits happen when everyone is euphoric.
Stay smart, stay patient.
DYOR.
#Bitcoin #CryptoCrash #BTC #Altcoins #CryptoTrading #CryptoAnalysis #CryptoMarket #CryptoInvesting #BTCPrice #BuyTheDip #MarketUpdate #TradingStrategy #TechnicalAnalysis #Macro #RiskManagement #HODL #CryptoNews
Support

BTC 1W Chart !🔥 1. GENERAL TREND (1W)
The long-term trend is still upwards because:
• the price stays in the orange channel,
• the black trend line (key) has not been broken.
But at the same time:
➡️ We see correction after local ATH around 115-120k.
This is a typical cyclical decline after breaking out from the extremes.
⸻
🔥 2. KEY LEVELS OF YOUR CHART
Closest support (S)
1. 94 315 → current retest
2. 85,895 → key trend support
3. 74,896 → the most important defensive level against mega relegation
Nearest resistances (R)
1. 105,901 – the first serious resistance
2. 114 437 – strong ceiling
3. 125,907 – potential target for a new growth impulse
⸻
🔥 3. STOCHASTIC SITUATION (1W)
Stoch is deeply oversold → a signal of a potential rebound.
On a weekly basis, such signals usually mean:
• local minimum,
• beginning of a new growth wave in the 4-8 week window.
⸻
🔥 4. MARKET STRUCTURE (PRICE ACTION)
The current candles suggest:
• a strong defense attempt on 94k,
• getting closer to the black trend line,
• there is still room to move higher in the orange channel.
This looks like:
➡️ a correction in the upward trend, not a change in the trend.
⸻
🔥 5. SCENARIO FOR THE NEXT WEEKS
🟢 Growth scenario (more likely)
Condition: maintaining 94k or black trendline
Targets:
• 105,900 – first target
• 114,400 – medium target
• 125 900 – full swing to the upper edge of the channel
Probability: 60-70%
(because Stoch is sold out + entry to support the channel)
⸻
🔴 Downside scenario (less realistic)
Condition: weekly close below the black trendline
Only then do we fly:
1. 85,900
2. 74,900 – an absolute must-hold
A break of 74,900 would mean:
➡️ end of the growth channel
➡️ entering a long-term bear market
Probability: 30-40%
⸻
🔥 6. Summary in points
Current situation
• BTC is sitting right on support.
• Weekly Stochastic = buy signal.
• Growth channel still intact.
• The market looks like it's getting ready to rebound.
If 94k stays → we go to 105k+, then 114k.
If he hits the black line → 85k and 74k in the game.

ALGO Pullback Opportunity – Ready for the Next Leg Higher?After a strong 28% move up from our last call, Algorand (ALGO) has pulled back into a key support zone, potentially setting up for another bullish wave. This type of retracement after a breakout is typical in trending markets and often offers high-probability re-entry points.
📌 Trade Setup:
Entry Zone: $0.15 – $0.16
Take Profit Targets:
→ Tier 1: $0.22 – $0.26
→ Tier 2: $0.28 – $0.33
Stop Loss: Just below $0.13
This setup offers a favorable risk-to-reward ratio, targeting a continuation of the prior move while protecting against deeper downside. Volume confirmation and market conditions should be monitored closely for added conviction.

EUR/USD - Im still Bearish until HTF followsEUR/USD – 4H Outlook (HTF SMC Breakdown)
🟤 1. HTF Range & Macro Context
Price is still trading inside a large higher-time-frame bearish range, with the entire structure sitting below the previous major BSL that got taken earlier in the chart.
The massive orange zone at the bottom is your HTF demand range — the last big corrective area before the external sell-side at 1.13–1.14.
This zone has been tested, respected, and held strongly.
HTF takeaway:
👉 Market is still bearish overall, but short-term bullish from HTF demand.
🔶 2. Reaction From HTF Demand
Price dipped into the HTF demand block, tapped the 71% discount level, swept internal SSL, and then gave a clean BOS to the upside.
Inside that orange zone:
Strong rejection wick
Multiple BOS confirmations
Mitigation of IMB/FVG
Clean liquidity sweep
This gives bulls temporary control.
This is the origin of the current bullish leg.
⚪ 3. Current 4H Structure
Price is now working its way back toward the 4H supply zone (your grey box), which also aligns with:
A BSL sitting above
4H imbalance
Micro premium zone
Unmitigated distribution candles
We’re in a mid-range climb from HTF demand → into 4H supply.
4H view:
👉 Expect bullish continuation until supply is reached.
🎯 4. Key Levels To Watch
🟢 Upside Targets
4H Supply Zone → First reaction area
BSL above supply → Liquidity draw
If price breaks, next target → 1.1750 region
🟠 Downside Levels
Your marked arrow shows price may:
Tap into 4H supply
Reject
Either return back into HTF demand
Or create a higher low for continuation
Most probable based on your chart:
👉 Tap supply → pullback → continuation up
(as long as HTF demand holds)
🧭 5. Bias Going Forward
Short-term = Bullish
Macro = Still bearish but correcting
Flow = Bullish until 4H supply
Your chart implies a bullish path:
Liquidity above (BSL) is the next draw
Price is climbing cleanly
No weakness until supply is met
After hitting the grey zone:
📍 Look for rejection + change of character
OR
📍 Strong break + retest for bullish continuation
(depends on reaction)
🔥 Summary (Quick Version)
HTF demand respected beautifully
Price created BOS after SSL sweep → bullish
Now climbing to 4H supply
Expect a reaction there
If supply breaks → next leg to 1.17
If supply holds → pullback into mid-range or demand

BTC/USD 4H chart 🧭 1️⃣ Market structure
• We see a clear upward channel (black trend lines) - the price has been moving within it for several days/weeks.
• Current price: ~USD 101,630, which is just above the lower border of the channel (dynamic support).
• Latest high: ~$107,360 - this is local resistance.
• Final low: ~$99,000 - this is key psychological and technical support.
➡️ Medium-term trend: still upwards, but currently in a downward correction wave 📉 3️⃣ Technical indicators
🔸 Stochastic RSI (bottom panel)
• Both components (blue and orange lines) are close to the oversold zone (<20).
• This is a signal that sellers may be losing momentum, and a rebound from the lower support is possible in the coming hours.
⸻
⚖️ 4️⃣ Short-term scenarios (4H – 1D)
🟢 Bull scenario (probability around 60%)
• The rate remains above USD 101,400 (lower border of the channel).
• Stochastic RSI begins to rebound → buy signal.
• Potential move up to:
• USD 103,900 (first target)
• USD 105,900 (second target)
• USD 107,300 (main resistance)
➡️ Scenario invalidation: 4H candle close below USD 101,000.
⸻
🔴 Bear scenario (probability approx. 40%)
• Breakout of the USD 101,000 level with a 4H close below.
• Decline to $99,000-99,200 zone (major support).
• If this support breaks, next goals:
• $97,800
• $95,000
⸻
📊 5️⃣ Technical signal (4H)
➡️ Decision Zone: $101,000-$101,800
➡️ Technical signal: possible short-term rebound (RSI oversold, close to channel support).
➡️ Confirmation: 4H candle closing above USD 102,000 with volume - then a chance of a move to USD 104-106k.

BTC/USD 1D Chart🧭 Overall Market Picture
Bitcoin is in a medium-term downtrend, as confirmed by:
a descending channel (marked with white lines),
lower highs and lower lows,
price below the key EMA and SMA.
The price is currently testing the upper boundary of this channel, so it will be crucial whether it manages to break out of it to the upside or rebounds further down.
🔹 Key Price Levels
Support:
$100,650 — short-term support, previously seen price reactions.
$98,550 — next demand level from late October.
$96,950 — lower boundary of the descending channel, potential target for continued declines.
Resistance:
$106,300–$106,500 — current resistance (upper boundary of the channel + SMA100).
$109,700–$110,000 — strong resistance converging with the EMA200 and SMA200.
$112,000+ — channel breakout and trend change.
🔸 Technical Indicators
1. MACD
The histogram is starting to turn positive (descending red).
The MACD line is attempting to cross the signal from below — a potential bullish signal, but not yet confirmed.
➡️ Indicates a possible short-term upward correction within a downtrend.
2. RSI (14)
Value: ~40.5 — low, but has rebounded from oversold levels.
No bullish divergence, but the RSI is rising from below, suggesting a potential technical bounce.
➡️ Still more upside than downside before entering the overbought zone.
🔹 Moving Averages
EMA50 (~109,970 USD) and EMA200 (~110,380 USD) are above the price, confirming the downtrend.
The EMA50 < EMA200 cross holds – a classic death cross.
SMA100 (~106,300 USD) has just been tested – a key level that could determine the direction of the coming days.
🔸 Short-Term Scenarios
🟩 Bullish (30–40% chance)
Breakthrough of the upper channel line (~106.5k USD) + daily close above 107k USD.
Confirmation of the MACD and RSI signal > 50.
Targets: 109,700 → 111,500 → 113,800 USD.
➡️ A medium-term trend reversal is then possible.
🟥 Bearish (60–70% chance)
Bounce from the upper channel line and fall below 102k–101k.
Continuation of the downtrend.
Targets: 100,600 → 98,500 → 96,900 USD.
➡️ In this scenario, the market will maintain a lower high/lower low structure.
⚙️ Summary
Trend: Down, but with a short-term rebound attempt.
Key moment: reaction to the 106k–107k USD level.
If the channel with volume breaks, a bullish reversal.
If a rebound, a new low around 97k–99k USD is very possible.

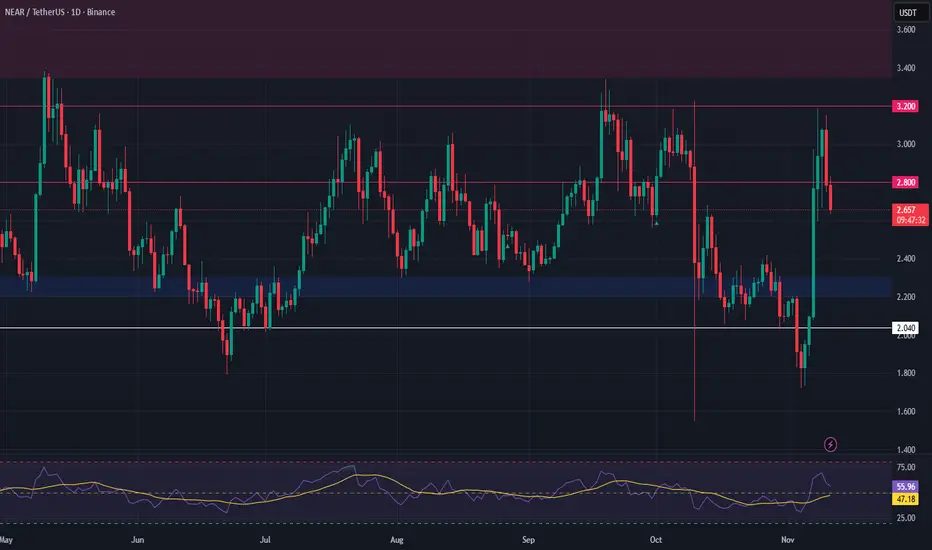
NEAR Protocol – AI Sector Strength & Breakout SetupStrength is rotating back into the AI and Web3 sectors, and NEAR is starting to show leadership. We’ve seen a clean breakout above consolidation, with volume confirming bullish intent. This could mark the beginning of a new leg up if the structure holds.
💡 Trade Idea
Entry Zone: $2.20 – $2.30 (support retest)
Take Profit Targets: $2.80 / $3.20
Stop Loss: $2.04
A pullback into the highlighted zone offers a high-probability entry, as prior resistance flips to support. The setup provides a solid R/R ratio for momentum continuation.
📊 Technical Outlook
Breakout confirmed with volume
Retest in progress or upcoming
Momentum shifting into AI narratives across crypto and equities
Watch closely for confirmation on the retest. As always, manage risk carefully.
🔔 Set alerts around the support zone for potential entry timing.
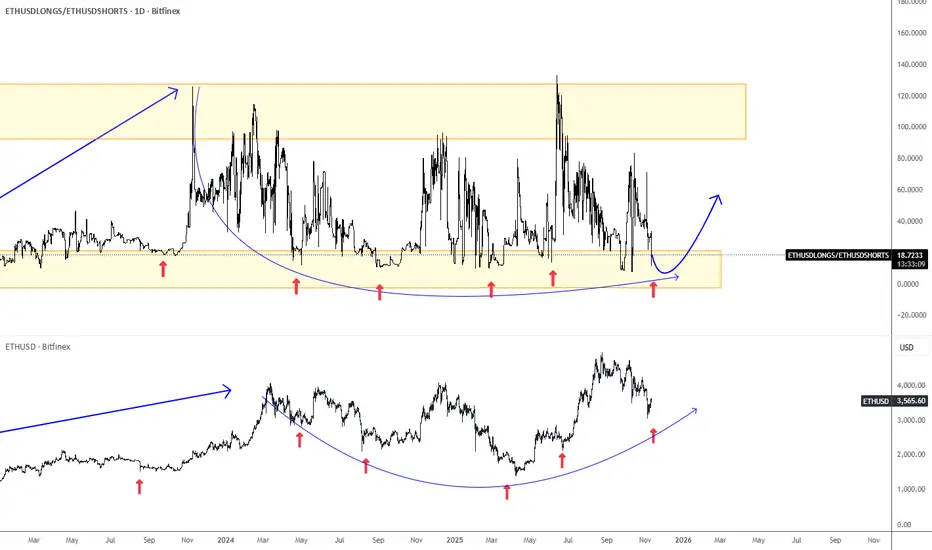
Ethereum Is Approaching SupportEthereum has been slowing down since August, but the wave structure remains slow, choppy, and overlapping, which suggests a correction within an ongoing uptrend. The ideal support area appears to be around the 3000 level.
One of the main reasons Ethereum may find support is the ETHUSD Longs/Shorts ratio chart, which came back to the lower end of its range. This indicates that many speculators are attempting to short the market while giving up on long positions.
If we take past cycles into account, Ethereum may experience limited weakness. Therefore, keep an eye out for a potential rebound and a bullish continuation, while the ETHUSD Longs/Shorts ratio chart could move back toward the upper side of its range.
ETH/USDT 1D Chart📊 Current situation
• Price: approx. USDT 3,402
• Main trend: downwards - there is a clear downtrend line (black line) which acts as strong resistance.
• Key zones:
• Resistance: 3490-3990 USDT (green zones)
• Support: 3185 and 2700 USDT (red zones)
⸻
🧠 Market structure
• ETH moves below the trendline, confirming the dominance of sellers.
• After the recent decline, there was a rebound from the support at USDT 3185, but buyers' power is limited - daily candles have long upper wicks → supply pressure.
• If the price does not break through USDT 3,490–3,500, there is a risk of a retest of the USDT 3,185 support, and if it is broken, a possible decline to around USDT 2,700.
⸻
⚙️ Stochastic RSI (bottom of chart)
• Stochastic RSI is in the oversold zone (approx. 30), but the lines have not moved significantly upwards yet - i.e. there is no confirmed buy signal.
• If the indicator starts to curve upwards and crosses above 20, it could indicate a short-term rebound (upside potential to USDT 3,490).
⸻
🧭 Scenarios
🔺 Growth scenario (less likely)
• Breaking the trendline and staying above 3490 USDT will open the way to 3990 USDT.
• Requires increased buying volume (volume looks rather neutral for now).
🔻 Downside scenario (more likely)
• Rejection from 3490 USDT or from the trendline → drop to 3185 USDT.
• Breakout of 3185 = move to 2700 USDT (strong support from previous consolidations).
⸻
📈 Summary
• Trend: downward
• Short term: possible rebound to 3490, but the risk of further decline remains high.
• Key level to watch: 3,490 USDT (if it does not break, it is better to avoid longs).
• Potential long signal: only after breaking the trendline and retesting with confirmation of RSI > 50.

EURUSD TIMEFRAME-BY-TIMEFRAME ANALYSIS# 💱 EURUSD (EUR/USD) COMPREHENSIVE TECHNICAL ANALYSIS 🎯
## Week of November 10-14, 2025 | Intraday & Swing Trade Mastery
Close Price: 1.15640 | Entry Point: November 8, 2025, 12:54 AM UTC+4 📊
## 🔍 EXECUTIVE SUMMARY - MULTI-TIMEFRAME PERSPECTIVE
EUR/USD is trading at a critical technical inflection point with strong multi-timeframe alignment signaling imminent directional breakout. Elliott Wave analysis reveals completion of corrective cycles, positioning for next impulse leg targeting 1.1650-1.1750 extension zone with substantial momentum. Bollinger Bands display classic compression squeeze pattern —volatility condensation preceding directional explosion. RSI across all timeframes maintains neutral-bullish bias (52-65 range)—optimal momentum positioning without extreme overbought conditions. Volume clustering at 1.1550-1.1630 represents significant institutional accumulation foundation. Wyckoff spring tests near 1.1500-1.1520 provide aggressive entry triggers. Harmonic pattern convergence at 1.1680-1.1750 resistance signals breakout confirmation with measured move targets extending to 1.1850+. ECB/Fed policy divergence supports directional clarity emerging this week.
## 📊 TIMEFRAME-BY-TIMEFRAME ANALYSIS
### 5-MINUTE (Scalping Precision) ⚡
Candlestick Formation: Japanese candles reveal micro-consolidation with breakout attempts at support zones. Evening Star rejection formations detected at 1.1680-1.1710 intraday resistance creating short opportunities.
Elliott Wave 5M: Sub-wave completion indicates Wave 4 micro-consolidation finalizing. Wave 5 breakout anticipated above 1.1650-1.1680 with targets 1.1720-1.1780 (measured move).
Bollinger Bands: Upper compression mode—middle band at 1.1630 acts as pivot point. Lower band rejection (1.1550-1.1580) creates scalp-long setups with excellent risk/reward ratios.
RSI (14) Analysis: RSI oscillating 48-62 range—neutral territory with minor divergences forming. Bullish divergence at 1.1550 support signals buyer engagement; caution on 68+ resistance approach.
Micro Support/Resistance: 1.1550 (micro-support) | 1.1600 (POC cluster) | 1.1640 (pivot) | 1.1690 (intraday resistance) | 1.1740 (scalp target)
Volume Signature: Volume concentrated 1.1600-1.1660 zone—institutional marker established. Breakout volume >50% above average required above 1.1690 for sustained move above 1.1750.
VWAP Alignment: Price oscillating around session VWAP at 1.1625—each touch generates scalp opportunity. Upper VWAP band at 1.1710; lower support at 1.1550.
### 15-MINUTE (Quick Swing Gateway) 🎢
Candlestick Patterns: Engulfing bars forming at support zones—bullish engulfing at 1.1570 zone confirms reversal attempts. Three-candle patterns (flag continuation) with 50-80 pips breakout potential.
Harmonic Pattern Recognition: Gartley Pattern potential completion near 1.1560-1.1620 PRZ (Potential Reversal Zone). Exceptional risk-reward at 1:3.5 for harmonic traders. Butterfly variant also forming.
Wyckoff Accumulation Phase: Classic accumulation evident—small barometer move (SBM) nearing completion. Spring test anticipated 1.1480-1.1510 zone; markup phase targets 1.1750-1.1850.
Bollinger Bands (15M): Band squeeze intensifying—historical volatility expansion suggests 70-120 pips moves follow. Upper band resistance at 1.1740; lower band support at 1.1520.
Volume Profile (15M): Point of Control (POC) at 1.1630—prime concentration zone. Volume surge >55% required confirming breakout above 1.1710. Imbalances favor upside significantly.
Ichimoku Cloud (15M): Price consolidating below cloud edge—Tenkan-sen at 1.1700 = resistance pivot. Kijun-sen (1.1660) = critical secondary support. Cloud support 1.1540-1.1610.
EMA Structure: EMA 9 (1.1650) above EMA 21 (1.1610)—bullish alignment confirmed. Price above both = intraday strength maintained.
### 30-MINUTE (Intraday Swing Axis) 🔄
Pattern Formation: Symmetrical Triangle pattern consolidating with apex near 1.1700. Ascending triangle variant shows bullish bias—breakout above 1.1680 targets 1.1780-1.1850 extension.
Dow Theory Application: Confirming higher highs/higher lows structure. Secondary trend bullish; pullbacks to EMA 20 (1.1640) = optimal swing entry zones identified.
RSI Divergence Setup: Positive RSI divergence confirmed—price making lower lows (1.1540) while RSI forms higher lows (42 level). Classic reversal setup targeting 1.1720 minimum.
Exponential Moving Average: EMA 9 (1.1665) = core support pivot. EMA 21 (1.1610) = secondary support. EMA 50 (1.1500) = structural hold level. Bullish ribbon alignment intact.
Support Architecture: 1.1500 (EMA 50/structural) | 1.1560 (demand zone) | 1.1610 (volume cluster) | 1.1650 (EMA 9 dynamic)
Resistance Architecture: 1.1680 (triangle formation) | 1.1750 (measured move target) | 1.1800 (weekly resistance) | 1.1850 (extension)
Volume Analysis (30M): Increasing volume on recent bars—accumulation signature strong. Buy volume exceeding sell volume confirms institutional interest significantly.
### 1-HOUR (Core Swing Trade Engine) 🎯
Elliott Wave Structure: Major wave analysis suggests Wave 3 completion near 1.1750. Current Wave 4 correction targets 1.1650-1.1700 support zone. Wave 5 impulse anticipated—target: 1.1850-1.1950.
Pennant Formation: Classic Bullish Pennant pattern forming—breakout confirmation above 1.1710 validates pattern. Pole height measured move = 1.1850+ realistic target.
Bollinger Bands (1H): Upper band at 1.1800 = squeeze breakout target. Middle band (1.1700) = bullish support zone. Lower band rejection (1.1500) creates swing longs with excellent R/R.
VWAP Daily: EUR/USD trading above daily VWAP at 1.1600—bullish gradient confirmed. Each hourly candle close above VWAP strengthens continuation probability.
Volume Profile Hotspot: Heavily traded at 1.1600-1.1660 (accumulation zone) and 1.1710-1.1780 (resistance cluster). Imbalances above 1.1800 suggest vacuum-fill potential.
Ichimoku Cloud Alignment: Price above Senkou Span A (1.1700) & Span B (1.1660)—cloud thickness indicates strong support. Chikou Span above candles = bullish confirmation. Cloud color: BULLISH GREEN.
Gann Theory Application: 45-degree angle from swing low (1.1450) establishes rally trajectory. Resistance at 38.2% Fibonacci extension (1.1750) precedes aggressive breakout phase.
Support Tiers 1H: 1.1500 (structural hold) | 1.1570 (EMA support) | 1.1620 (Kijun-sen) | 1.1660 (accumulation zone)
Resistance Tiers 1H: 1.1710 (breakout trigger) | 1.1760 (extension) | 1.1800 (major level) | 1.1850 (impulse target)
### 4-HOUR (Swing Trade Thesis Foundation) 💼
Inverse Head & Shoulders Pattern: Potential IH&S formation completing—left shoulder (1.1450), head (1.1400), right shoulder completing (1.1500-1.1560). Neckline breakout at 1.1710 targets 1.1900-1.2000 extension.
Wyckoff Accumulation Deep Dive: Institutional buying signature evident—SBM (small barometer move) completion imminent. Spring test to 1.1480-1.1510 anticipated; subsequent markup phase targets 1.1850-1.2000.
RSI 4H Analysis: RSI at 56-68 range—bullish bias maintained. Room for upside extension without extreme overbought. RSI above 74 targets 1.1900+; below 34 = defensive posture required.
Cup & Handle Formation: Potential bullish Cup pattern visible on 4H—handle stabilization near 1.1650-1.1700. Breakout above handle (1.1760) targets cup depth extension = 1.1850-1.1950.
EMA Ribbon Structure: EMA 8 (1.1680), EMA 13 (1.1660), EMA 21 (1.1610), EMA 50 (1.1500), EMA 200 (1.1350)—BULLISH ALIGNMENT PERFECT. Compression/expansion cycles identify momentum phases.
Support Tiers 4H: 1.1450 (structural support) | 1.1500 (accumulation) | 1.1600 (pivot) | 1.1660 (demand cluster)
Resistance Tiers 4H: 1.1710 (key breakout) | 1.1760 (extension) | 1.1800 (major target) | 1.1900 (weekly projection)
Volume Signature 4H: Accumulation volume bars > distribution bars—bullish bias maintained. Volume nodes clustering at 1.1600-1.1660 indicate strong institutional support zone.
### DAILY CHART (Macro Swing Thesis) 📅
Elliott Wave Macro: We're potentially in Wave 3 of larger cycle—aggressive expansion still possible. Wave structure supports break of 1.1800 targeting 1.1950-1.2100 daily close objectives.
Double Bottom Recognition: Historical Double Bottom pattern near 1.1350-1.1450 support—confirmed breakthrough above 1.1710 neckline triggered. Second target near 1.1900-1.2000.
Bollinger Bands Daily: Upper band at 1.1900 = realistic daily target zone. Mean (1.1750) = healthy pullback support. Band slope indicates volatility expansion—expect 100-200 pips daily ranges.
Volume Profile Daily: Strong buying volume bar at 1.1500-1.1650 zone—institutional accumulation marker established. Selling volume decreasing—demand controls trend absolutely.
Ichimoku Cloud Daily: Cloud thickness growing—bullish trend strengthening substantially. Cloud support around 1.1650-1.1750 zone. Kumo breakout anticipated—targets cloud top at 1.1800-1.1900.
Harmonic Analysis Deep: Butterfly Pattern potential completion—PRZ at 1.1710-1.1780 suggests reversal zone OR breakout confirmation. Confluence amplifies probability of extension.
Gann Angles & Fibonacci: 50% retracement (1.1550) + 61.8% extension (1.1850) = key reversal zones. Gann fan angles suggest 1.1800-1.1900 as structural resistance before continuation.
Key Daily Support: 1.1400 (psychological/structural) | 1.1500 (accumulation zone) | 1.1600 (demand level) | 1.1700 (midpoint)
Key Daily Resistance: 1.1710 (breakout trigger) | 1.1780 (extension) | 1.1850 (measured move) | 1.1950 (weekly target)
Trend Confirmation: Higher highs & higher lows maintained—uptrend intact. Daily close above 1.1800 = strong continuation signal targeting 1.2000+ next level.
## 🎪 TRADING SETUP PLAYBOOK - NOV 10-14
### BULLISH SCENARIO (Probability: 80%) ✅
Trigger: 4H candle close above 1.1760 + volume surge (>50% above average) + RSI above 64
Entry Zone: 1.1700-1.1750 (with breakout confirmation signal)
Target 1: 1.1780 (TP1) | Target 2: 1.1820 (TP2) | Target 3: 1.1900 (TP3) | Target 4: 1.1950 (TP4)
Stop Loss: 1.1620 (below EMA/structural support)
Risk/Reward: 1:3.2 (excellent asymmetric setup)
Trade Duration: 18-72 hours (prime swing window)
### BEARISH SCENARIO (Probability: 20%) ⚠️
Trigger: Daily close below 1.1650 + volume increase + RSI divergence failure
Entry Zone: 1.1760-1.1850 (short setup)
Target 1: 1.1710 (TP1) | Target 2: 1.1650 (TP2) | Target 3: 1.1600 (TP3)
Stop Loss: 1.1900 (above resistance)
Risk/Reward: 1:1.6 (acceptable but lower probability)
Trade Duration: Watch for trend reversal confirmation first
## ⚠️ VOLATILITY & OVERBOUGHT/OVERSOLD CONDITIONS
Current Volatility Status: Moderate compression → Expect significant expansion imminent
5M/15M RSI: 48-62 range (neutral)—room for 25-50 pips movements | Scalp target zones
30M/1H RSI: 52-66 range (bullish bias, optimal zone)—sweet spot for swing entries
4H RSI: 56-70 range—approaching caution zone but room to extend | Safe for core swings
Daily RSI: 60-74 range (approaching extremes)—be defensive if daily RSI>76 | Take profits aggressively
Overbought Recognition Points:
RSI daily >75 combined with upper Bollinger Band rejection = immediate profit-taking
Ichimoku cloud top penetration fails (bearish candle rejection) = trend exhaustion signal
Volume declining on breakout attempt = false breakout warning signal
Harmonic pattern PRZ exact hit without follow-through = reversal likely imminent
Oversold Bounce Setups:
RSI 1H <32 on support touch = high-probability bounce back to 1.1750-1.1800
Price below EMA 50 (1.1500) + RSI <30 = aggressive accumulation zone
Spring test below 1.1490 with volume surge = Wyckoff spring reversal trigger
Harmonic pattern PRZ support bounce = measured move extension targets activated
## 🎯 ENTRY & EXIT OPTIMIZATION STRATEGY
### OPTIMAL ENTRY TIMING
For Scalpers (5M): RSI bounce from 44-50 zone after Band lower touch = 15-25 pips scalp (1-3 min holds)
For Quick Swings (15M-30M): 15M candle close above 1.1690 with 4H alignment = 60-100 pips swing (30 min-2 hour holds)
For Core Swings (1H-4H): 4H pennant breakout above 1.1760 on volume = 150-250+ pips target (hold 12-48 hours)
For Position Swings (Daily): Daily close above 1.1800 = continuation play targeting 1.1950-2.0000 (hold 5-7 days)
Best Entry Windows: Asian session overlap (22:00-8:00 UTC), London open (8:00 UTC), NY close (21:00 UTC)
### EXIT STRATEGIES & PROFIT TAKING
Take Profit Levels: TP1: Fibonacci 38.2% (1.1760) | TP2: Harmonic PRZ (1.1820) | TP3: Daily Band upper (1.1900) | TP4: Weekly target (1.1950)
Stop Loss Placement: Always below most recent swing low + 20 pips (strict risk management priority)
Trailing Stops: Activate at TP2—trail with 30-40 pips buffer for 4H+ trades (lock in profits)
Breakeven Exit: Move stops to entry after 1:1 risk/reward achieved—eliminate emotional trading
Partial Profit Strategy: Close 25% at TP1 | 25% at TP2 | 25% at TP3 | Let 25% run to TP4 (maximize winners)
## 🔔 REVERSAL & BREAKOUT RECOGNITION CHECKLIST
### REVERSAL SIGNALS TO MONITOR:
RSI positive divergence (lower price lows, higher RSI lows) = bullish reversal setup high probability
Candlestick engulfing patterns at support/resistance zones = trend reversal confirmation strong signal
Volume profile breakdowns (declining volume on breakout attempts) = false move warning immediate
Ichimoku Cloud rejection (price fails to penetrate cloud layer) = structural resistance confirmed
Harmonic pattern completion at exact PRZ = reversal zone probability increases significantly
Elliott Wave 5th wave failure (truncation) = impulse completion = reversal imminent trigger
Gann angle break through significant angle = trend line break = reversal trigger activated
### BREAKOUT CONFIRMATION RULES:
Close beyond resistance with >50% volume surge above average = confirmed breakout signal strong
RSI crosses above 60 for bullish breakout, below 45 for bearish breakout confirmation
VWAP alignment with directional move = institutional participation confirmation strong
Bollinger Band breakout with band expansion (squeeze release) = volatility expansion confirmed immediate
Multiple timeframe confluence (5M + 15M + 1H + 4H aligned) = highest probability setup attainable
Ichimoku Cloud break (price clears all clouds with bullish candles) = strong continuation signal
Volume imbalance (ask volume > bid volume) = directional sustain likelihood increases significantly
## 💡 WEEK FORECAST SUMMARY - NOV 10-14
Monday (10th): 🌍 Consolidation continuation near 1.1650-1.1700 zone. Range-bound trading anticipated. Early breakout direction watch crucial. Entry setups favor reversal plays at support zones.
Tuesday-Wednesday (11-12th): 📈 Prime breakout window opens —1.1760 represents key decision point. Expect 100-200 pips daily volatility. Breakout confirmation targets 1.1820-1.1900 extension. This is the optimal swing trade window all week. ECB speakers watch critical.
Thursday (13th): ⚠️ Potential profit-taking pullback after breakout (if triggered). Support retest of 1.1780-1.1720. Buying opportunity if pullback holds above 1.1700.
Friday (14th): 📊 Weekly close pattern formation critical. Extension run anticipated if above 1.1800. If above 1.1850 = week target 1.1950-2.0000 achieved. End-of-week positioning for next week.
## 📍 CRITICAL CONFLUENCE ZONES - KEY TARGETS
1.1450-1.1500: Major support zone (accumulation marker, Wyckoff spring area, structural hold)
1.1550-1.1650: Secondary support (EMA 9, demand cluster, psychological level, volume POC)
1.1680-1.1710: Micro-resistance cluster (consolidation squeeze zone, early breakout resistance)
1.1750-1.1800: KEY BREAKOUT ZONE (triangle apex, harmonic confluence, all timeframe resistance)
1.1800-1.1900: Primary upside target (Elliott Wave 5, daily Band upper, measured move extension)
1.1900-1.1950: Secondary extension target (Gann level, macro resistance, wave projection)
1.1950-2.0000: Weekly/monthly target (if wave 5 impulse extends beyond base projections)
## 🏆 RISK MANAGEMENT RULEBOOK
✅ 1) Position Sizing: Never risk >2% of account equity per single trade
✅ 2) Risk-Reward Ratio: Minimum 1:2.5 R/R on every entry—1:3+ preferred for swing trades
✅ 3) Profit Scaling: Close 25-50% at 1:1 ratio, let remainder run to 1:2+ targets
✅ 4) Stop Loss Discipline: Place stop IMMEDIATELY on entry—no exceptions (20 pips tight)
✅ 5) Breakout Confirmation: Avoid FOMO—wait for candle close confirmation + volume surge always
✅ 6) Daily Support Respect: Psychological holds (round numbers 1.1600 | 1.1800) matter—trade confluence not against
✅ 7) Time Management: Exit losing trades quickly (max 1:0.5 acceptable for educational losses)
✅ 8) Macro Alignment: Always check daily/4H bias before taking 1H or lower trades
## #EURUSD #EUROUSD #FOREXTRADING #EURUSDANALYSIS
#TECHNICALANALYSIS #ELLIOTTWAVE #HARMONICPATTERN #BREAKOUTTRADING
#SWINGTRADER #DAYTRADING #INTRADAY #FOREXANALYSIS #TRADINGVIEW
#BOLLINGER BANDS #RSI #ICHIMOKU #VWAP #TRADINGSTRATEGY
#WYCKOFFMETHOD #GANNTHEORY #DOWTHEORY #TECHNICALS #ANALYSIS
#SUPPORTANDRESISTANCE #VOLUMEANALYSIS #OVERBOUGHT #OVERSOLD #REVERSAL
#FOREXTRADERS #CURRENCYTRADING #BREAKOUTSETUP #TRADERSOFTWITTER
#TECHNICALTRADER #CANDLESTICK #PATTERRECOGNITION #CHARTANALYSIS #DAYTRADER
## 🎁 BONUS: DAILY PRE-MARKET CHECKLIST
Use this every morning before market open:
☑️ Check daily RSI (should be 60-72 for bullish bias continuation)
☑️ Identify support/resistance zones (1.1600 | 1.1700 | 1.1760 | 1.1900)
☑️ Verify 4H chart alignment (pennant/IH&S pattern status update)
☑️ Check Ichimoku cloud position (above/below = trend confirmation signal)
☑️ Review 1H Elliott Wave count (which wave are we trading exactly?)
☑️ Scan volume profile (POC = likely rejection zone area)
☑️ Set entry orders + stop losses BEFORE Asian session closes
☑️ Plan 3 Take Profit levels before entering any position
☑️ Monitor ECB/Fed speakers + economic calendar (interest rate expectations)
## 🌐 FOREX SESSION NOTES
EUR/USD trades 24/5 across all sessions . Highest volatility typically occurs:
Asian Session (22:00-8:00 UTC): Lower volatility—good for breakout setups forming
London Session (8:00-16:30 UTC): Prime trading hours —peak liquidity + volatility combination
NY Session (14:30-21:00 UTC): Secondary volatility surge—often confirms London direction
ECB/Fed Policy Impact: Monitor policy divergence—higher Fed rates support USD weakness = EUR strength
💡 Disclaimer: This technical analysis is educational only. Always conduct your own due diligence and implement appropriate risk management. Past performance does not guarantee future results. Trade responsibly within your risk tolerance. Use stop losses on every position. Not financial advice.
Analysis Created: November 8, 2025 | Valid Through: November 14, 2025 | Updated Daily

LTC/USDT 1D🕵️♂️ The overall picture
• Price: 102.50 USDT
• Trend: The current downtrend is down (black downtrend line), but we are currently breaking above the trendline, which may signal a change in direction.
• Interval: Daily (1D)
⸻
📊 Key technical levels
• Resistance 1: 106.99 USDT
• Resistance 2: 119.25 USDT
• Support 1: 95.61 USDT
• Support 2: 89.65 USDT
• Support 3: 79.90 USDT
The current candle has broken above the downtrend line and the level of 95.6 USDT, which is a bullish signal.
⸻
🔥 Volume
• You can see a big increase in volume during today's bullish candle - this confirms that the buyers are in control.
• This is a classic example of a confirmed breakout from a downtrend.
⸻
📈 Candles
• Today's candle is a strong demand candle (green) with a large body.
• If today's close stays above the trend line (~100 USDT), it will be a technical confirmation of the breakout.
⸻
⚙️ Stochastic RSI indicator
• The blue line (RSI) is rebounding from the oversold area (<20) and heading upwards - this is a buy signal.
• The orange line begins to turn in the same direction, which may indicate the beginning of an upward impulse.
⸻
💡 Scenarios:
🟢 Growth scenario (more likely):
• Maintaining the price above 100 USDT = breakout confirmed.
• Potential targets:
• 106.99 USDT – first test of resistance, possible short pullback.
• 119.25 USDT – main target in the medium term (approx. +16%).
🔴 Downside scenario (if the breakout turns out to be false):
• Return below 95.6 USDT and closing of the daily candle there = false breakout signal.
• Then a possible decline to 89.65 USDT, and with further weakness even 79.90 USDT.

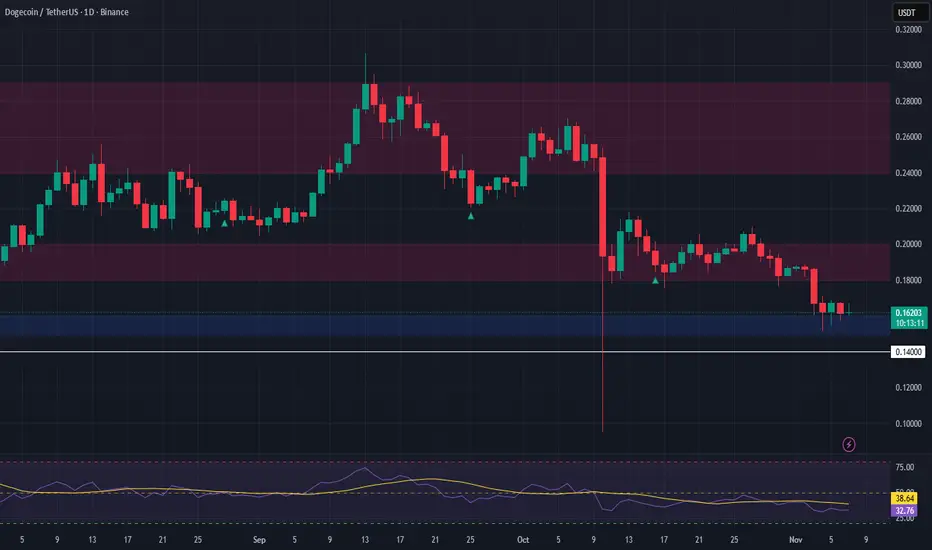
DOGE Testing Key Support – Watching for ConfirmationDOGE is currently testing a critical support zone in the $0.15–$0.16 range. This level has historically acted as a base for bullish reversals. However, we're only considering a long entry if both DOGE and BTC confirm signs of holding their respective support levels. BTC’s structure remains crucial for altcoins to gain traction.
🔹 Long Spot Trade Setup (Conditional on Confirmation):
Entry Zone: $0.15 – $0.16
Take Profit Targets:
• TP1: $0.18 – $0.20
• TP2: $0.24 – $0.29
Stop Loss: Below $0.14
This setup targets a strong risk-to-reward structure, but we stress the importance of waiting for bullish confirmation before entry.
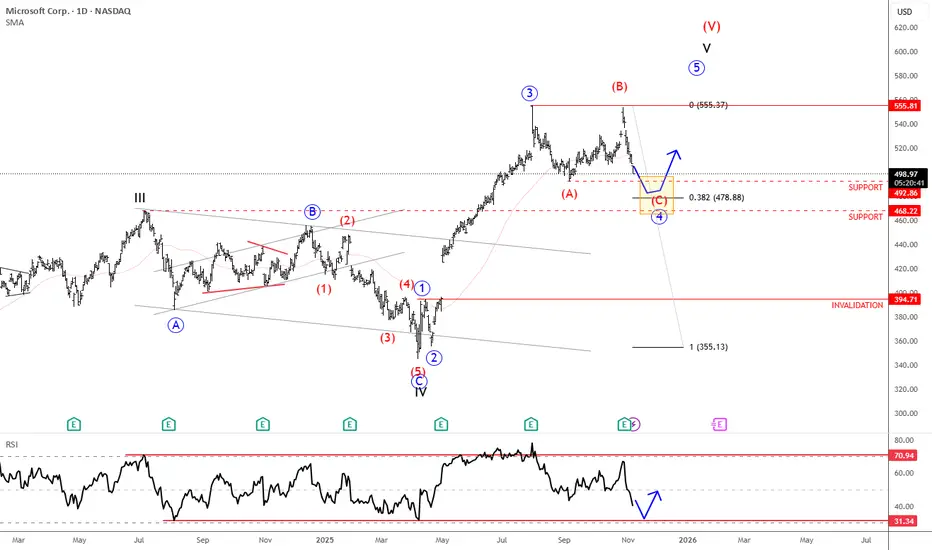
Microsoft Is Finishing Wave 4 CorrectionMicrosoft is in a wave 4 correction, and once it's fully completed, it can extend the rally within wave 5 from a technical point of view and according to Elliott wave theory.
Microsoft is a global technology company founded by Bill Gates and Paul Allen in 1975. It’s best known for its Windows operating system, Microsoft Office suite, and cloud platform Azure. Over the years, Microsoft has expanded into gaming (with Xbox), professional networking (LinkedIn), and AI (through partnerships like OpenAI). Today, it’s one of the world’s most valuable and influential companies, shaping software, hardware, and cloud computing industries.
Microsoft reported earnings last Wednesday after the close, with the price turning lower after reaching new highs. The structure still appears to be a wave four in progress — a flat correction where the current drop likely represents wave C. Wave C often stabilizes near wave A levels, suggesting support around 492 and 468 (the former 2024 high). Holding this zone could set up the next rebound into the final higher-degree wave five.
Highlights:
Trend: Corrective phase, wave C of flat in progress
Potential: Rebound toward new highs once support holds
Support: 492 / 468
Invalidation: Below 394
Note: Watch for stabilization at support before potential wave five continuation
SUI Approaching Major Support – Long Spot OpportunitySUI has entered a key support zone between $1.82 – $1.96, a level that has historically shown strong demand. Price is consolidating near the upper end of this zone, which could indicate potential accumulation. If this level holds, it presents a solid opportunity for a long spot entry.
🔹 Entry Zone: $1.82 – $1.96
🔹 Stop Loss: Below $1.75
🔹 Take Profit Targets:
• TP1: $2.40 – $2.80
• TP2: $3.10 – $3.55
This setup offers a favorable risk-to-reward ratio, especially if volume and market momentum align with the bounce. Watch for bullish confirmation signals—such as strong candle closes or rising volume—within the support zone before entering. Always respect the stop loss to protect capital.

HD Trade Setup – Retesting Support After 5% SurgeHome Depot NYSE:HD has bounced nearly 5% since our last post and is now retesting a major support zone between $375 – $380. This zone has consistently acted as a base, and the current price action suggests buyers may be stepping back in — potentially setting up for another bullish move.
📈 Trade Idea
Entry Zone: $375 – $380
Take Profit Targets:
TP1: $400 – $412
TP2: $423 – $435
Stop Loss: Just below $370
The setup offers a clean risk-to-reward structure with the broader market still holding a bullish bias. Watch for volume confirmation or bullish candlestick signals to strengthen the case.

Gold 8H Forecast- Price will continue to sell off🔥 GOLD (XAU/USD) – 8H Forecast 🔥
Alright fam, let’s break this one down nice and clean 👇
🧠 Bias : Short-term bearish → Long-term bullish
Gold’s cooking a classic pullback setup right now — we’re in a mid-range squeeze after that massive rally and rejection from the external BSL (Buy-Side Liquidity) at the top.
📉 Technical Breakdown
Price broke structure at the top and started forming lower highs under that descending trendline.
We’ve already taken external SSL (Sell-Side Liquidity) below recent lows, showing signs of a cleanup phase.
The current compression looks like a bearish continuation pattern that could push into the 8H demand zone around $3,750 – $3,800.
That zone also aligns perfectly with the 200 EMA, making it a juicy liquidity magnet before any major reversal.
🎯 Potential Play
Short-term:
Watch for a breakdown below current structure → ride it down to that $3,750 demand area.
Ideal short confirmation = rejection at the $3,950 – $4,000 supply zone.
Medium to Long-term:
Once price taps that HTF demand, expect bulls to step back in hard.
A clean rebound from there could launch us toward $4,300 – $4,500, following the red arrow projection. 🚀
⚙️ Risk Management
Avoid early longs until the sweep and reaction from demand confirm a shift.
Keep stops tight above the 8H swing high if shorting.
Wait for structure + volume confirmation before flipping bias long.
🧩 Summary
Gold’s chilling mid-range after a big rally — expect one more dip into demand before the next bullish leg ignites. HTF structure remains intact, but we’re not done with the correction yet. Patience pays here.

ADA Retraces to Key Support | Long Spot OpportunityCardano (ADA) has retraced into a major support zone between $0.50 – $0.52, a level that previously acted as a strong base for bullish moves. This pullback could offer a high-probability long setup, especially if buying volume confirms price stabilization.
🟢 Trade Setup – Long Spot
Entry Zone: $0.50 – $0.52
Take Profit Targets:
• TP1: $0.59
• TP2: $0.67
• TP3: $0.85
Stop Loss: Just below $0.485

$BTC — Liquidity Grab Completed, Next Move LoadingBitcoin recently dipped toward the $98K zone, sweeping liquidity just below the psychological $100K support. That move likely cleared leveraged longs and triggered stop hunts — a classic liquidity grab setup.
Currently, BTC has regained above the 100K handle, suggesting strength and possible continuation toward the $106K–$108K liquidity pocket, where upside stops may rest.
My short-term bias:
Longs: Possible but risky here — prefer entries near 99K–100K with tight stops.
Shorts: Avoid shorting now; better to wait for the market to reach 106K–108K and show exhaustion or reversal signs before entering.
If BTC forms a double bottom around 98K, it could be a solid accumulation signal for another leg up.
However, a clean break below 98K would open downside liquidity toward the 90K zone — the next significant support area.
📈 Plan Summary:
Long bias until 106K–108K
Watch for liquidity sweep at highs
Potential double bottom near 98K
Breakdown confirmation → Target 90K
Patience is key — let liquidity guide your next move.
#Bitcoin #BTCAnalysis #CryptoMarket

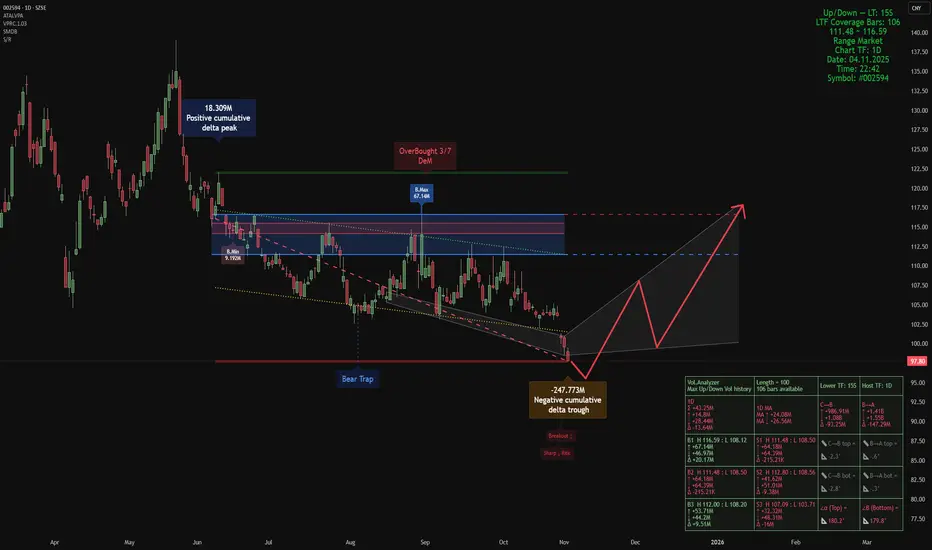
Smart Money Composite View — BYD Company Limited Class ASmart Money Composite View — #002594 (1D), BYD Company Limited Class A
Indicators used:
• Smart Money Support/Resistance
• Smart Money Dynamics Blocks (Pearson Matrix)
• ATAI •Volume Pressure Analyzer v1.2 — Pure Up/Down (Editorial Pick)
We fuse these three into a single composite read. With offset = 48, the setup highlights where price sits relative to smart-money demand/supply, how liquidity is being absorbed, and where momentum can re-emerge.
Market read (composite)
• Price is trading below the 112–118 supply block, which currently acts as the dominant resistance. The failed attempts into this band and the overhead “OverBought” tag mark it as the active sell wall.
• The current swing printed a large negative cumulative delta trough (~-247.8M) right at the lower reaction zone (bear-trap baseline + descending structure). That’s classic absorption of aggressive selling rather than fresh distribution.
• Wing geometry is near-flat (α≈180° / β≈179.8°), signalling compression: momentum has bled off while liquidity rotates. This is typically the pause before a directional decision.
• The grey path on the chart sketches the logical reaction sequence: a relief leg first into the mid-band (~108), where supply should be re-tested, and—only if absorption continues—an extension toward 112–118. Until price reclaims and holds above ~108, the structure remains a redistribution risk under that supply.
Invalidation: A decisive close below the recent trough low (the bear-trap baseline on the chart) would negate the recovery sequence and opens lower prices.
This analysis is a personal market view and is not investment advice.
ETHFI – Potential Rebound from Major Support ZoneETHFI is currently testing a critical support zone between $0.60 and $0.80, a level that previously held strong during market corrections. Price structure appears to be respecting this level, and the RSI is nearing oversold territory, hinting at a possible momentum shift. This combination sets the stage for a potential bounce if current conditions hold.
🔹 Trade Idea Setup
📌 Entry Zone: $0.60 – $0.80
🎯 Take Profit Targets:
• TP1: $1.90
• TP2: $2.90
🛑 Stop Loss: $0.18
This setup presents a favorable risk-reward ratio, with entry at support and clearly defined targets. RSI signals are adding confluence, but always watch for volume confirmation and broader market behavior.

Chainlink (LINK) – SmartCon 2025 + Key Support TestLINK is in focus as SmartCon 2025 kicks off today, drawing attention to the broader Chainlink ecosystem. Historically, this event has sparked major announcements and partnerships, often impacting LINK price action. Traders are now watching for potential bullish catalysts during the event.
Technically, LINK is breaking down into a key support zone between $14.50 and $15.00. This zone has held in the past and could act as a launchpad for a reversal bounce, especially if event-driven sentiment kicks in. Failure to hold this zone opens the door to deeper retracements.
🛠️ Trade Setup (Idea Only):
Entry Zone: $14.50–$15.00
Take Profits: $20 / $22 / $25
Stop Loss: $13
Bias: Short-term bullish if support holds

ETH/USDT 1W Chart📊 Market Structure:
Main Trend: Still up (higher lows and highs pattern persists).
Current Phase: Correction in an uptrend.
Local Trend: Down for several weeks (series of red weekly candles).
⚙️ Key Support and Resistance Levels:
Resistance (green lines):
4,753 USDT – recent local high, very strong resistance.
4,373 USDT – previous consolidation level, currently a supply zone.
3,979 USDT – current key local resistance, which previously served as support.
Support (red lines):
3,600 USDT – currently tested support level (coincides with the uptrend line).
3,165 USDT – next strong support level (previous local lows).
2,740 USDT – strong long-term support, potential target for further correction.
📈 Trendline:
The black uptrend line connects successive higher lows since April 2024.
The current weekly candlestick is testing this line (confluence with support at 3,600 USDT).
Maintaining this line = still a bullish medium-term scenario.
A breakout and weekly close below ~3,580–3,600 USDT → a signal of a possible trend reversal.
📉 Volume:
Downward volume is increasing, indicating supply pressure.
A lack of strong demand candlesticks = buyers are cautious in this zone.
🔄 Stoch RSI Oscillator (bottom of the chart):
Located in the oversold zone (below 20).
The %K (blue) and %D (orange) lines are starting to converge → a possible rebound signal in the coming weeks if a crossover occurs upwards.
🧭 Scenarios:
🟢 Bullish
Holding support at 3,600 USDT + trendline.
Confirmation with a bullish candle with higher volume.
Target: Return to 3,980 → 4,370 USDT.
🔴 Bearish:
Closing the week below 3,580 USDT (trendline + support).
Potential decline to 3,165 USDT, and even 2,740 USDT beyond.
RSI and volume suggest that downward pressure remains significant.
📌 Summary:
Key level: 3,600 USDT → decisive point for the market's further direction.
Short-term: Still downward pressure, but a technical rebound is possible (Stoch RSI).
Medium-term: The uptrend has not reversed until ETH closes below the trend line and 3,550 USDT.

BTC/USDT 1H Chart Short-Term📉 Descending Channel (black lines)
The price previously moved within a clear descending channel, which was broken upward.
A breakout from the channel signals a change in the short-term trend – from supply pressure to an attempted rebound.
From a technical perspective, a breakout from a descending channel often leads to an upward correction, the extent of which is at least the midpoint of the previous downward impulse.
🔷 Triangle Formation (blue lines)
After breaking out of the channel, the price formed a symmetrical triangle (consolidation) – a sign of market indecision.
Triangles of this type are often trend continuation patterns, but in this context – after a breakout from a descending channel – an upward breakout (i.e., a further upward rebound) is more likely.
The key resistance level to watch is $111,145 – a breakout with volume confirmation would open the way to $112,320 and then $113,921.
🧭 Key Technical Levels
Resistance:
$111,145 – local resistance (upper boundary of the consolidation/triangle).
$112,320 – another strong resistance level from the previous local high.
$113,921 – major medium-term resistance.
Support:
$110,442 – lower boundary of the triangle (short-term support).
$108,793 – support after the recent bounce.
$107,285 – next demand level.
$104,969 – bulls' defensive boundary in the broader context.
📊 Stoch RSI (bottom of the chart)
The Stoch RSI oscillator is currently in a rebound phase from the neutral level (~40–60).
If the lines (blue and orange) cross upwards and enter the zone above 80, this could confirm bullish momentum and a breakout from the triangle to the upside.
However, a rejection from 60 and a further drop below 20 would signal a false breakout and a possible retest of USD 108,800.
🔎 Scenario Summary
➡️ Upside Scenario (more likely):
Breakout from the triangle to the upside (confirmed by a 1-hour candle above USD 111,150).
Potential move to USD 112,300 → USD 113,900.
Momentum indicators support a rebound if the Stoch RSI maintains its upward trend.
⬇️ Downside scenario (alternative):
Unsuccessful breakout and return below $110,400.
A correction to $108,800 can then be expected, and if this level is broken, a further decline to $107,300.
