ETHUSDT 1H - Key Liquidity Zones & Bullish Reversal Potential ETHUSDT 1H Analysis: Price is reacting from a critical support zone between the Fib 0.5 - 0.618 retracement and previous day low, both marked as high-liquidity areas. If current support holds, expect a potential bounce targeting the previous day’s high ($4,530.80), with further upside toward the buy side liquidity at $4,748.04. Watch for confirmation in the highlighted demand zone for low-risk long setups. A break below $4,143.60 would invalidate this scenario and shift focus to lower sell side liquidity.”
This chart setup is useful for traders seeking possible long opportunities, with clearly defined risk and upside targets.
Supportandresitance

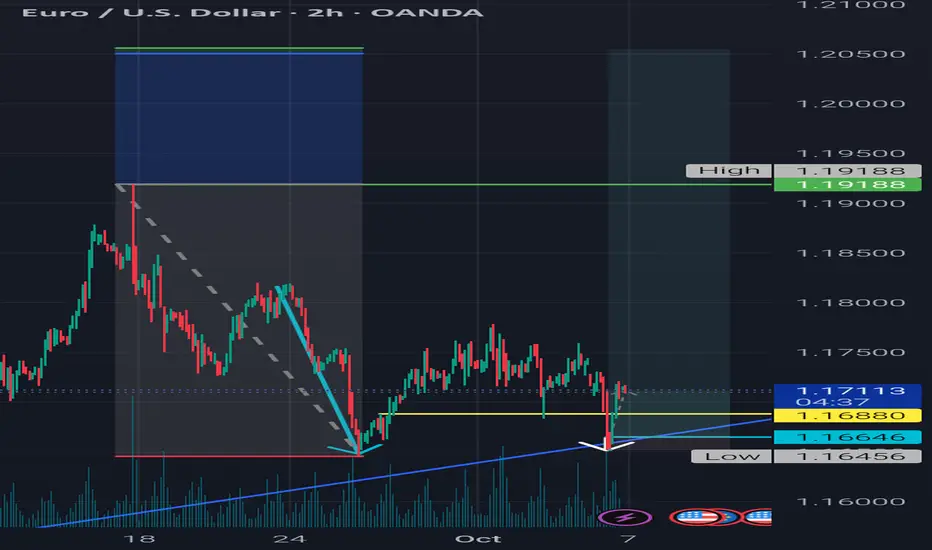
Momentum-Backed Retracement + Volume Retest | BadgerFX 📊 This setup establishes directional bias from the monthly chart (Current Bias: 📈 Bullish). The trade idea integrates momentum-driven retracements in line with this bias and validates continuation through structure and volume on the 15m.
📍 1.16880 confirmed the shift in structure, supported by volume, reinforcing alignment with the monthly trend. Final execution 🎯 relies on candlestick precision for entry timing.
⚠️ Disclaimer: The information shared here is for educational and entertainment purposes only and should not be considered financial advice.
BadgerFX 🦡 – Honey Badger Don’t Care
Xiaomi Corporation 1810 buy opportunityDue to repeating head and shoulder pattern and finishing correction, I expect it to go up.
Buy at market with stop loss 10 dollars and target for exiting as resistance level.

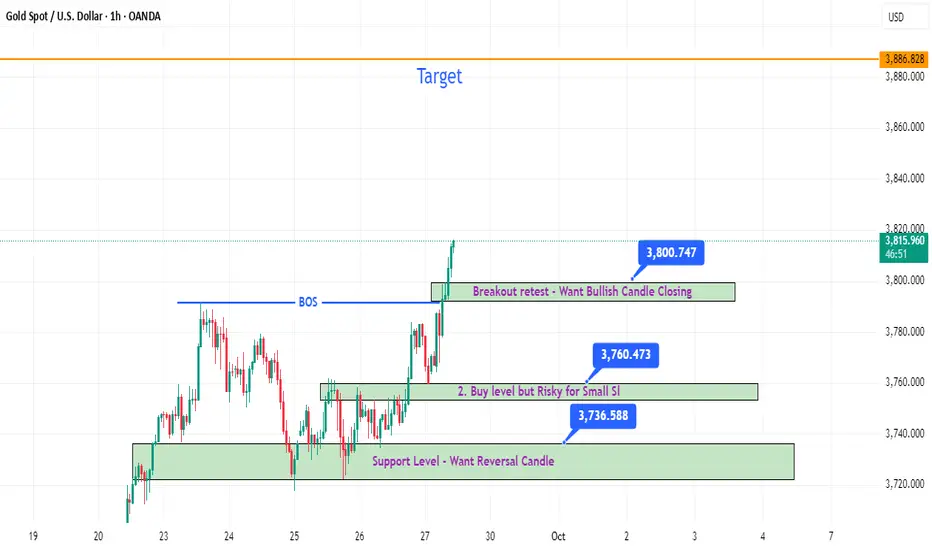
4 Hour Strong - Gold Next Level - DroidTradingGold Buying Level
Every Price Mention Possible Entry Zone.
If Tapped Take Entry as per your Risk - SL previous Candle low , Calculate SL right know.
3801 retest Level want Bullish Candle Closing - Target ( 3840-50 or 3885-90 ).
Keep SL, Book Your Daily Target
USD/JPY - BULLISH REVERSAL IN PLAYThe recent price action on the USD/JPY 30-minute chart confirms a Change of Character (CHOCH), marking a significant shift in market structure from a bearish trend to a potential bullish reversal. This CHOCH is a critical technical signal indicating that the previous downtrend has lost momentum and that buyers are beginning to take control of the market.
Leading up to the CHOCH, the market had been consistently forming lower highs and lower lows, respecting a well-defined trendline resistance. This downtrend was also characterized by multiple Breaks of Structure (BOS) to the downside, reinforcing the bearish sentiment. However, as price approached a strong support zone, it began to consolidate, suggesting a buildup of buying interest. Eventually, price broke above the most recent lower high, completing a clear CHOCH — the first structural sign that the bearish trend had been invalidated.
This CHOCH is further validated by the break of the descending trendline, a strong bullish impulse candle, and a reaction from the support zone, all of which add confluence to the idea of a trend reversal. Additionally, the breakout occurred with noticeable momentum (as implied by the volume indicator icon on the chart), further reinforcing the likelihood of continued upside movement.
With the CHOCH confirmed and the previous bearish structure broken, the market is now positioned to seek liquidity and inefficiencies above, specifically targeting the next key resistance zone located around 149.600 to 149.900. This area represents a prior supply zone and contains a “weak high,” which often acts as a price magnet during bullish reversals, as the market seeks to test or sweep liquidity from those levels.
In conclusion, the CHOCH marks a decisive shift in direction, and the market structure now supports a bullish move. As long as price holds above the recent low and continues to print higher highs and higher lows, the next likely destination is the resistance zone, where traders should watch for either profit-taking opportunities or signs of further continuation.

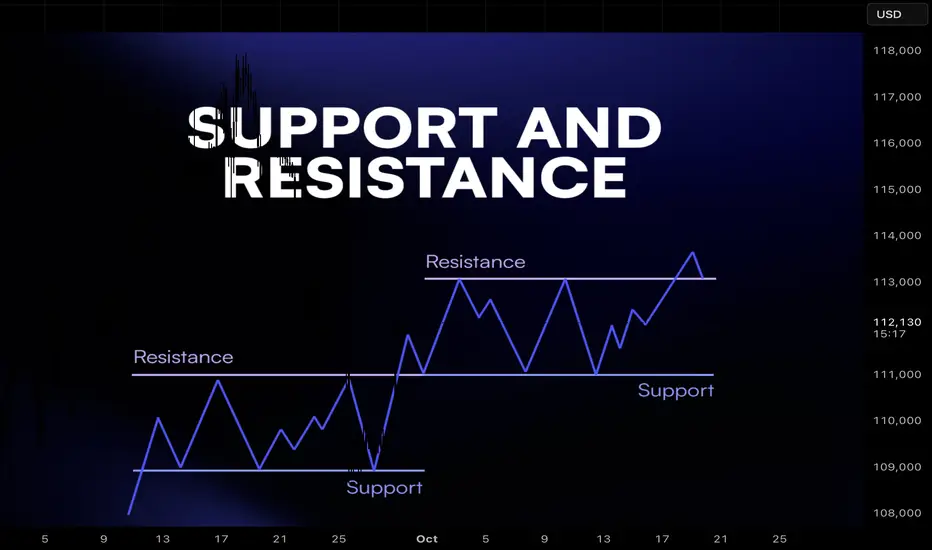
Support and Resistance in Crypto: Why They Work1. Introduction
Every trader has heard of support and resistance. They are the most common levels drawn on charts, and for good reason: markets consistently react to them.
But what makes these levels so powerful? Why do millions of traders watch them and why does price often respect them?
Support and resistance are not magic. They are simply psychological levels, supply and demand zones, and self-fulfilling expectations all converging.
2. Defining Support and Resistance
Support: A price level where demand is strong enough to stop price from falling further. Traders buy here, creating a “floor.”
Resistance: A price level where selling pressure outweighs demand, stopping price from rising further. Traders sell here, creating a “ceiling.”
Think of them as zones, not exact lines. Markets are messy, and price often wicks through before reacting.
3. Why They Work: The Psychology
Support and resistance function because traders remember these levels:
Fear & Greed: Traders who missed buying at support wait for price to return. Sellers at resistance wait to “get out at breakeven.”
Anchoring: Once a level has reacted multiple times, more traders trust it.
Stop Placement: Traders often put stop losses beyond support/resistance, creating liquidity pools that attract price.
In short: these levels represent collective memory of the market.
4. The Supply and Demand Connection
Behind every level is a simple truth: markets move because of imbalances.
At support, buyers step in, creating excess demand.
At resistance, sellers dominate, creating excess supply.
5. Types of Support and Resistance
Not all levels are created equal. Common ones include:
Horizontal Levels – obvious highs/lows on the chart.
Trendlines – diagonal support/resistance following direction of trend.
Moving Averages – dynamic levels that act as support in uptrends and resistance in downtrends.
Psychological Round Numbers – like $1,000 or $2,000 on ETH, where traders naturally cluster orders.
6. How Traders Use Them
Support and resistance are used in multiple ways:
Entries: Buying near support, selling near resistance.
Exits: Taking profit at resistance, cutting loss below support.
Stop Loss Placement: Stops often go just below support or above resistance.
Breakouts: When resistance breaks, it can turn into new support (and vice versa).
7. Limitations and Traps
Support and resistance are not invincible.
False Breakouts: Price can wick beyond levels to trigger stops before reversing.
Changing Market Conditions: A strong support can fail in a new trend.
Overcrowding: When everyone sees the same level, liquidity hunts occur.
Good traders combine S/R with confirmation, volume, candlestick signals, or broader market context.
8. Closing Thought
Support and resistance work because markets are driven by human behavior and collective memory. They reflect where buyers and sellers previously fought and where they are likely to fight again.
But the real edge isn’t just knowing the levels. It’s knowing how to act when price reaches them, and how to manage risk if they fail.
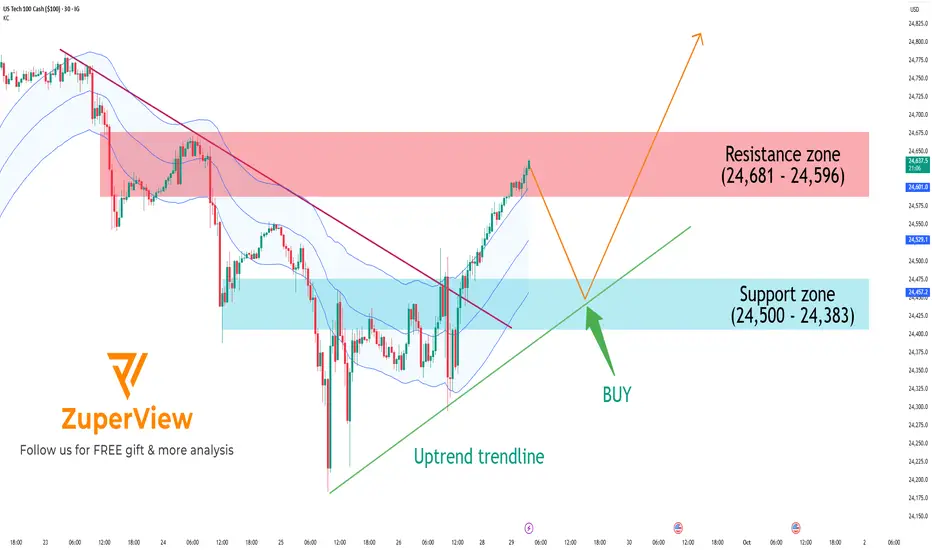
US100: Approaching resistance, pullback likely before breakoutThe IG:NASDAQ has shown a strong short-term recovery after breaking a major descending trendline. However, price is now testing a significant resistance zone, and a technical pullback is likely before the uptrend can continue.
📊 Technical Analysis: 30-minute Chart
📉 1. Overall Trend
Price has successfully broken above a descending trendline (red line), shifting market structure from bearish to bullish.
An uptrend line (green) is now acting as dynamic support.
Price is trading near the upper band of the Keltner Channel, indicating sustained bullish momentum.
🟥 2. Resistance Zone: 24,596 – 24,681
This zone has acted as a strong supply area in the past, causing multiple rejections.
Price is currently testing this area again → a rejection or short-term pullback is highly probable.
🟦 3. Support Zone: 24,383 – 24,500
This zone overlaps with previous consolidation and aligns with the uptrend line.
If a pullback occurs, this area could attract buyers and act as a launchpad for the next leg up.
🔁 Potential Trade Setups
✳️ Primary Scenario (preferred):
Price rejects at resistance → pulls back to support → bounces and resumes the uptrend
Wait for a pullback toward 24,500 – 24,383
Look for bullish price action (e.g., bullish engulfing, hammer) for entry
Enter long if support holds:
🎯 TP1: 24,650
🎯 TP2: 24,700+
🛑 SL: Below 24,350 (trendline invalidation)
🔻 Alternative Scenario (risk):
If price breaks below 24,383 and the uptrend line fails → short-term trend could shift sideways or bearish
Avoid long entries without a confirmed recovery
Re-evaluate trend structure if support fails
✅ Conclusion
A short-term uptrend is in place
However, price is now testing a major resistance zone, and a healthy pullback is likely
Please like and comment below to support our traders. Your reactions will motivate us to do more analysis in the future 🙏✨
XAUUSD - RETEST STRATEGY On the 1-hour timeframe Gold is currently showing a clear bullish structure supported by both trendline support and a recent breakout above resistance. For several sessions, price has been forming higher lows along the ascending trendline, showing consistent buyer strength. This upward momentum has now resulted in a breakout above the resistance zone around 3,780, which had previously acted as a ceiling for price action.
With this breakout, the market structure has shifted further in favor of the bulls. However, as is common after such moves, price may retest the broken resistance before continuing its upward journey. A retest of the 3,780–3,785 zone would be a healthy sign of market confirmation, turning old resistance into new support.
Trading Plan:
• Look for long entries on a clean retest of the 3,780–3,785 area.
• Maintain bullish bias as long as the price holds above the ascending trendline.
• Target levels point toward 3,824, which represents the next potential resistance/price objective.
Risk Management:
A stop-loss can be placed just below the retest zone or under the ascending trendline to protect against false breakouts. Always size positions according to your risk tolerance.

S&P 500: Pullback after flash dump is a Short opportunity
📝 1. Market Context
BLUEBERRY:SP500 recently witnessed a sharp drop from 6,698 down to 6,645, showing clear bearish momentum. After this fall, the index attempted a recovery, but the bounce was weak: green candles became smaller and stalled right at key resistance zones. A long red bearish engulfing candle then erased the entire recovery, proving sellers are back in control.
🟥 2. Static Resistance (Red Zone on Chart)
On the chart, the red zone represents static resistance, located around 6,671 – 6,664.62. This area aligns with:
• Dynamic resistance (moving averages).
• Static resistance (previous supply zone).
Every time price has tested this area, it faced rejection. This makes the red zone a high-probability level for sellers to step in again if price retests it.
🟩 3. Support Zone (Green Zone on Chart)
The nearest support lies at 6,639, highlighted as the green zone on the chart. This is the first logical downside target, where price might pause or react before choosing the next move.
🎯 4. Bearish Scenario
• Bias: Bearish continuation.
• Entry zone: 6,671 – 6,664.62 (red resistance zone).
• Target: 6,639 (blue support zone).
• Invalidation: If price closes firmly above 6,672, this bearish idea is no longer valid.
✅ 5. Summary
After a sharp decline, the weak bounce into resistance looks like an opportunity for sellers. As long as the index remains below the red resistance zone, the path of least resistance points lower, with 6,639 as the next key support to watch.
📈 Similar to the previous Buy setup, we can see that price is reacting in a similar manner — it touches the static support zone (marked in green) and the moving average (acting as dynamic resistance), before making a strong bounce.
Please like and comment below to support our traders. Your reactions will motivate us to do more analysis in the future 🙏✨

XAU/USD Intraday Plan | Support & Resistance to WatchGold is trading around $3,651, consolidating just under the $3,658 resistance after a strong bullish leg higher. Trend remains bullish above $3,617, but gold is testing key resistance. A breakout could fuel continuation, while rejection raises the risk of a short-term corrective pullback.
A clean break above $3,658 would confirm continuation, targeting $3,674, then $3,690, with an extended move toward $3,706.
On the downside, rejection from current resistance could see a pullback into $3,644, followed by $3,630 and the $3,617 zone. A decisive break below $3,594 would weaken the bullish bias and expose the $3,564 pullback zone.
📌Key Levels to Watch
Resistance:
$3,658
$3,674
$3,690
$3,706
Support:
$3,644
$3,630
$3,617
$3,594
$3,564

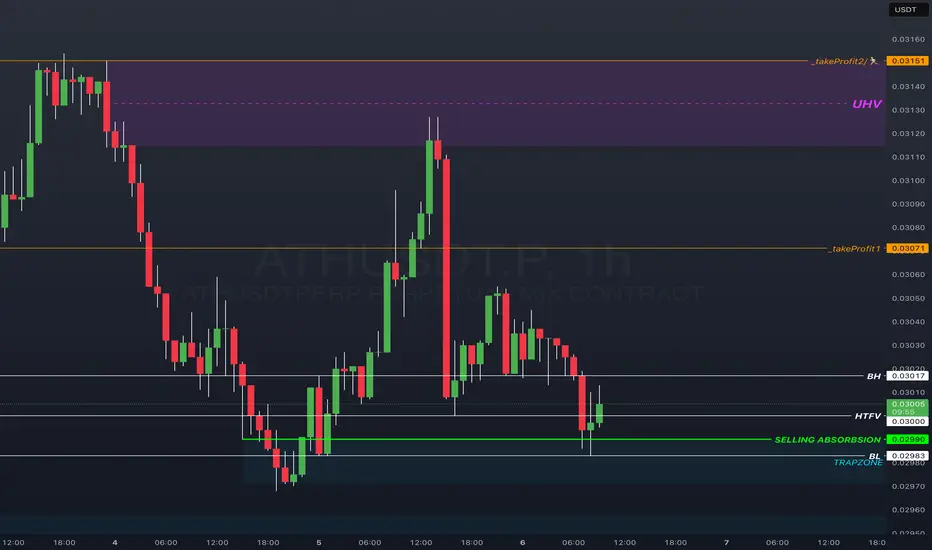
ATHUSDT.P – Trap Zone Absorption → Reversal | High-Timeframe ValBITGET:ATHUSDT.P
🕐 Timeframe: 1H
📊 Strategy: Trap Zone Reversal | Absorption + Delta Flip + HTF Value Reclaim
⸻
📘 CONTEXT:
We’re observing a reversal setup on the 1H chart of ATHUSDT.P (BitGet Mix Perpetual).
Price has recently swept a key trap zone and shown aggressive selling absorption near the lows. We’re now seeing reversal momentum building as price reclaims structure.
This follows a period of:
• Failed sell climaxes at the trap zone
• Absorption of aggressive sellers
• Re-entry above higher timeframe value (HTFV)
These are classic markers of a shift from distribution (short bias) into accumulation (long bias).
⸻
🔍 STRUCTURE BREAKDOWN:
• 🔲 Contraction Box High (BH): 0.03017
• 📉 Higher Timeframe Value (HTFV): 0.03006
• 💚 Trap Zone Absorption Level: 0.02990
• 🔵 Trap Zone Low: 0.02983 (Suggested stop-loss zone)
The chart also marks:
• 📈 Sell climaxes that failed to follow through
• 📉 Buy climaxes that have now been absorbed
This suggests wholesale price acceptance has shifted to the upside.
⸻
🎯 TRADE PLAN:
• Entry Zone: Around 0.02990
• Stop Loss: Below 0.02983 (trap zone low)
• Target 1: 0.03071 ✅ (Remove ~33% at this level)
• Target 2: 0.03151 ✅ (Remove ~90%, leave runners)
• Risk/Reward: Designed for a +5% move
• Execution Type: Reversal entry off structural sweep + absorption
⸻
🧠 NOTES ON INDICATORS:
This chart is deliberately stripped of indicators to maintain focus on raw structure and price behavior.
The following zones are marked visually:
• HTFV = Higher Timeframe Value area (drawn manually)
• Trap Zone = Where previous aggressive sellers are now trapped
• Absorption = Inferred from prior failed lows and clustering behavior
• No footprint data shown, but reversal pressure is visible through price structure alone
⸻
✅ TRADE STATUS:
📈 Active – Position Open
Monitoring structure for expansion continuation and scale-out levels.
XAGUSD Overextended: Watching 40.50 NecklineIn the past months I argued that Silver should rise and reach 40, and the market not only achieved that but even exceeded the level, printing a high at 41.50.
However, just like Gold, this move looks overextended and vulnerable to correction.
📌 Technically, price has tapped 41.50 twice. While it cannot yet be called a confirmed double top, the possibility exists. The neckline of this potential pattern is at 40.50.
• A break below 40.50 could trigger a deeper correction.
• First target: under 40, toward the 39 technical support zone.
🔑 Trading Plan: I remain cautious at these levels.
If 40.50 gives way, I will look for shorts targeting the 39 area. Counter-trend trades carry very high risk, but the setup is worth monitoring. 🚀

ETH/USD: Could $5,000 Be Just Around the Corner?Ethereum (ETH) is currently trading at $4,285, experiencing a slight decline from the previous close. Intraday, it reached a high of $4,474 and a low of $4,261. The $4,300–$4,400 range has been acting as a key support zone, and a breach below this could see ETH testing the $4,000 level, with the 50-day EMA providing additional support. Immediate resistance is observed around $4,530, and a successful breakout above this level could pave the way for a move towards $5,000.
Market sentiment shows the Relative Strength Index (RSI) approaching overbought territory, indicating potential for a short-term pullback. Significant institutional accumulation continues, with firms like BlackRock increasing their ETH holdings. The approval of Ethereum ETFs in the U.S. and Australia has led to increased investor participation, contributing to upward price pressure.
Short-term volatility is expected as ETH tests these key support and resistance levels. A breakout above $4,530 could signal a bullish continuation towards $5,000, while a drop below $4,000 may lead to further downside. Long-term prospects remain positive, supported by growing institutional interest and favorable market conditions.

ETH/USD: Will ETH Soar to $8,000 or Crash Below $4,000?As of September 3, 2025, Ethereum (ETH) is trading around $4,466 USD. The market is currently experiencing heightened volatility, influenced by both technical factors and broader macroeconomic developments. Ethereum reached a high of $4,954 in August before retracing to its current levels, suggesting a consolidation phase with key support around $4,200 and resistance near $4,650.
Technically, short-term trends suggest a bullish bias, but caution is advised due to recent fluctuations. The Relative Strength Index (RSI) is showing bearish divergence, indicating potential weakening momentum. A decisive breakout above $4,650 could push ETH toward $5,000, while a drop below $4,200 may lead to retesting the $4,000 support zone.
Investor sentiment is cautiously optimistic. Anticipation of potential Federal Reserve rate cuts in September has increased demand for risk assets like Ethereum. Additionally, the upcoming Fusaka upgrade is expected to enhance Ethereum's scalability and reduce transaction costs, further bolstering its appeal.
In the near term, Ethereum is likely to experience continued volatility. Traders should monitor the $4,200 support and $4,650 resistance levels closely. Looking ahead, Ethereum's long-term prospects remain strong. Analysts project that with sustained institutional interest and successful implementation of scalability upgrades, ETH could reach between $6,000 and $8,000 by the end of 2025.
Despite the optimistic outlook, Ethereum's price remains susceptible to broader market dynamics, including Bitcoin’s performance and macroeconomic factors. Investors should be prepared for potential fluctuations and consider these risks when making investment decisions. Overall, Ethereum’s market is at a pivotal point, and key technical levels and upcoming events will play a crucial role in determining its short-term trajectory.

ETH/USD: ETH on the Edge!ETH is currently trading around $4,390–$4,430 after a summer rally and a modest pullback, reflecting broader crypto weakness linked to shifting U.S. rate-cut expectations. Demand from spot ETH ETFs has been a key support factor, with inflows continuing steadily and several trackers reporting multi-billion-dollar monthly additions.
On-chain activity also remains robust, with DeFi TVL, daily transactions, and active addresses near 2025 highs, indicating that real usage underpins price action. The completion of the Pectra upgrade and upcoming scalability improvements further support medium-term confidence, while macro developments remain the main swing factor, as crypto reacts to Fed guidance and broader risk appetite.
Technically, $4,300–$4,350 provides immediate support, with deeper support at $4,150–$4,200, while resistance sits at $4,600, above which $4,950–$5,000 becomes achievable. In the next 2–6 weeks, ETH is likely to trade in a range of $4,200–$4,950, with ETF inflows and strong on-chain metrics cushioning dips, though a decisive close above $4,600 would open a run toward $4,900–$5,000, and a close below $4,300 risks probing $4,150–$4,200.
Into Q4, the outlook remains constructive but choppy, with potential to retest and break $5,000 if flows persist and macro conditions remain favorable. Key risks include a macro downside surprise, ETF outflows, and technical or regulatory setbacks.
Market participants should watch ETF flow prints, on-chain activity, and U.S. rates data, as these will heavily influence ETH price action. Overall, near-term trading likely remains choppy between $4,200 and $4,950, with $4,600 acting as pivotal resistance and $4,300 as immediate support, while ETF inflows and real usage favor buy-the-dip behavior, and macro developments will determine whether ETH can sustainably challenge $5,000.

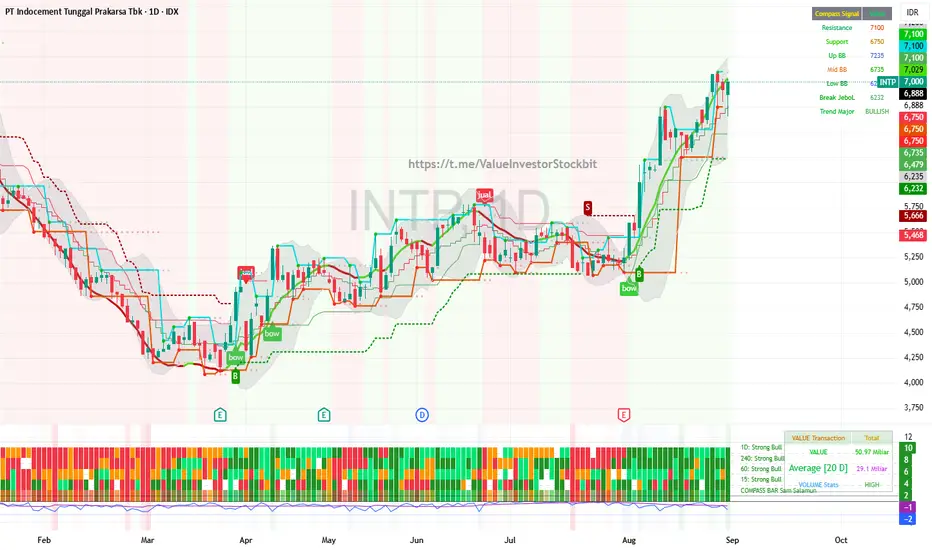
INTP masih strong bullish, stay HOLD sampai muncul signal sellINTP is still strongly bullish, stay HOLD until a sell signal appears.
For those who don't have one yet, consider an automatic buy in installments of 6650-6800
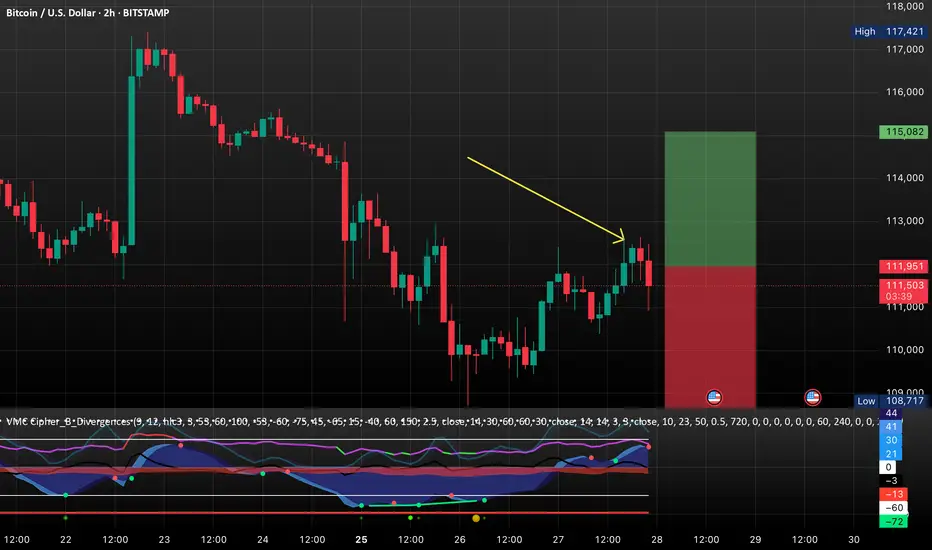
BTC/USD: Bitcoin Set to Explode?As of August 27, 2025, Bitcoin (BTC) is trading at approximately $111,612, reflecting a slight daily increase. The cryptocurrency market has experienced notable developments recently, influencing both short-term price movements and long-term trends.
The U.S. government's establishment of the Strategic Bitcoin Reserve in March 2025, under President Trump's executive order, has significantly impacted market sentiment. This move positions Bitcoin as a national reserve asset, with the U.S. Treasury holding an estimated 198,000 BTC. Such institutional adoption has bolstered investor confidence, contributing to Bitcoin's recent price surge to over $124,000 earlier this month...
Additionally, the rise of Bitcoin Treasury Companies (BTCs), such as MicroStrategy, which now holds around 630,000 BTC, has further reduced available supply on exchanges. Reports indicate that Bitcoin availability on exchanges fell below 15% in July 2025, a low not seen since 2018. This scarcity has intensified demand, driving prices higher.
Bitcoin is currently consolidating between the $112,000 and $115,000 levels. The 50-day exponential moving average (EMA) near $114,000 has acted as a resistance point, while support is observed around $110,000. A breakout above $115,000 could pave the way for a retest of the $120,000 to $125,000 range.
Conversely, a decline below $110,000 may lead to further downside, with potential support levels at $108,000 and $105,000. The Relative Strength Index (RSI) is hovering around 42, indicating that the market is not overbought, allowing room for upward movement.
*Bitcoin's market is currently characterized by strong institutional support, reduced supply on exchanges, and positive regulatory developments. While short-term fluctuations are possible, the overall trend points towards continued growth. Investors should monitor key support and resistance levels, as well as macroeconomic indicators, to navigate the evolving landscape effectively.
XAU/USD Intraday Plan | Support & Resistance to WatchGold is trading around $3,370 after the Asian session rally, which began with a manipulation-style dip lower, followed by a sharp bullish candle driving price into the $3,386 resistance. Price was rejected at this level and is now consolidating just above the $3,363 support.
Structure remains constructive as long as gold holds above $3,363, with both the 50MA (pink) and 200MA (green) starting to slope upward, providing short-term bullish momentum.
A clean break and hold above $3,386 would open the path toward $3,406 and potentially $3,422. On the downside, failure to defend $3,363 would expose the $3,347–$3,328 support zone, with deeper losses shifting focus back toward the Secondary Support Zone ($3,304–$3,281).
📌 Key Levels to Watch
Resistance:
$3,386
$3,406
$3,422
Support:
$3,363
$3,347
$3,328
$3,304
$3,281
🔎 Fundamental Focus – Tuesday, Aug 26
Key events today: Durable Goods Orders, Consumer Confidence, Richmond Manufacturing Index, plus FOMC speakers. Data may drive volatility in gold.
⚠️ Expect intraday swings — manage risk and wait for confirmation.

Silver’s Roadmap: Support at 37, Eyes on 451. What happened last week
As I mentioned in previous analyses, Silver is more bullish than Gold. Last week confirmed this view once again: the dip from 37 was quickly absorbed by buyers, showing strong demand. On the weekly chart (left), the reversal from the lows printed a clear bullish engulfing candle, while on the daily chart (right), the bounce shaped a classic three white soldiers pattern.
2. Key resistance and current challenge
Friday’s advance, however, stalled exactly at the resistance zone around 39, an area defined by the high from previous months. This makes 39 the immediate hurdle for bulls. Without a clean breakout above this zone, the risk of another short-term pullback remains.
3. Bigger picture outlook
Looking further ahead, many traders might see a move toward 45 as “stretched,” considering it implies a rally of nearly 6000 pips from here. But in percentage terms, that’s only about 15%, which is well within Silver’s historical volatility. In fact, such moves are not unusual for Silver market when momentum builds.
4. Trading plan
With this in mind, as long as the 37 level holds as support, the strategy remains to buy dips into weakness. A decisive break above 39 would provide confirmation for continuation, opening the door toward the 45 target area.
5. Final note
Silver continues to show relative strength compared to Gold. The technical picture is bullish, the levels are well-defined, and the price action is clean. Now the market simply needs confirmation above resistance.
Disclosure: I am part of TradeNation's Influencer program and receive a monthly fee for using their TradingView charts in my analyses and educational articles.

ETH/USD: Could $ETH Hit $7,000 by Year-End?As of August 25, 2025, Ethereum (ETH) is trading at approximately $4,795.60, showing a steady upward trajectory since early August. This bullish momentum is supported by several key factors, including institutional interest, ETF inflows, and the ongoing strength of decentralized finance (DeFi) applications.
ETH has recently surpassed the $4,750 resistance level, indicating a potential move towards the $5,000–$5,200 range. The next significant resistance is around $5,000, which, if broken, could pave the way for a retest of the all-time high near $5,200. Conversely, support levels are found at $4,700 and $4,600–$4,400. A drop below $4,600 could signal a short-term pullback.
Ethereum's recent price surge is attributed to increased institutional demand, particularly following the launch of Ethereum ETFs, which have attracted significant capital inflows. Additionally, the Ethereum network's upgrades and the growing adoption of Layer 2 solutions have enhanced scalability and reduced transaction costs, further bolstering investor confidence.
Outlook for Q4 2025
Looking ahead, if ETH maintains its current trajectory and breaks through the $5,200 resistance, it could target the $6,000–$7,000 range by the end of the year. However, market volatility remains a factor, and investors should be prepared for potential fluctuations.
*Ethereum's current bullish trend is supported by strong technical indicators and positive fundamental developments. While the path to new all-time highs appears promising, it's crucial for investors to monitor key support and resistance levels and remain cautious of market volatility.

ETH/USD: Could ETH Surge Past $5,000 This Week?Over the next seven days, Ethereum (ETH) is projected to experience moderate bullish momentum, potentially reaching a price range between $4,800 and $5,000.
Currently, ETH is trading at approximately $4,852.49, reflecting a recent uptick of 14.33%. This positive movement is attributed to favorable macroeconomic indicators, including expectations of an interest rate cut by the U.S. Federal Reserve, which has historically supported risk assets like cryptocurrencies.
Technical analysis suggests that ETH is trading above key support levels and is approaching resistance zones. If the price breaks through these resistance levels, it could pave the way for further gains. Conversely, a failure to maintain upward momentum may lead to a consolidation phase or a slight pullback.
Market sentiment remains cautiously optimistic, with institutional interest continuing to grow. However, investors should remain vigilant, as the cryptocurrency market is known for its volatility and susceptibility to sudden shifts in sentiment.
In summary, ETH is poised for potential gains over the next week, but market participants should stay informed and prepared for any unforeseen developments that could impact price movements.

ETH/USD: Will ETH Crash Back to $3,800?Ethereum has demonstrated a strong bullish trend in August, with prices approaching key resistance levels. Analysts suggest that a sustained break above $4,800 could propel ETH toward $5,500–$6,000 by the end of the month.
Institutional interest remains robust, with significant inflows into Ethereum-based ETFs and increased holdings by digital asset treasury firms like Bitmine Immersion Technologies and Sharplink Gaming.
* Resistance Levels: $4,800, $5,000, $5,500
* Support Levels: $4,000, $3,800
* Key Indicators: Strong Relative Strength Index (RSI) and bullish Moving Average Convergence Divergence (MACD) suggest continued upward momentum.
Ethereum is poised for a potential breakout. A decisive move above $4,800, supported by strong trading volumes, could initiate a rally toward $5,500–$6,000. Conversely, a drop below $4,000 might lead to a retest of the $3,800 support zone.

GBP/NZD POTENTIONAL SHORT OPPORTUNITYThis is an idea for GBPNZD's potential short opportunity based on what the technicals indicate.
The trend has been emphasising its bullish approach for almost three years.
Price respected almost 11 times due to the strong resistance within 150 days between 2.265 & 2.275 and bounced off bullish OB on the daily chart and FVG on the weekly chart.
An institutional sharp decline on the weekly chart, followed by a clear wedge, can support a further drop once swept by bearish daily OB. A breakout to the micro wedge (orange) within a macro wedge can also help further down move.
Given that a bearish pin bar followed by a bearish doji is a strong warning signal of potential reversal or bearish continuation that appears inside the micro wedge.
TP1 is considered the first support at the bottom, where the daily OB and the weekly FVG meet at around 2.22000 or the area close to the trendline. If the price breaks through the trendline, TP2 and TP3 will be expected to be achieved.
TP2 may be located at the micro accumulation around 2.20000, and TP3 at the following major support around 2.15000-2.17000 that previously acted as both support and resistance.
Good luck and have a great weekend.
