HYPE | Sweep & Reclaim SetupPlan:
Watching for a sweep into the blue H4 Untapped Demand zone, then a reclaim of 41.237 (green line) to add longs.
Ideal target: new ATH and 55 extension.
If the blue zone fails or we can't reclaim 41.237, risk-off mode: equal lows at 30.6 could be the draw.
Reasoning:
A sweep into demand would reset local liquidity and trap late shorts.
Reclaiming 41.237 confirms a shift in momentum and invalidates the breakdown.
Structure is bullish above 41.237; below, risk increases for deeper downside.
Sweep

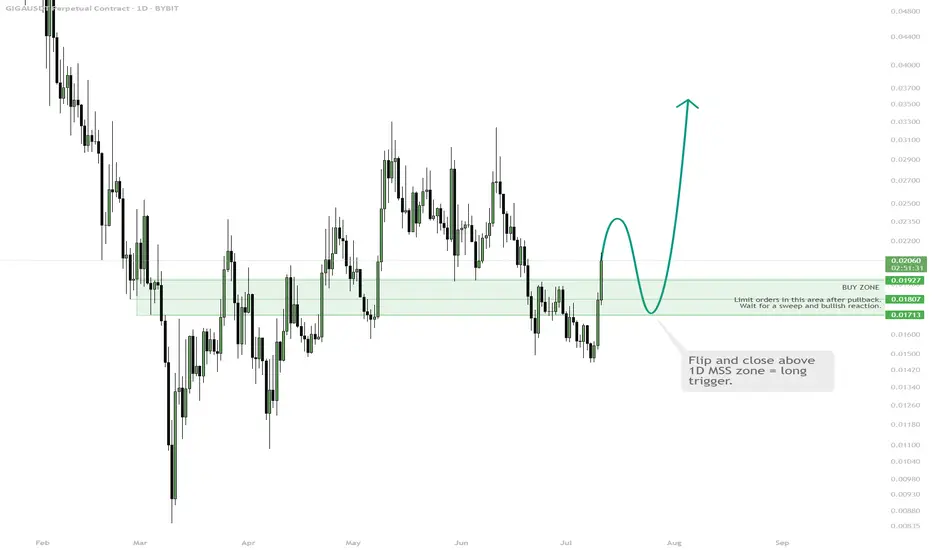
GIGA | Watch for 1D MSS Flip & Long TriggerBUY ZONE $0.0175–0.0192 — wait for pullback, enter on bullish signal.
TRIGGER: Flip and hold above 1D MSS zone.
STOP: Close below $0.0171 = exit.
TP: $0.025 / $0.03 — take profit on move up.
Wait for the break and flip above 1D MSS, then enter long on confirmation. Avoid early entry — only buy after a clear signal. Fix part of profit at resistance.
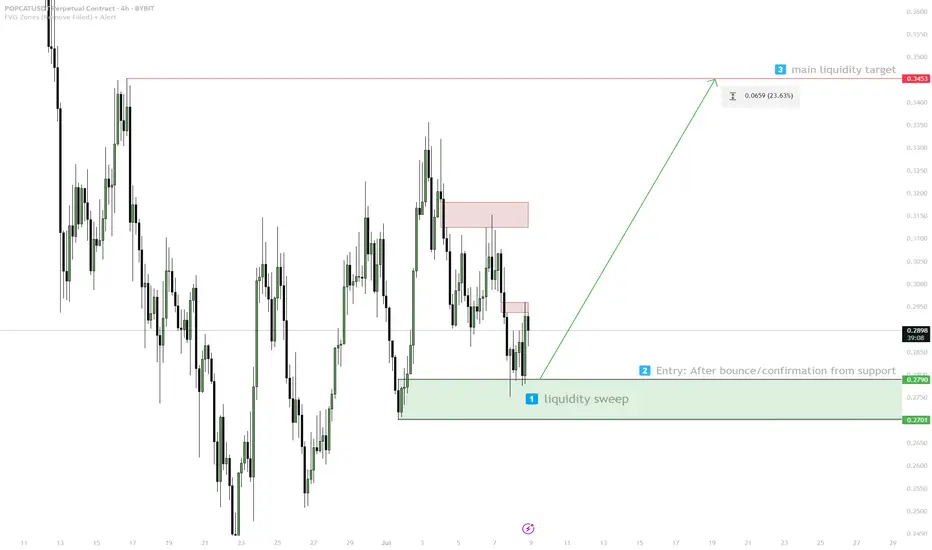
POPCAT — Liquidity Target Play1. Watch for sweep/liquidity grab in 0.270–0.279
2. Enter on confirmed bounce
3. Target: 0.3453 (liquidity zone)
4. Stop: below 0.270 — invalid
Sonic (FTM) — RR Sweep & Accumulation Setup1. Wait for full sweep of weak lows (target $0.15)
2. Enter long only after reclaim above support zone
3. Macro target: $3.47+
4. If no strong low or reclaim, stay flat

SOL — Liquidity Sweep & Demand Play1. Wait for price to sweep into demand
2. Enter long on SFP or strong bounce
3. Target: 240+
4. Stop: below demand zone
If no sweep, stay flat or wait for clear reclaim

GBPUSD sweep of lowGBPUSD sweep of low reclaim of low and respecting liquidity aree take to weekly high cautiously after that short of lifetime

CHILLGUY Breaking Out — Rotating Gains Into Next Meme Runner🎯 Trading Plan:
Watch for a sweep into the red box and LTF reclaim for spot entry
Targets: $0.117 (yearly high), then $0.129–$0.158 if strong momentum
Manual invalidation: 1D close below red box
🚨 Risk Warning:
No spot entry unless sweep/reclaim at supply zone
Exit if 1D candle closes below supply zone

BTC may going low after ATH?Weekly Analysis:
- Market to go higher , as last week's weekly candle was very bullish
- May sweep Weekly Buyside Liquidity
- May move bearish towards the Weekly FVG

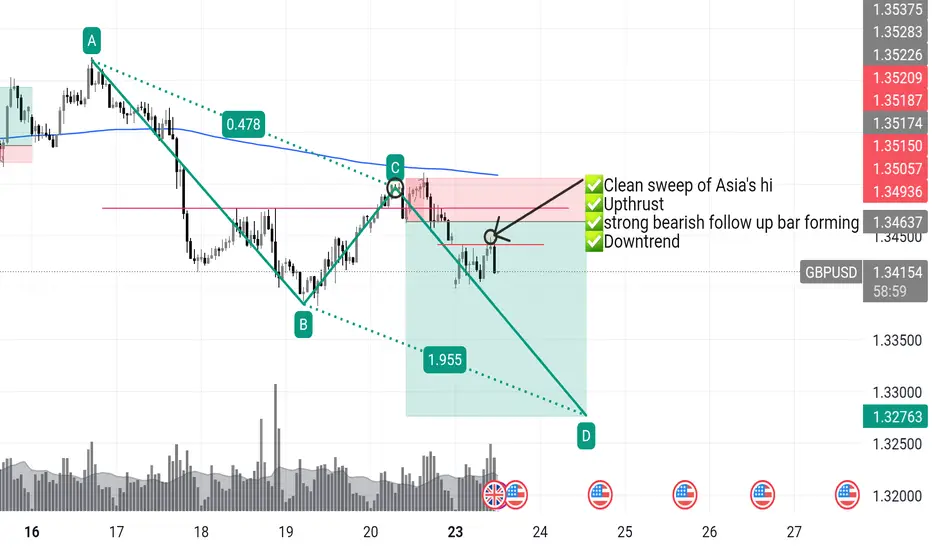
GBPUSD short re-entryGBPUSD – I Got Clipped. Now I’m Coming Back With Intent.
📅 Monday | June 23, 2025
Yes — I got stopped out. That’s execution, not failure.
Clean sweep of Asia’s high. Textbook.
Liquidity taken. Weak hands shaken. Now the real move can begin.
🔁 This 1H close is my greenlight for re-entry.
I don’t hesitate when the market gives me the same setup twice —
It’s still:
✅ Downtrend dominant
✅ Upthrust confirmed
✅ Sellers stepping back in
✅ Price under key rejection zone
If this bar closes bearish, I’m short again — this time with full intent.
📉 Target: 3r+ and beyond
🔥 London
EUR/USD - Daily highs taken, now what?Introduction
The EUR/USD made a strong move higher today, establishing a clear uptrend on the 4-hour chart. With this latest push, it swept the daily liquidity above the previous high. The question now is whether the EUR/USD will continue moving higher or if there are opportunities for long entries at lower levels.
Liquidity Sweep
EUR/USD has taken out liquidity above the daily highs, where many stop losses are typically positioned. These stops have now been removed from the market. This area could potentially act as a support and resistance flip. However, if we see a 4-hour candle close below the previous daily high, further downside becomes likely.
Where Can We Look for Buys?
During the recent 4-hour move higher, significant progress was made. This upward movement created a daily Fair Value Gap (FVG) between $1.149 and $1.145. This FVG aligns perfectly with the golden pocket Fibonacci level, drawn from the swing low to the swing high. As a result, this zone forms a strong area of confluence for potential buy positions to target a retest of the highs.
Conclusion
Although we are currently breaking above the previous high, this move has yet to be confirmed as sustainable. Holding above this level is crucial. If a 4-hour candle closes below the previous high, it becomes likely that we will revisit the daily FVG and golden pocket Fibonacci zone.
Disclosure: I am part of Trade Nation's Influencer program and receive a monthly fee for using their TradingView charts in my analysis.
Thanks for your support.
- Make sure to follow me so you don't miss out on the next analysis!
- Drop a like and leave a comment!

TRADE ASSESSMENT: March 23 EuroUSD - LOSSwhen price has made a sweep and is making higher highs on the 15min, look for 1hr FVGs to rebalance. that's your narrative. then look for context and entry. (POC+OTE+FVG)
when price has made a sweep and is making higher highs on the 15min, look for 1hr FVGs to rebalancewhen price has made a sweep and is making higher highs on the 15min, look for 1hr FVGs to rebalancewhen price has made a sweep and is making higher highs on the 15min, look for 1hr FVGs to rebalancewhen price has made a sweep and is making higher highs on the 15min, look for 1hr FVGs to rebalancewhen price has made a sweep and is making higher highs on the 15min, look for 1hr FVGs to rebalancewhen price has made a sweep and is making higher highs on the 15min, look for 1hr FVGs to rebalancewhen price has made a sweep and is making higher highs on the 15min, look for 1hr FVGs to rebalance

Sell gold after 2950-65 sweepAfter a lot of bullish week, we may assist to an huge retracement.
I will take care about last week hight and assume there will be a bullish momentum to around 2960-65.
If this level is sustained it will probably go to the 3000.
If the 2960-65 level mark an huge sell off, this could lead us to the weekly retracement
Sell idea
Entry : ~2950-65
SL : 3% Risk
TP1 : 2920
TP2 : 2900
TP3 : 2880
TP4 : 2832

BTCUSDT Fresh Short Setup: Targeting Key Support Zones with SMC Description:
This trade setup presents a Bitcoin short opportunity on the 4H timeframe using the Smart Money Concepts (SMC) framework. After a significant reaction from the supply zone, Bitcoin's price structure aligns with bearish confluences, signaling potential downside. Additionally, external events, such as the recent announcement of China's AI application "DeepSeek," may have amplified market volatility, further supporting the setup.
Trade Setup:
Entry:
Between 103,300 and 104,500
Take-Profit Levels (TP):
101,897
99,825
97,565
95,208
Stop Loss (SL):
Above 105,975
Analysis and Confluences:
Market Structure:
Bitcoin remains in a bearish trend on the 4H timeframe, with consistent lower highs and lower lows.
Supply Zone:
The price is entering the 103.3k–104.5k supply zone, a key resistance area where sellers are expected to dominate.
Fibonacci Confluence:
This zone overlaps with the 0.618–0.786 Fibonacci retracement levels, a high-probability reversal area.
Liquidity Sweeps:
Liquidity above previous highs has been swept, leaving the path clear for potential downside.
Bearish Targets:
The targets align with previous demand zones and liquidity pools at 101,897, 99,825, 97,565, and 95,208.
Trade Plan:
Confirmation: Wait for bearish price action signals or smaller timeframe BOS (Break of Structure) within the supply zone before entering.
Risk Management: Adjust position size to keep risk within acceptable levels. After reaching TP1, move your stop loss to breakeven and secure partial profits.
Final Note: While bearish bias dominates, unexpected macroeconomic events can cause reversals, so use tight risk management.

BTCUSD | 1D SMC Short Setup with Refined SL and TargetsDescription:
This analysis identifies a high-probability short opportunity for BTCUSD on the 1D timeframe using the Smart Money Concepts (SMC) framework. The chart shows clear bearish confluences, including market structure, supply zones, liquidity levels, and Fibonacci retracement zones. I believe the current bullish momentum is merely a manipulation driven by inflation news and the upcoming Trump inauguration. Following these events, I anticipate a significant market correction. Here’s the detailed breakdown and trade plan:
Analysis:
Market Structure:
Break of Structure (BOS): Price has confirmed a bearish trend with BOS to the downside, signaling a continuation of lower highs and lower lows.
Trendline Resistance: A well-defined downward trendline indicates selling pressure, reinforcing the bearish bias.
Key Zones and Liquidity:
Supply Zone: Highlighted in purple at $102,000-$104,000 . This zone represents an area where strong selling previously occurred, creating an imbalance.
Golden Zone (Fibonacci Retracement): Located around $101,000-$103,000 , this area aligns with the 61.8%-78.6% retracement levels and offers a high-probability reversal opportunity.
Weak High: The high near $104,000 represents untapped liquidity, which smart money may target for a liquidity grab before reversing lower.
Equal Lows (EQL): Around $92,000 , these act as a bearish target where liquidity rests, aligning with the continuation of the bearish trend.
Confluences for Short Entry:
Price is approaching the supply zone and Fibonacci Golden Zone , indicating a potential reversal point.
The weak high may trigger a liquidity grab to entice buyers before sellers regain control.
Previous BOS and trendline resistance add further validation to the bearish bias.
Trade Plan:
Short Entry Setup:
Entry Zone: $102,000-$104,000 (inside the supply zone and Golden Zone).
Stop Loss (SL): $105,500 (above the supply zone and imbalance to account for liquidity grabs).
Take Profit Levels:
TP1: $97,000 – Close partial profits at this imbalance mitigation level.
TP2: $92,000 – Target the equal lows and resting liquidity.
TP3: $88,000 – Final target near the blue demand zone for maximum reward.
Risk-Reward Ratio:
With the entry at $103,000 (midpoint of supply), SL at $105,500, and TP at $92,000, the trade offers a 1:4 RR or better, depending on execution and scaling.
Additional Notes:
Monitor the price action closely as BTC approaches the supply zone for confirmation, such as bearish candlestick patterns or lower timeframe CHoCH (Change of Character).
Scaling into the trade in smaller portions across the supply zone can improve overall entry precision.
Adjust stop loss or take profit levels as market conditions evolve

09:30 Liquidity sweep 09:30 liquidity sweep that was build starting from end of Tokyo session.
very fast bull run until Tokyo session top that need to be caught very fast .. ia actually enter at the bottom where i saw a smt with ES.

Gold long oportunity on 15mGold in 15m sweeped its ENG liquidity and made a sub-minor ChoCh , also Gold sweeped previouse day candle's low , so I expect it rise to see major structure's high at 2531.765 .
This is not a financial advice and its just my own oponion, DYOR.

Bitcoin: Monthly Candlesticks Mean A lot ! Bitcoin's price action has a strong historical correlation with monthly candlesticks. This means that breakouts or breakdowns of key levels on monthly candlesticks often signal significant directional shifts in price. This phenomenon can be attributed to several factors:
Psychological Significance: Monthly candlesticks represent a longer time frame and carry more psychological weight for traders. Breakouts or breakdowns of these levels can trigger a cascade of buying or selling activity, amplifying the price movement.
Swing Trader Stop-Losses: Swing traders often place stop-loss orders below or above key support and resistance levels on monthly candlesticks. These stop-losses act as liquidity pools, fueling the price move once triggered.
Market Cycle Alignment: Monthly candlesticks align with the natural cycles of the cryptocurrency market, often marking turning points in bull and bear market phases.
Bitcoin's Monthly Breakout in March 2023:
In March 2023, Bitcoin experienced a significant breakout above the key monthly resistance level of $46,000. This breakout signaled a potential shift in trend from a bearish to a bullish phase. The breakout also triggered a cascade of stop-loss orders from swing traders who had been expecting a continuation of the bearish trend.
Anticipating a Retest and Reversal in April 2024:
Based on Bitcoin's historical tendency to respect monthly candlesticks, I anticipate a retest of the March 2023 high ($58,000) in April 2024. This retest could lead to a liquidity sweep at the $58,000 level, followed by a sharp reversal and continuation of the uptrend.
Technical Analysis:
Bitcoin's daily chart shows a bullish ascending triangle pattern, indicating a period of price consolidation and building tension. The recent breakout above the trendline suggests a continuation of the uptrend.
Conclusion:
Bitcoin's price action has a strong correlation with monthly candlesticks. Breakouts or breakdowns of key levels on monthly candlesticks often signal significant directional shifts in price. Based on historical patterns and current technical analysis, I anticipate a retest of the March 2024 low($58,000) in April 2024, followed by a liquidity sweep and a continuation of the uptrend.

ARB is about to sweep???I think that we could see the pump today!!!
Are you ready to make some cash???
Personally I took over half my money out of my exchange and am playing with smaller stacks.
If the cycle is over we could be seeing some solid pain. I think most of the cryptos have 1 week remaining in this cycle.
BE SAFE!! TAKE SOME PROFIT!!
NOT FINANCIAL ADVICE!!!

BAD TIME FOR ALT's - BTS IS TOO STRONGAlgorand (ALGO) and Bitcoin (BTC), two prominent cryptocurrencies, recently exhibited interesting price movements within horizontal accumulations, followed by manipulation maneuvers beneath the range. Despite similarities in their actions, the market reactions varied significantly. This article explores the comparative analysis of ALGO and BTC, highlighting their respective behaviors and offering insights into potential trading strategies.
🔄 Horizontal Accumulation and Liquidity Grab:
Both ALGO and BTC were trading within horizontal accumulation ranges, indicating a period of indecision and consolidation. In a notable parallel, both cryptocurrencies executed a manipulation maneuver by removing liquidity from the lower part of the range. This tactic involves triggering stop-loss orders and creating favorable conditions for potential price movements.
📉 ALGO's Limited Reaction:
Despite the liquidity grab, ALGO demonstrated a relatively muted response. The price exhibited minimal bullish momentum, and the overall market sentiment did not reflect a strong surge. This could be attributed to factors such as market participants' cautious approach or a subdued reaction to the manipulation.
🚀 BTC's Strong Reversal:
In contrast, Bitcoin showcased a robust response to the manipulation maneuver. Following the liquidity grab, BTC experienced a significant pump, indicating strong buying interest and a bullish reversal. This demonstrated the resilience of Bitcoin and its ability to recover swiftly from manipulation-induced fluctuations.
🔍 Focusing on Bitcoin Strength:
The divergent reactions of ALGO and BTC suggest that, at the current juncture, Bitcoin is exhibiting greater strength and responsiveness to market dynamics. Traders and investors may find it prudent to focus on Bitcoin trading opportunities while it continues to showcase robust performance.
💡 Trading Strategy:
Considering the strength displayed by Bitcoin, traders may prioritize BTC trades over ALGO at the moment. Monitoring key support and resistance levels, analyzing volume patterns, and adapting strategies to Bitcoin's dynamic movements can be essential for successful trading.
🔮 Future Outlook:
The comparative analysis highlights the importance of assessing individual cryptocurrency behaviors in response to market events. While ALGO may present opportunities in the future, the current focus on Bitcoin, given its strength, could prove beneficial. Market conditions evolve, and traders should remain adaptable to capitalize on potential opportunities as they arise. A careful observation of Bitcoin's performance can serve as a strategic guide in navigating the cryptocurrency landscape.

🔗 LINK : Sweeping Low to PUMP HARDER ! Chainlink (LINK) has been navigating a consolidation phase within a well-defined range since November 11. This prolonged period of price equilibrium suggests a process of accumulation and distribution. Notably, the market exhibited intriguing behavior during this time, executing two distinct liquidity sweeps above the upper boundary of the range.
📊 Range-Bound Dynamics:
The apparent range-bound behavior of LINK denotes a phase of indecision and equilibrium in the market. Such periods are often indicative of participants accumulating positions and preparing for a potential directional move.
🔄 Liquidity Sweeps Analysis:
The tactical execution of two liquidity sweeps above the upper range boundary provides essential insights into the market's internal dynamics. These sweeps involve a deliberate move to trigger stop-loss orders, inducing short-term reactions. Understanding and interpreting these reactions become crucial in anticipating potential future price movements.
📈 Technical Insights:
🔄 Lower Liquidity Extraction:
Presently, the market is engaged in extracting liquidity from the lower end of the range. This involves a strategic move to trigger stop-loss orders, causing a cascade of selling pressure. Subsequently, there is a retest of critical support, potentially serving as a launchpad for a bullish continuation.
🚀 Anticipated Breakout Strategy:
🚀 Targeting $20 Resistance:
The strategic extraction of liquidity from the lower range sets the stage for a potential breakout. The next significant move is anticipated to be an upward surge, with the $20 resistance level being a key target.
📊 Tactical Considerations:
🛑 Understanding Range Dynamics:
Traders are advised to be vigilant regarding the nuances of range-bound behavior, utilizing this information for informed decision-making.
📈 Confirmation of Breakout:
A confirmation of the breakout will be established through sustained upward momentum, especially following a successful retest of crucial support levels.
📝 Conclusive Insights:
In the intricate landscape of Chainlink's recent market movements, characterized by meticulous range trading and calculated liquidity sweeps, the outlook suggests a potential breakout. Traders are encouraged to closely monitor unfolding developments, with a breakout beyond the $20 level signaling a transformative shift into a new bullish phase.
🚀 Unlock my 3 crypto trading indicators for FREE! 🚀

BLUR: Manipulative Moves ! 🌐📉🚀Today, let's cast our spotlight onto a fresh contender in the crypto arena—BLUR. Despite recently joining the Binance exchange, BLUR has wasted no time in showcasing its distinctive character, creating waves with its unconventional market behavior. Join me as we unveil the stealthy moves of this intriguing newcomer. 🔄💼
Deciphering BLUR's Market Dynamics:
New Kid on the Block:
Recent Binance Listing: BLUR has recently entered the illustrious realm of Binance, gaining attention for its unique market tactics.
Sweep of Low – Market Mastery:
Strategic Maneuver: BLUR employs a fascinating tactic known as the "sweep of low," a calculated move to capture liquidity at lower price levels.
Ruthless Efficiency: This maneuver can lead to swift market exits for unsuspecting participants, creating an environment where only the vigilant thrive.
Strategic Insights and Trading Considerations:
Market Caution:
Inherent Volatility: BLUR's market behavior suggests a level of volatility that demands caution.
Sharp Movements: Be prepared for sudden and sharp price movements, especially during and after a sweep of low.
Analyzing the Patterns:
Watchful Eye: Keep a watchful eye on BLUR's chart for patterns associated with liquidity sweeps and subsequent price surges.
Learning Opportunities: Understanding these patterns may present unique opportunities for traders who can navigate BLUR's market dynamics effectively.
Community Vigilance:
Stay Informed:
Community Awareness: Keep an ear to the ground within the BLUR community for insights and announcements.
Dynamic Market: The dynamic nature of BLUR's market requires continuous monitoring and adaptability.
Conclusion:
BLUR emerges as a unique and enigmatic player in the crypto space, showcasing unconventional strategies and market behavior. Traders and enthusiasts alike should approach BLUR with a discerning eye, appreciating the potential opportunities that arise from its distinctive moves.
May your crypto endeavors be as mysterious and rewarding as the journey with BLUR!
❗️Get my 3 crypto trading indicators for FREE! Link below🔑

VET's Manipulative Chart: Spotting Liquidity Sweeps for Profit!Today, let's unravel the intriguing dance of VeChain (VET), a coin that consistently orchestrates a substantial pump following a liquidity sweep. It's time to decode the manipulative ballet and learn how to use these maneuvers to our advantage! 🩰📈
VET's Manipulative Symphony:
Observing the Pattern:
Ritual: VET engages in a dance of liquidity sweeps, luring unsuspecting traders into its intricate moves.
Purpose: Each sweep creates a spectacle, shaking up the market and setting the stage for the next act.
Mastering the Sweep and Return:
Tactic: VET's modus operandi involves a sweep, swiftly grabbing liquidity, followed by an equally swift return to the prevailing trend.
Opportunity: Savvy traders can capitalize on this pattern by strategically entering the market after the liquidity has been snagged and the price retraces.
Navigating the VET Dance Floor:
Identification of Liquidity Clusters:
Key Skill: The ability to spot clusters of liquidity is paramount. These areas often become the focal points for VET's dance.
Timing the Entry:
Strategic Move: Enter the market after the liquidity sweep and subsequent retracement, aligning with the prevailing trend.
Caution: Beware of false signals; confirm the upward momentum post-sweep for a more secure entry.
The VET Advantage:
Consistent Performance:
VET's ability to consistently execute this manipulative ballet provides traders with recurring opportunities for profitable engagements.
Educational Reminder:
VET serves as a reminder that not all market moves are organic; understanding and adapting to manipulative strategies can be a valuable skill.
Conclusion:
VET's manipulative ballet is a spectacle worth studying for traders seeking an edge in the crypto market. By identifying liquidity sweeps and entering strategically, you can dance along with VET and turn its orchestrated moves into profitable performances.
May your trades be as graceful as VET's dance on the crypto stage!
❗️Get my 3 crypto trading indicators for FREE! Link below🔑

Sweep + Retest = Trend Change for DOGE 🔄💹 🌕 Hey Crypto Enthusiasts,
Let's delve into the recent journey of Dogecoin (DOGE), a coin that experienced a significant drop following manipulative actions on the daily timeframe. However, history seems to be repeating itself, with a twist – this time, we're gearing up for a bullish resurgence! 🔄💹
Unraveling the DOGE Story:
Manipulation Unveiled:
Scenario: DOGE encountered manipulation, evident in a swift sweep of a crucial level on the daily chart.
Outcome: The manipulated move led to a retest from below, signaling potential downside.
Echoes of the Past:
Parallels: Fast forward to the present, DOGE has replicated a similar pattern – a sweep from below and a subsequent retest.
Deviation: Unlike the previous instance, this time, the narrative is poised for an upward turn.
The Twists and Turns:
Manipulation's Impact:
Rapid sweeps followed by retests often create an environment of uncertainty, leading to sudden market shifts.
Resilience Unleashed:
DOGE's recent actions suggest a resilient comeback, defying the expectations set by the manipulation-induced drop.
Interpreting the Signs:
Sweep and Retest Dynamics:
Sweeps and retests can be both bearish and bullish signals, depending on the context and subsequent market behavior.
Market Sentiment Shift:
A shift from a bearish scenario to a potential bullish resurgence indicates the resilience and adaptability of DOGE.
Looking Ahead:
Bullish Anticipation:
The current setup hints at a bullish momentum, showcasing DOGE's ability to bounce back after challenging market conditions.
Monitoring Price Action:
Keep a close eye on price action post-retest, as it can offer insights into the strength and sustainability of the anticipated bullish move.
Conclusion:
DOGE's journey reflects the ebb and flow of the crypto market, where manipulation sets the stage for unexpected twists. As DOGE takes center stage again, the narrative shifts towards a resilient comeback, showcasing the coin's ability to navigate through market complexities.
Wishing you a prosperous journey with DOGE!
❗️Get my 3 crypto trading indicators for FREE! Link below🔑
