EURJPY Will Go Up! Buy!
Take a look at our analysis for EURJPY.
Time Frame: 1h
Current Trend: Bullish
Sentiment: Oversold (based on 7-period RSI)
Forecast: Bullish
The price is testing a key support 184.271.
Current market trend & oversold RSI makes me think that buyers will push the price. I will anticipate a bullish movement at least to 185.460 level.
P.S
The term oversold refers to a condition where an asset has traded lower in price and has the potential for a price bounce.
Overbought refers to market scenarios where the instrument is traded considerably higher than its fair value. Overvaluation is caused by market sentiments when there is positive news.
Like and subscribe and comment my ideas if you enjoy them!
Swing

GOLD Will Move Lower! Sell!
Please, check our technical outlook for GOLD.
Time Frame: 1h
Current Trend: Bearish
Sentiment: Overbought (based on 7-period RSI)
Forecast: Bearish
The market is trading around a solid horizontal structure 4,607.34.
The above observations make me that the market will inevitably achieve 4,577.45 level.
P.S
We determine oversold/overbought condition with RSI indicator.
When it drops below 30 - the market is considered to be oversold.
When it bounces above 70 - the market is considered to be overbought.
Like and subscribe and comment my ideas if you enjoy them!

EURAUD Will Go Up From Support! Long!
Please, check our technical outlook for EURAUD.
Time Frame: 4h
Current Trend: Bullish
Sentiment: Oversold (based on 7-period RSI)
Forecast: Bullish
The market is approaching a significant support area 1.732.
The underlined horizontal cluster clearly indicates a highly probable bullish movement with target 1.737 level.
P.S
Overbought describes a period of time where there has been a significant and consistent upward move in price over a period of time without much pullback.
Like and subscribe and comment my ideas if you enjoy them!

USDCHF Is Bearish! Short!
Here is our detailed technical review for USDCHF.
Time Frame: 4h
Current Trend: Bearish
Sentiment: Overbought (based on 7-period RSI)
Forecast: Bearish
The market is testing a major horizontal structure 0.801.
Taking into consideration the structure & trend analysis, I believe that the market will reach 0.798 level soon.
P.S
Overbought describes a period of time where there has been a significant and consistent upward move in price over a period of time without much pullback.
Like and subscribe and comment my ideas if you enjoy them!

USDJPY Is Very Bearish! Sell!
Take a look at our analysis for USDJPY.
Time Frame: 1h
Current Trend: Bearish
Sentiment: Overbought (based on 7-period RSI)
Forecast: Bearish
The market is approaching a key horizontal level 158.498.
Considering the today's price action, probabilities will be high to see a movement to 157.948.
P.S
Please, note that an oversold/overbought condition can last for a long time, and therefore being oversold/overbought doesn't mean a price rally will come soon, or at all.
Like and subscribe and comment my ideas if you enjoy them!

USOIL Is Going Down! Short!
Please, check our technical outlook for USOIL.
Time Frame: 4h
Current Trend: Bearish
Sentiment: Overbought (based on 7-period RSI)
Forecast: Bearish
The market is approaching a significant resistance area 61.732.
Due to the fact that we see a positive bearish reaction from the underlined area, I strongly believe that sellers will manage to push the price all the way down to 59.230 level.
P.S
The term oversold refers to a condition where an asset has traded lower in price and has the potential for a price bounce.
Overbought refers to market scenarios where the instrument is traded considerably higher than its fair value. Overvaluation is caused by market sentiments when there is positive news.
Like and subscribe and comment my ideas if you enjoy them!

CADJPY Will Grow! Long!
Here is our detailed technical review for CADJPY.
Time Frame: 4h
Current Trend: Bullish
Sentiment: Oversold (based on 7-period RSI)
Forecast: Bullish
The market is testing a major horizontal structure 113.497.
Taking into consideration the structure & trend analysis, I believe that the market will reach 114.033 level soon.
P.S
The term oversold refers to a condition where an asset has traded lower in price and has the potential for a price bounce.
Overbought refers to market scenarios where the instrument is traded considerably higher than its fair value. Overvaluation is caused by market sentiments when there is positive news.
Like and subscribe and comment my ideas if you enjoy them!

BITCOIN Will Go Higher From Support! Buy!
Take a look at our analysis for BITCOIN.
Time Frame: 1h
Current Trend: Bullish
Sentiment: Oversold (based on 7-period RSI)
Forecast: Bullish
The market is approaching a key horizontal level 94,951.39.
Considering the today's price action, probabilities will be high to see a movement to 96,189.10.
P.S
We determine oversold/overbought condition with RSI indicator.
When it drops below 30 - the market is considered to be oversold.
When it bounces above 70 - the market is considered to be overbought.
Like and subscribe and comment my ideas if you enjoy them!

HPQ | Wrong Memories, Right Support & P/E IS DANG LOWNYSE:HPQ
Remember the good ol' days?
Cornucopias on your tightie whities label...
Beren stein Bears...
A shiny new HP desktop delivered in a cow-patterned box...
WRONGGGGGGGGGGGGGGG
There never was a cornucopia on your fruit of the loom undies.
It is and always was the Beren STAIN Bears.
It was Gateway that delivered their product in cow-patterned boxes .
Stop living in the past. I have no idea what HP even does anymore. Stock looks like it's coming into some potential support. P/E is at 7.94.
Front-running with a small starter position. Add range? It's orbiting $18.60ish...
I'm not a financial advisor. I JUST LIEK THE STOCK.
THANK YOU FOR YOUR ATTENTION TO THIS MATTER

GBPCHF Will Go Lower! Short!
Here is our detailed technical review for GBPCHF.
Time Frame: 1h
Current Trend: Bearish
Sentiment: Overbought (based on 7-period RSI)
Forecast: Bearish
The market is on a crucial zone of supply 1.074.
The above-mentioned technicals clearly indicate the dominance of sellers on the market. I recommend shorting the instrument, aiming at 1.073 level.
P.S
Please, note that an oversold/overbought condition can last for a long time, and therefore being oversold/overbought doesn't mean a price rally will come soon, or at all.
Like and subscribe and comment my ideas if you enjoy them!

CADCHF Will Grow! Long!
Here is our detailed technical review for CADCHF.
Time Frame: 1h
Current Trend: Bullish
Sentiment: Oversold (based on 7-period RSI)
Forecast: Bullish
The market is on a crucial zone of demand 0.576.
The oversold market condition in a combination with key structure gives us a relatively strong bullish signal with goal 0.577 level.
P.S
We determine oversold/overbought condition with RSI indicator.
When it drops below 30 - the market is considered to be oversold.
When it bounces above 70 - the market is considered to be overbought.
Like and subscribe and comment my ideas if you enjoy them!

AUDJPY Will Go Lower From Resistance! Sell!
Take a look at our analysis for AUDJPY.
Time Frame: 4h
Current Trend: Bearish
Sentiment: Overbought (based on 7-period RSI)
Forecast: Bearish
The price is testing a key resistance 106.402.
Taking into consideration the current market trend & overbought RSI, chances will be high to see a bearish movement to the downside at least to 105.687 level.
P.S
Overbought describes a period of time where there has been a significant and consistent upward move in price over a period of time without much pullback.
Like and subscribe and comment my ideas if you enjoy them!

CADJPY Will Go Lower! Short!
Please, check our technical outlook for CADJPY.
Time Frame: 1h
Current Trend: Bearish
Sentiment: Overbought (based on 7-period RSI)
Forecast: Bearish
The market is trading around a solid horizontal structure 114.550.
The above observations make me that the market will inevitably achieve 114.248 level.
P.S
Please, note that an oversold/overbought condition can last for a long time, and therefore being oversold/overbought doesn't mean a price rally will come soon, or at all.
Like and subscribe and comment my ideas if you enjoy them!

NASDAQ (NAS100) – 15-Minute Timeframe Tradertilki AnalysisMy friends, greetings,
I have prepared a NASDAQ-NAS100 analysis for you.
My friends, if NAS100 reaches the levels of 25754.54-25731.54 on the 15-minute timeframe, I will open a buy position.
My target will be the 25905.40 level.
My friends, I share these analyses thanks to each like I receive from you. Your likes increase my motivation and encourage me to support you in this way.🙏✨
Thank you to all my friends who support me with their likes.❤️

GOLD Will Go Down! Sell!
Here is our detailed technical review for GOLD.
Time Frame: 4h
Current Trend: Bearish
Sentiment: Overbought (based on 7-period RSI)
Forecast: Bearish
The market is testing a major horizontal structure 4,609.41.
Taking into consideration the structure & trend analysis, I believe that the market will reach 4,502.66 level soon.
P.S
The term oversold refers to a condition where an asset has traded lower in price and has the potential for a price bounce.
Overbought refers to market scenarios where the instrument is traded considerably higher than its fair value. Overvaluation is caused by market sentiments when there is positive news.
Like and subscribe and comment my ideas if you enjoy them!

GBPAUD Will Move Lower! Short!
Take a look at our analysis for GBPAUD.
Time Frame: 1h
Current Trend: Bearish
Sentiment: Overbought (based on 7-period RSI)
Forecast: Bearish
The market is approaching a key horizontal level 2.011.
Considering the today's price action, probabilities will be high to see a movement to 2.006.
P.S
We determine oversold/overbought condition with RSI indicator.
When it drops below 30 - the market is considered to be oversold.
When it bounces above 70 - the market is considered to be overbought.
Like and subscribe and comment my ideas if you enjoy them!

EURGBP Is Bullish! Buy!
Please, check our technical outlook for EURGBP.
Time Frame: 4h
Current Trend: Bullish
Sentiment: Oversold (based on 7-period RSI)
Forecast: Bullish
The market is approaching a significant support area 0.865.
The underlined horizontal cluster clearly indicates a highly probable bullish movement with target 0.868 level.
P.S
Overbought describes a period of time where there has been a significant and consistent upward move in price over a period of time without much pullback.
Like and subscribe and comment my ideas if you enjoy them!

EURJPY Is Very Bearish! Sell!
Here is our detailed technical review for EURJPY.
Time Frame: 1h
Current Trend: Bearish
Sentiment: Overbought (based on 7-period RSI)
Forecast: Bearish
The market is on a crucial zone of supply 185.367.
The above-mentioned technicals clearly indicate the dominance of sellers on the market. I recommend shorting the instrument, aiming at 184.667 level.
P.S
Please, note that an oversold/overbought condition can last for a long time, and therefore being oversold/overbought doesn't mean a price rally will come soon, or at all.
Like and subscribe and comment my ideas if you enjoy them!

GBPCHF Is Very Bearish! Sell!
Here is our detailed technical review for GBPCHF.
Time Frame: 3h
Current Trend: Bearish
Sentiment: Overbought (based on 7-period RSI)
Forecast: Bearish
The market is testing a major horizontal structure 1.073.
Taking into consideration the structure & trend analysis, I believe that the market will reach 1.071 level soon.
P.S
The term oversold refers to a condition where an asset has traded lower in price and has the potential for a price bounce.
Overbought refers to market scenarios where the instrument is traded considerably higher than its fair value. Overvaluation is caused by market sentiments when there is positive news.
Like and subscribe and comment my ideas if you enjoy them!

AUDCHF Will Go Up From Support! Buy!
Take a look at our analysis for AUDCHF.
Time Frame: 1h
Current Trend: Bullish
Sentiment: Oversold (based on 7-period RSI)
Forecast: Bullish
The market is approaching a key horizontal level 0.533.
Considering the today's price action, probabilities will be high to see a movement to 0.534.
P.S
Please, note that an oversold/overbought condition can last for a long time, and therefore being oversold/overbought doesn't mean a price rally will come soon, or at all.
Like and subscribe and comment my ideas if you enjoy them!

NZDCHF Will Go Higher From Support! Long!
Here is our detailed technical review for NZDCHF.
Time Frame: 4h
Current Trend: Bullish
Sentiment: Oversold (based on 7-period RSI)
Forecast: Bullish
The market is testing a major horizontal structure 0.458.
Taking into consideration the structure & trend analysis, I believe that the market will reach 0.459 level soon.
P.S
Overbought describes a period of time where there has been a significant and consistent upward move in price over a period of time without much pullback.
Like and subscribe and comment my ideas if you enjoy them!

USD/CHF BEARS WILL DOMINATE THE MARKET|SHORT
USD/CHF SIGNAL
Trade Direction: short
Entry Level: 0.797
Target Level: 0.795
Stop Loss: 0.798
RISK PROFILE
Risk level: medium
Suggested risk: 1%
Timeframe: 1h
Disclosure: I am part of Trade Nation's Influencer program and receive a monthly fee for using their TradingView charts in my analysis.
✅LIKE AND COMMENT MY IDEAS✅

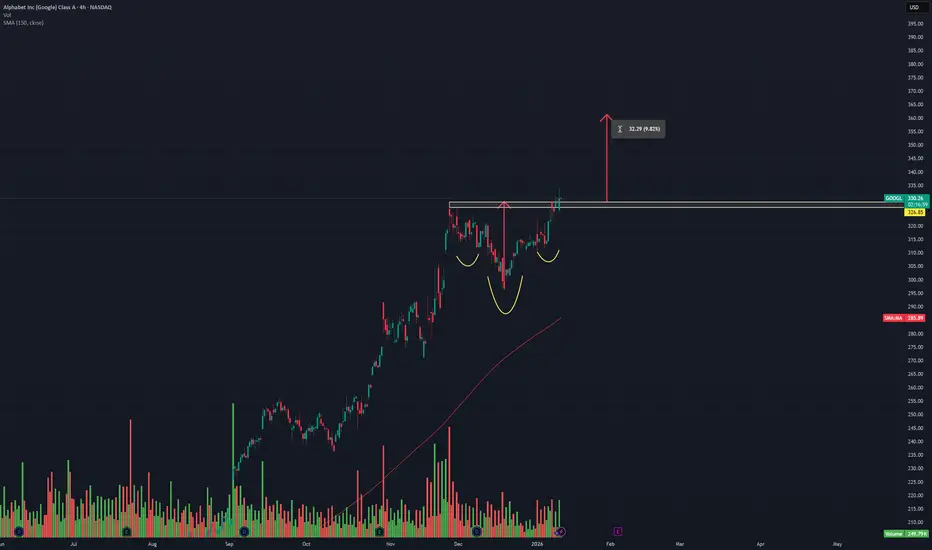
GOOGL Swing - Head & Shoulderson the 4H chart formed a Head and Shoulders formation passing a resistance area with more buyers than sellers
Upside can be the depth of the head which would equal to almost 10%