DXY Is Very Bullish! Buy!
Here is our detailed technical review for DXY.
Time Frame: 1D
Current Trend: Bullish
Sentiment: Oversold (based on 7-period RSI)
Forecast: Bullish
The market is on a crucial zone of demand 99.274.
The oversold market condition in a combination with key structure gives us a relatively strong bullish signal with goal 101.270 level.
P.S
Overbought describes a period of time where there has been a significant and consistent upward move in price over a period of time without much pullback.
Like and subscribe and comment my ideas if you enjoy them!
Swing

GOLD Is Going Up! Long!
Take a look at our analysis for GOLD.
Time Frame: 4h
Current Trend: Bullish
Sentiment: Oversold (based on 7-period RSI)
Forecast: Bullish
The price is testing a key support 4,087.79.
Current market trend & oversold RSI makes me think that buyers will push the price. I will anticipate a bullish movement at least to 4,161.33 level.
P.S
We determine oversold/overbought condition with RSI indicator.
When it drops below 30 - the market is considered to be oversold.
When it bounces above 70 - the market is considered to be overbought.
Like and subscribe and comment my ideas if you enjoy them!

TMB (Tamilnadu merca bank) right to enter for swing ??no, this is not right time to enter swing . as per my anlysis ,choch happened, after choch it need to colloect poi. my entry at 455 and sl at 424 and my target at 796..
all my analysis for educational purpose only

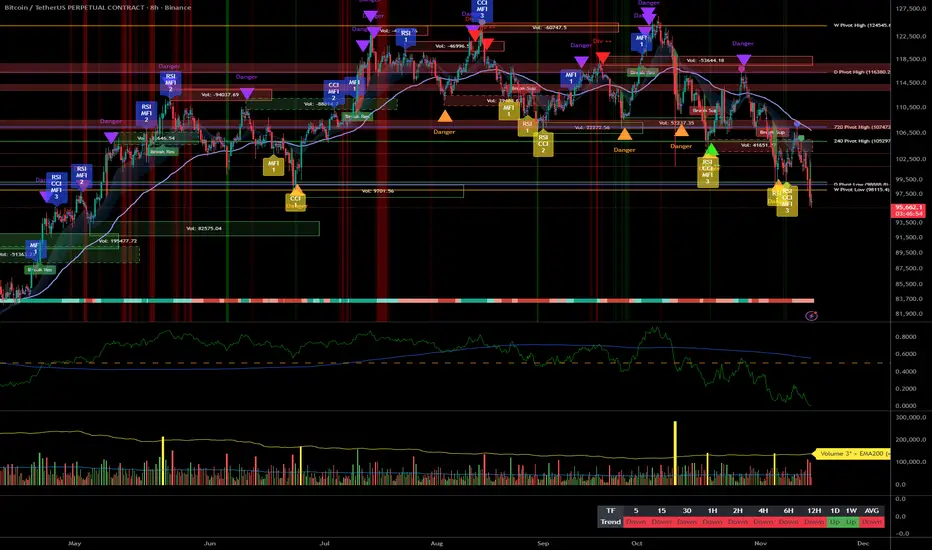
BTC at HTF Shelf: Execute Only on ≥2H Reversal__________________________________________________________________________________
Market Overview
__________________________________________________________________________________
Risk-off momentum drove Bitcoin into a dense multi-timeframe demand shelf, where price is probing for a reaction after losing 98k–100k. The next impulse likely comes from the battle around 95.8–95.9k and whether buyers can stage a clean reversal.
Momentum: Bearish drive into HTF demand; intraday trend remains down while daily is mixed-to-up in the background.
Key levels:
- Resistances (12H/1D): 97,300–98,200; 100,000; 101,600–103,000
- Supports (2H/4H/12H/1D): 95,820–95,920; 95,200–95,000; 92,000
Volumes: Very high on 12H and below (sell waves); normal on 1D — momentum is flow-driven, not a pure volume vacuum.
Multi-timeframe signals: 12H/6H/4H/2H/1H downtrends; 1D uptrend — execution should respect 12H Down unless ≥2H prints a confirmed reversal at 95.8–95.9k.
Harvest zones: 95,900 (Cluster A) / 95,000–95,200 (Cluster B) — ideal dip-buy zones for inverse pyramiding if a ≥2H reversal confirms.
Risk On / Risk Off Indicator context: Neutral Sell — confirms the risk-off push and argues for patience on longs unless the cluster defends with real follow-through.
__________________________________________________________________________________
Trading Playbook
__________________________________________________________________________________
We operate in a corrective, risk-off tape pressing into HTF demand; take a tactical stance and let ≥2H confirmation lead.
Global bias: Neutral Sell while under 98,000–100,000; key invalidation for shorts = reclaim and close above 98,000 with follow-through.
Opportunities:
- Buy: Only on a ≥2H bullish reversal from 95,800–95,900; target 96,600–97,000 then 97,800–98,200.
- Breakout: Reclaim >98,000 with momentum → ride into 100,000 then 101,600–103,000.
- Tactical sell: Fade failed retests at 97,800–98,200 or a ≥2H close below 95,800 with a failed retest.
Risk zones / invalidations: A sustained ≥2H close below 95,800 would invalidate the bounce idea and open 95,200–95,000, then 92,000.
Macro catalysts (Twitter, Perplexity, news): Heavy spot ETF outflows reinforce risk-off; global equities in broad risk-off; upcoming FOMC/CPI could shift dollar/liquidity and the crypto beta.
Harvest Plan (Inverse Pyramid):
- Palier 1 (12.5%): 95,900 (Cluster A) + reversal ≥2H → entry
- Palier 2 (+12.5%): 92,100–90,100 (-4/-6% below Palier 1)
- TP: 50% at +12–18% from PMP → recycle cash
- Runner: hold if break & hold first R HTF (97,800–98,200 zone)
- Invalidation: < HTF Pivot Low 95,000 or 96h no momentum
- Hedge (1x): Short first R HTF on rejection (97,800–98,200) + bearish trend → neutralize below R
__________________________________________________________________________________
Multi-Timeframe Insights
__________________________________________________________________________________
HTF uptrend (1D) conflicts with intraday downtrends, placing the burden of proof on buyers at the 95.8–95.9k shelf.
12H/6H/4H/2H/1H/30m/15m: Downtrends with very high sell-side volume; repeated tests of 95.8–95.9k raise risk of a flush if it fails, while failed breakdowns can spring sharp squeezes into 97.3–98.2k.
1D: Still up but losing momentum; the 95.8–96.0k cluster aligns with multiple prior pivot lows — a defendable shelf if buyers print a clean reversal and reclaim 97.8–98.2k.
Divergences/confluences: ISPD DIV = BUY at the cluster while Risk On / Risk Off Indicator = Neutral Sell — confluence for reactive bounces only, not blind catching; wait for ≥2H confirmation.
__________________________________________________________________________________
Macro & On-Chain Drivers
__________________________________________________________________________________
Macro risk-off and ETF outflows pressure BTC; the path hinges on whether flows stabilize and the 95.8–95.9k shelf holds.
Macro events: Global equities are risk-off; energy/geopolitics keep volatility elevated; upcoming FOMC/CPI loom as catalysts that can swing liquidity and risk appetite.
Bitcoin analysis: Breakdown below 100k with a six-month low near ~97k; weekly close vs ~101k is pivotal. Heavy ETF outflows and liquidations weigh unless key resistances are reclaimed.
On-chain data: Long-term holders have been distributing, but sellers show signs of exhaustion — a setup for relief if flows stabilize and levels reclaim.
Expected impact: If the shelf holds and outflows cool, a relief bounce toward 97.8–98.2k and 100k is likely; otherwise, a clean failure risks 95.0k then 92k.
__________________________________________________________________________________
Key Takeaways
__________________________________________________________________________________
We are in a corrective, high-volatility test of a dense demand cluster.
- Trend: Intraday bearish within a mixed HTF context; respect 12H Down unless ≥2H prints a clean reversal.
- Best setup: Reactive long only on a ≥2H reversal at 95.8–95.9k; otherwise fade failed retests at 97.8–98.2k.
- Macro factor: ETF outflows are the main headwind; watch FOMC/CPI for a regime nudge.
Stay patient, let the shelf prove itself, and treat each move like a boss fight — confirm the phase before committing.
BITCOIN Will Go Higher From Support! Long!
Here is our detailed technical review for BITCOIN.
Time Frame: 2h
Current Trend: Bullish
Sentiment: Oversold (based on 7-period RSI)
Forecast: Bullish
The market is testing a major horizontal structure 96,949.13.
Taking into consideration the structure & trend analysis, I believe that the market will reach 100,800.47 level soon.
P.S
We determine oversold/overbought condition with RSI indicator.
When it drops below 30 - the market is considered to be oversold.
When it bounces above 70 - the market is considered to be overbought.
Like and subscribe and comment my ideas if you enjoy them!

EURUSD Will Go Up From Support! Buy!
Take a look at our analysis for EURUSD.
Time Frame: 9h
Current Trend: Bullish
Sentiment: Oversold (based on 7-period RSI)
Forecast: Bullish
The market is approaching a key horizontal level 1.161.
Considering the today's price action, probabilities will be high to see a movement to 1.168.
P.S
Overbought describes a period of time where there has been a significant and consistent upward move in price over a period of time without much pullback.
Like and subscribe and comment my ideas if you enjoy them!

EURAUD Will Go Lower! Short!
Please, check our technical outlook for EURAUD.
Time Frame: 2h
Current Trend: Bearish
Sentiment: Overbought (based on 7-period RSI)
Forecast: Bearish
The market is approaching a significant resistance area 1.781.
Due to the fact that we see a positive bearish reaction from the underlined area, I strongly believe that sellers will manage to push the price all the way down to 1.773 level.
P.S
Please, note that an oversold/overbought condition can last for a long time, and therefore being oversold/overbought doesn't mean a price rally will come soon, or at all.
Like and subscribe and comment my ideas if you enjoy them!

AUDNZD Will Go Up! Long!
Here is our detailed technical review for AUDNZD.
Time Frame: 1h
Current Trend: Bullish
Sentiment: Oversold (based on 7-period RSI)
Forecast: Bullish
The market is on a crucial zone of demand 1.149.
The oversold market condition in a combination with key structure gives us a relatively strong bullish signal with goal 1.154 level.
P.S
The term oversold refers to a condition where an asset has traded lower in price and has the potential for a price bounce.
Overbought refers to market scenarios where the instrument is traded considerably higher than its fair value. Overvaluation is caused by market sentiments when there is positive news.
Like and subscribe and comment my ideas if you enjoy them!

GOLD Will Move Lower! Sell!
Take a look at our analysis for GOLD.
Time Frame: 1h
Current Trend: Bearish
Sentiment: Overbought (based on 7-period RSI)
Forecast: Bearish
The price is testing a key resistance 4,235.87.
Taking into consideration the current market trend & overbought RSI, chances will be high to see a bearish movement to the downside at least to 4,172.53 level.
P.S
We determine oversold/overbought condition with RSI indicator.
When it drops below 30 - the market is considered to be oversold.
When it bounces above 70 - the market is considered to be overbought.
Like and subscribe and comment my ideas if you enjoy them!

USD/JPY - Potential Sell offMy notes of this Pair:
USD/JPY – 1H Breakdown (Clean SMC Flow)
📌 1. Market Context
USD/JPY is still trading inside a bullish HTF structure, and the recent 1H movements are simply internal retracements inside that bullish leg.
The chart shows:
A clean sweep of sell-side liquidity (SSL)
A strong displacement candle upward
A bullish correction forming a ChoCH
Price now making its way back into 1H supply
This gives us a short-term bearish reaction expectation before continuation.
🟠 2. Liquidity Story
The liquidity is extremely clean here.
Sweeps Identified:
SSL at the low → swept
BSL inside internal structure → taken
Next meaningful target → External BSL above 155.00
So liquidity narrative:
👉 Sweep the lows → retrace → deliver up into higher BSLs.
Everything aligns with bullish continuation after the pullback.
⚪ 3. Pullback & Mitigation Zone
Price dipped into the 1H imbalance (IMB) and the 4H discounted zone (the grey block), tagging:
71% fib retracement
4H/1H overlap zone
Clear IMB at the origin
Lower liquidity (SSL) swept before tapping the zone
This is a textbook pullback.
Your chart marks this as the higher-low formation, which is valid given the sweep and BOS.
🧱 4. Current Structure
After the clean ChoCH to the upside, price has:
Printed a small BSL above current price
Begun climbing back into 1H supply
Rejected once, but maintaining bullish structure
Still holding HL → HH sequence
This means:
👉 The bearish push was corrective.
👉 Control is shifting back to buyers.
🎯 5. The Bullish Delivery Target
Your chart marks a clear upside objective:
🎯 External BSL @ ~155.05–155.10
This is the magnet for price.
Before that, the 1H supply zone (grey box) will be the first reaction point.
If supply holds briefly → expect pullback.
If supply breaks cleanly → straight shot to the BSL.
🔥 6. Likely Path (Based On Your Drawing)
Your projected arrow makes perfect sense:
Price taps into the 1H supply
Rejects slightly
Forms a deeper HL
Then pushes up to take the External BSL
This is the cleanest, most logical sequence.
📉 7. Trading Notes
Bias = Bullish
SSL swept → bullish
ChoCH confirmed → bullish
Pullback into 1H IMB → bullish
Next target → External BSL
The only invalidation would be a deep break below the SSL sweep, which would signal redistribution rather than accumulation.

AUDUSD Is Bearish! Short!
Please, check our technical outlook for AUDUSD.
Time Frame: 1D
Current Trend: Bearish
Sentiment: Overbought (based on 7-period RSI)
Forecast: Bearish
The market is trading around a solid horizontal structure 0.658.
The above observations make me that the market will inevitably achieve 0.641 level.
P.S
Overbought describes a period of time where there has been a significant and consistent upward move in price over a period of time without much pullback.
Like and subscribe and comment my ideas if you enjoy them!

USDCHF Is Very Bullish! Buy!
Here is our detailed technical review for USDCHF.
Time Frame: 1D
Current Trend: Bullish
Sentiment: Oversold (based on 7-period RSI)
Forecast: Bullish
The market is testing a major horizontal structure 0.795.
Taking into consideration the structure & trend analysis, I believe that the market will reach 0.806 level soon.
P.S
Please, note that an oversold/overbought condition can last for a long time, and therefore being oversold/overbought doesn't mean a price rally will come soon, or at all.
Like and subscribe and comment my ideas if you enjoy them!

GBPCHF Is Going Down! Sell!
Take a look at our analysis for GBPCHF.
Time Frame: 30m
Current Trend: Bearish
Sentiment: Overbought (based on 7-period RSI)
Forecast: Bearish
The market is approaching a key horizontal level 1.045.
Considering the today's price action, probabilities will be high to see a movement to 1.043.
P.S
The term oversold refers to a condition where an asset has traded lower in price and has the potential for a price bounce.
Overbought refers to market scenarios where the instrument is traded considerably higher than its fair value. Overvaluation is caused by market sentiments when there is positive news.
Like and subscribe and comment my ideas if you enjoy them!

USOIL Will Grow! Long!
Please, check our technical outlook for USOIL.
Time Frame: 1D
Current Trend: Bullish
Sentiment: Oversold (based on 7-period RSI)
Forecast: Bullish
The market is approaching a significant support area 60.422.
The underlined horizontal cluster clearly indicates a highly probable bullish movement with target 65.013 level.
P.S
We determine oversold/overbought condition with RSI indicator.
When it drops below 30 - the market is considered to be oversold.
When it bounces above 70 - the market is considered to be overbought.
Like and subscribe and comment my ideas if you enjoy them!

GBPUSD Will Go Higher From Support! Buy!
Here is our detailed technical review for GBPUSD.
Time Frame: 8h
Current Trend: Bullish
Sentiment: Oversold (based on 7-period RSI)
Forecast: Bullish
The market is on a crucial zone of demand 1.312.
The oversold market condition in a combination with key structure gives us a relatively strong bullish signal with goal 1.324 level.
P.S
Overbought describes a period of time where there has been a significant and consistent upward move in price over a period of time without much pullback.
Like and subscribe and comment my ideas if you enjoy them!

GBPJPY Will Go Up From Support! Long!
Take a look at our analysis for GBPJPY.
Time Frame: 6h
Current Trend: Bullish
Sentiment: Oversold (based on 7-period RSI)
Forecast: Bullish
The price is testing a key support 203.095.
Current market trend & oversold RSI makes me think that buyers will push the price. I will anticipate a bullish movement at least to 205.101 level.
P.S
Please, note that an oversold/overbought condition can last for a long time, and therefore being oversold/overbought doesn't mean a price rally will come soon, or at all.
Like and subscribe and comment my ideas if you enjoy them!

GBPAUD Will Go Higher! Buy!
Please, check our technical outlook for GBPAUD.
Time Frame: 1h
Current Trend: Bullish
Sentiment: Oversold (based on 7-period RSI)
Forecast: Bullish
The market is trading around a solid horizontal structure 2.007.
The above observations make me that the market will inevitably achieve 2.013 level.
P.S
The term oversold refers to a condition where an asset has traded lower in price and has the potential for a price bounce.
Overbought refers to market scenarios where the instrument is traded considerably higher than its fair value. Overvaluation is caused by market sentiments when there is positive news.
Like and subscribe and comment my ideas if you enjoy them!

AUDUSD Is Bullish! Long!
Please, check our technical outlook for AUDUSD.
Time Frame: 1h
Current Trend: Bullish
Sentiment: Oversold (based on 7-period RSI)
Forecast: Bullish
The market is approaching a significant support area 0.652.
The underlined horizontal cluster clearly indicates a highly probable bullish movement with target 0.653 level.
P.S
Please, note that an oversold/overbought condition can last for a long time, and therefore being oversold/overbought doesn't mean a price rally will come soon, or at all.
Like and subscribe and comment my ideas if you enjoy them!

USDJPY Will Move Lower! Sell!
Take a look at our analysis for USDJPY.
Time Frame: 15m
Current Trend: Bearish
Sentiment: Overbought (based on 7-period RSI)
Forecast: Bearish
The market is approaching a key horizontal level 154.303.
Considering the today's price action, probabilities will be high to see a movement to 154.127.
P.S
Overbought describes a period of time where there has been a significant and consistent upward move in price over a period of time without much pullback.
Like and subscribe and comment my ideas if you enjoy them!

Swing-trading ReturnsYou got to look long-term or use an outside view.
-using qullamaggie's 10/20/50 (upsloping) concept
and that
-you cant run away from 200dma.
Your best returns will be on periods with perfect setups.
Where you most likely want to know the best stocks to own?
//ie during upswingy or in-pattern VIX, small caps underperform etc.
simple but not easy.
ie the edge.
market forces.

SILVER Will Go Down! Short!
Here is our detailed technical review for SILVER.
Time Frame: 9h
Current Trend: Bearish
Sentiment: Overbought (based on 7-period RSI)
Forecast: Bearish
The market is testing a major horizontal structure 5,097.6.
Taking into consideration the structure & trend analysis, I believe that the market will reach 4,922.1 level soon.
P.S
We determine oversold/overbought condition with RSI indicator.
When it drops below 30 - the market is considered to be oversold.
When it bounces above 70 - the market is considered to be overbought.
Like and subscribe and comment my ideas if you enjoy them!

USDCHF Is Very Bullish! Buy!
Here is our detailed technical review for USDCHF.
Time Frame: 4h
Current Trend: Bullish
Sentiment: Oversold (based on 7-period RSI)
Forecast: Bullish
The market is on a crucial zone of demand 0.803.
The oversold market condition in a combination with key structure gives us a relatively strong bullish signal with goal 0.807 level.
P.S
The term oversold refers to a condition where an asset has traded lower in price and has the potential for a price bounce.
Overbought refers to market scenarios where the instrument is traded considerably higher than its fair value. Overvaluation is caused by market sentiments when there is positive news.
Like and subscribe and comment my ideas if you enjoy them!

NZDUSD Will Fall! Short!
Please, check our technical outlook for NZDUSD.
Time Frame: 1h
Current Trend: Bearish
Sentiment: Overbought (based on 7-period RSI)
Forecast: Bearish
The market is trading around a solid horizontal structure 0.564.
The above observations make me that the market will inevitably achieve 0.561 level.
P.S
Overbought describes a period of time where there has been a significant and consistent upward move in price over a period of time without much pullback.
Like and subscribe and comment my ideas if you enjoy them!
